Sensitivity analysis of the impact of part assignment in cellular manufacturing systems
Bạn đang xem bản rút gọn của tài liệu. Xem và tải ngay bản đầy đủ của tài liệu tại đây (313.77 KB, 12 trang )
Decision Science Letters 8 (2019) 109–120
Contents lists available at GrowingScience
Decision Science Letters
homepage: www.GrowingScience.com/dsl
Sensitivity analysis of the impact of part assignment in cellular manufacturing systems
Abdelghafour Al-Zawahreha, Nadia Dahmanib,c, Khaled Abu Alethemd and Adnan Mukattashd*
aDepartment
of Business Administration, Faculty of Economics and Administrative Sciences, Hashemite University, Zarqa Jordan
Laboratory, Institut Superieur de Gestion, 2000 Le Bardo, Tunisia
cDepartment of Management, Emirates College of Technology, Abu Dhabi, UAE
d
Department of Industrial Management, Emirates College of Technology, Abu Dhabi, UAE
CHRONICLE
ABSTRACT
Article history:
Optimality and efficiency are two measures that can be used by the system designer to select
Received November 18, 2017
or compare between different optimal layouts. At the same time, the system designer has three
Received in revised format:
choices of part assignment to cells in accordance with his needs (minimum sum of voids and
January 8, 2018
/or exceptions). Unfortunately, the impact of choosing the type of part assignment on
Accepted March 17, 2018
optimality and/or efficiency is not taken into consideration in any previous studies. In this
Available online
paper, a critical analysis of the impact of part assignment in cellular manufacturing systems is
March 17, 2018
elaborated on three cases borrowed from the literature. In the first case study, different
Keywords:
grouping efficiency measures were used on two different optimal distributions having the same
Cell formation
Part assignment
number of cells. These measures give different conflict evaluations, for that the designer’s
Optimal solution
decision to choose the optimal solution depends on the optimality rather than the efficiency.
Alternative optimal solution
For the second case, the analysis was performed using three types of part assignment on the
Grouping measures
same optimal system (same number of cells). The results showed that the designer’s decisions
depend on the constraints on the shop floor, since there is a conflict between the efficiency and
the optimality. For the third case, one type of part assignment was executed on one system with
different number of cells and the designer takes his decision based on the efficiency.
bLARODEC
© 2019 by the authors; licensee Growing Science, Canada.
1. Introduction
Group technology (GT) can be stated as a manufacturing philosophy for improving productivity in
batch production system (Srinivasan & Narendran, 1991). Ho and Moodie (1996) defined cellular
manufacturing (CM) as a direct application of GT in which a manufacturing system is partitioned into
subsystems. The first step in cell design is the cell formation. The primary objective of cell formation
is to generate distinct machine clusters and part families. Cell formation tries to create cells (machine
groups), where parts in each cell are deal with minimum interaction with other cells (Adil et al., 1996).
GT problem uses a zero-one matrix A where aij = 1 represents the relationship between component j to
machine i, and aij = 0, otherwise. When the components are divided into group families and machines
are categorized into cells we may build a transformed matrix with diagonal blocks where ones located
in the diagonal blocks and zeros are also located in the off-diagonal blocks. The resulted diagonal
blocks represent the manufacturing cells.
* Corresponding author. Tel.: +971 50 671 6172
E-mail address: (A. Mukattash)
© 2019 by the authors; licensee Growing Science, Canada.
doi: 10.5267/j.dsl.2018.3.004
110
The ideal situation appears when all the ones are in the diagonal blocks and all the zeros are located off
the diagonal blocks (Nair & Narendran, 1996 1998). However, this often does not happen in practice.
Thus, the most attractive solution for CM systems is to have minimum number of zero entries inside a
diagonal block and minimum number of ones entries outside the diagonal blocks (Suresh Kumar &
Chandrasekharan, 1990). Voids and exceptional elements have advance implications in terms of system
operations (for more details see Adil et al., 1996). Some of the important characteristics of the GT
problem are (Srivastava & Chen, 1995) as follows,
1. Number of cells: The desired number of machine cells and/or part families can be specified a priori
or determined by the solution approach a posteriori.
2. Cell size: To simplify managerial and control structures together with easier material coordination,
the number of machines in each cell needs to be limited.
Specifying the number of cells in advance is a managerial decision. This decision is generally based on
various factors such as total number of machines to be assigned to cells (cell size), physical constraints
on the shop floor, and labor relation issues (Gupta et al., 1995). In his model (Del Valle et al., 1994),
assumed that the maximum number of cells has to be established by the management. Crama and
Oosten (1996) developed a model for machine-part grouping, with additional constrains in order to
express limitations of a physical, technological or organizational nature. These limitations will be
cardinality constrains on the size or the number of cells. Moreover, as the number of cells increases,
material handling decreases. However, the number of bottleneck operations increases together with the
investment by the management too (Sarker & Balan, 1996). Some algorithms which do not impose any
restriction on the cell size or the maximum number of cells, and try to reacg the natural grouping from
the input matrix, will have some limitations since the quality of the solution depends on the initial
machine clusters which are used (Viswanathan, 1996). The effectiveness of a solution is normally
measured by its grouping efficiency (P Chandrasekharan & Rajagopalan, 1986) or grouping efficacy
(Suresh Kumar & Chandrasekharan 1990) or the total number of voids in the diagonal blocks and the
number of ones outside the blocks (Viswanathan, 1996).
The structure of the final machine-component matrix substantially influences on the effectiveness of
the corresponding CM system (Seifoddini & Djassemi, 1996). For this particular reason, the choice of
grouping methodology has to be based on some criteria, which could indicate the goodness of a
grouping solution. Therefore, a large number of grouping measures have been introduced to make an
assessment on the efficiency of the block diagonal forms. The commonly known grouping efficiency measures
in the literature are the Grouping efficiency (η) (P Chandrasekharan & Rajagopalan, 1986), Grouping
efficacy () (Suresh Kumar and Chandrasekhoran, 1990) , Grouping capability index (GCI) (Hsu, 1990) , Global
efficiency (GLE): (Harhalakis et al., 1990), Grouping measure (Miltenburg & Zhang, 1991), Grouping Index (γ)
(Nair & Narendran, 1996, 1998), Weighted Grouping Efficiency (Sarkar and Khan 2001 ) and Double weighted
grouping efficiency (Sarkar 2001 ). Grouping Cell Index (Mukattash, 2003), Modified Grouping Efficacy
measure (MGE), (Rajesh et al., 2016), Weighted Modified Grouping Efficacy (WMGE), (Al- Bashir et al., 2018),
Comprehensive Grouping Efficacy (CGE) (Mukattash et al., 2018), Grouping Cell Indicator (GCI), (Al- Bashir
et al., 2016).Weighted grouping efficacy ( ): (Ng, 1993), Modified grouping efficacy (2): (Nair & Narendran,
1996, 1998), Cell Utilization (CU): (Mahdavi et al., 2007) and Measure of Flexibility (MF): (Nagendra
Parashar, 2004).
For other measures that are available in the literature (See Sarker, 1999; Sarker & Khan, 2001; Sarker
& Khan, 2001; Keeling et al., 2007; Mukattash et al., 2018). According to Lee and Ahn (2013) GT can
be used as a standard tool for assessing solutions based on a binary part-machine matrix without using
the ordinal data. Keeling et al. (2007) pointed out that the quality of machine and part groupings could
be evaluated using various objective functions, including grouping efficacy, grouping index, grouping
capability index, and doubly weighted grouping efficiency. In addition, they developed a grouping
genetic algorithm and reported that despite the fact that there are several studies on optimizing cell
A. Al-Zawahreh et al. / Decision Science Letters 8 (2019)
111
formations using efficiency measures, the cells which are formed this way do not always yield
optimized factory measures. Since the GT problem has a multi-objective nature, various objectives
have been proposed such as minimizing the number of inter-cell movements, the number or cost of
machines duplicated, the number of exceptional parts, machine utilization imbalance, or maximizing
summed similarities and machine utilization (for more details see Papaioannou & Wilson, 2011).
From the above it can realize that, the first problem in cell formation is how to minimize the number
of exceptional elements. If the designer wishes to form a cell regardless of the number of machines
inside the cell, then the number of zeroes inside the cell (voids) will increase. For that the designer will
face with two objectives of maximizing the utilization (by minimizing the zeroes inside the blocks) and
minimizing the inter-cell movements (minimize ones outside the blocks) (P Chandrasekharan &
Rajagopalan, 1986). Next, part assignment is executed to minimize the number of voids and/or the
number of exceptions. Cell size, labor relations, physical, technological, organizational, and
economical constraints are factors that make it necessary to choose the type of part assignment. This
means that there is a strong relationship between the type of part assignment and the constraints on the
shop floor. In cell formation the system designer has three choices of part assignment to cells in
accordance with his needs (minimum sum of voids and /or exceptions). The three choices of part
assignment will give the designer the ability to reduce the effects of some of the physical, technological,
or organizational constraints and hence reduces the transportation costs. Moreover, these choices will
give him more flexibility to choose or compare between different optimal cells. Optimality of cellular
manufacturing systems in cell formation can be achieved by finding all the possible ways of distribution
of n-machines to p-cells with no cell empty.
In the literature, there are many researchers tried to study the relationship between the types of part
assignment and other factors in cell formation (Rajamani et al., 1996; Adil et al., 1996; Chen &
Guerrero, 1994; Sarker & Balan, 1996; Kusiak & Cho, 1992; Chow & Hawaleshka, 1993; Mukattash
et al., 2002).
This paper introduces a sensitivity analysis for the impact of the type of part assignment using some of
the well-known grouping efficiency measures in cellular manufacturing systems. The three choices of
part assignment will give the designer the ability to reduce the effects of some of the physical,
technological, or organizational constraints and hence reduces costs. The analysis shows that, the
designer’s decision to choose the optimal manufacturing system may not necessarily depend on the
optimality and/or the efficiency of that system. For that, the effect of some constraints on the shop floor
should be taken into consideration to help him in his decision.
2. Commonly Known Grouping Efficiency Measures
The following definitions will be used in this paper:
Block: A sub-matrix of the machine component incidence matrix formed by the intersection of columns
representing a component family and rows representing a machine cell.
Voids (v): A zero element appearing in a diagonal block.
Exceptional element (or exception) (e): A one appearing in the off - diagonal blocks.
Perfect block-diagonal form: A block diagonal form in which all diagonal blocks contain ones and all
off-diagonal blocks contain zeros. Kumar and Chandrasekhoran (1990)
Sparsity (Block diagonal space) (B): Total number of elements within the diagonal blocks of the solved
matrix, (Sarker and Khan 2001).
Optimal solution: A system that contains minimum sum of voids and/or exceptions in the solved
matrix.
Alternative optimal solution: Two or more optimal systems having same sum of voids and exceptions
in the solved matrix.
The following grouping efficiency measures will be used to study the impact of the of part assignment
in cellular manufacturing systems.
112
According to P Chandrasekharan and Rajagopalan (1986) Grouping efficacy () is defined as:
1
(1)
,
1
where
Number of exceptional elements
Total number of operations in the MP matrix
and
Number of voids in the diagonal blocks
Total number of operations in the MP marix
.
(2)
k
,
k v e0
where k+e is the total number of operations in the MP matrix, k is the number of operations in the
diagonal block, e is the number of exceptions and finally, v is the number of voids.
Accourding to Nair and Narendran (1996), Grouping Index (γ) is defined as:
qev (1 q)(e0 A)
B
,
qev (1 q)(e0 A)
1
B
where A 0 for e0 B and A e 0 - B for e 0 greater than B can be written as follows,
1
1 - ,where
1
qev (1 - q )(e 0 - A)
and 1 - ,where
B
1
(3)
qev (1 - q )(e 0 - A)
and A is a correction
B
factor and B is the sparsity of the solved matrix and e0 is the number of exceptions, ev is the number of
voids and q is the weighted factor. Moreover, Hsu (1990) defines Grouping Capability Index (GCI) as
follows,
GCI 1
(4)
eo
e
where
eo: number of exceptional elements in the machine-component matrix.
e: total number of one entries in the machine-component matrix.
2.1 Impact of using different grouping efficiency measures on alternative optimal solutions
Grouping efficiency measures are effective tools to evaluate the effectiveness of the structure of the
final machine-component matrix in cellular manufacturing systems. In the following subsections the
impact of using more than grouping measure on alternative optimal solutions will be studied and
analyzed on two different case studies taken from the literature.
Illustration 1-a
The case study contains of 24 machines and 40 parts, taken from Nair and Narendran (1996). The
following table summarizes the results.
Table 1
Evaluation of different measures
Optimal
solution
# of
cells
Voids
Exceptions
(v)
(e)
v+e
# of
operations
inside the
cells
Grouping
Index ( ),
Grouping
Efficacy (τ)
(B)
Total number of
operations in
the MP matrix
Grouping
capability
index (GCI)
Sparsity
1st
7
7
19
26
131
143
124
0.8195
0.8267
0.867
2nd
7
19
7
26
131
119
112
0.8195
0.8116
0.940
113
A. Al-Zawahreh et al. / Decision Science Letters 8 (2019)
Table 1 shows that number of cells, sparsity and sum of the voids and the exceptions are constant for
the two solutions. Based on these measures the designer cannot choose the optimal or the best
distribution between the two solutions (v+e=26), since the three grouping measures give different
conflicting evaluations. For Grouping Index ( ), there is no difference between the two cells. For
Grouping Efficacy (τ), the designer has to choose the first solutions (minimum voids). For grouping
capability index (GCI), second solution has to be chosen (minimum exceptions). In other words the
designer has to ignore these grouping measures and make his decision based on the optimality rather
than the efficiency. In this situation where different grouping measures have been used for the two
alternative optimal solutions, the designer’s decision to choose one of them depends on his wish either
to choose minimum voids or minimum exceptions.
Illustration 1-b
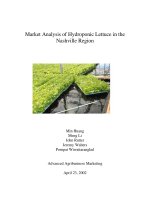
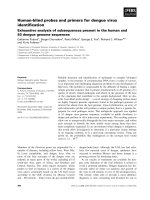
The case study contains of 6 machines and 6 parts (Fig.1), the problem was solved, using Kusiak’s
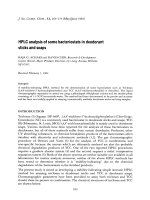
1987 original p-median formulation and Viswanathan’s 1996 revised p-median approach. The solution
obtained using Kusiak’s original p-median formulation and Viswanathan’s revised p-median approach
is given in Fig.2.
Parts
machines
1
2
3
4
5
6
1
0
1
1
0
0
0
2
1
0
0
1
0
1
3
0
0
0
1
1
0
4
1
1
0
0
0
1
5
0
1
1
0
0
0
6
1
0
0
0
1
0
Fig. 1. Machine-part matrix for the numerical example
Parts
machines
2
3
1
6
5
4
1
1
1
0
0
0
0
5
1
1
0
0
0
0
2
0
0
1
1
0
1
4
1
0
1
1
0
0
3
0
0
0
0
1
1
6
0
0
1
0
1
0
Number of voids in cells and ones outside cells = 4
Fig. 2. Solution for Kusiak’s and Viswanathan’s approach
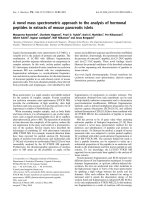
The second optimal solution was solved by Mukattash (2000), using the 3-cell approach and the
solution obtained is shown in Fig.3.
Parts
machines
2
3
1
4
6
5
1
1
1
0
0
0
0
5
1
1
0
0
0
0
2
0
0
1
1
1
0
4
1
0
1
0
1
0
3
0
0
0
1
0
1
6
0
0
1
0
0
1
Number of voids in cells and ones outside cells = 4
Fig. 3. Second optimal solution for Mukattash approach
114
Table 2
Evaluation of different measures for Fig. 1(efficiency of block-diagonal form)(q=0.5)
Figure
# machines in
1st cell
# machines
in 2nd cell
# machines
in 3rd cell
# parts in
1st cell
# parts in
2nd cell
2
3
2
2
2
3
2
1
2
2
2
2
# parts
in 3rd
cell
Grouping
Efficacy
0.73
0.73
e+v
2
2
4
4
ϒ
Grouping
Index
0.714
0.714
Table 2 shows that the two grouping measures give the same results for both optimal solutions. For
that the designer cannot take decision to choose one of these solutions based on grouping measures. In
both cases (illustration 1-a and 1-b) his decision will be made based on optimality rather than
efficiency.
2.2 Impact of using different types of Part assignment on one optimal solution
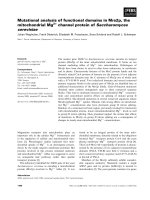
In order to study the impact of all types of part assignment on one optimal solution (distribution), we
consider the matrix given in Fig. 4 taken from the literature (Pachayappan & Panneerselvam, 2015).
The system contains of five machines and seven parts. In order to find the optimal solution(s) of this
system, different methods and algorithms from the literature will be used to form two, three and four
optimal distributions (cells). The optimal solution can be achieved by finding all the possible ways to
form two, three and four cells from five machines. Then part assignment will be performed to these
distributions with minimum sum of voids and/or exceptions. Finally, grouping efficiency of these
distributions can be found by using one of the well-known grouping measures called grouping efficacy.
machines
1
2
3
4
5
1
0
1
1
0
1
2
1
0
0
1
0
Parts
3
0
1
1
0
0
4
1
0
0
1
0
5
1
0
0
0
1
6
1
0
1
1
0
7
0
0
1
0
1
Fig. 4. Machine-part matrix for the numerical example
Cell Formation
All possible ways to form 2-cells from 5- machines with no cell empty will be studied using the
interactive algorithm developed by Mukattash et al. (2017). All the possible ways of forming the two
cells are equal to 15 ways. Then part assignment will be accomplished to all these ways with minimum
sum of voids and/or exceptions. Moreover, grouping efficacy will be used to find the efficiency of the
fifteenth distributions.
From Table 3, it is clear that the second and the eighth distribution have the minimum exceptions (e=2).
According to the definition of the optimality, both distributions are optimal. Having more than one
optimal distribution will give the designer the flexibility to choose the most adequate one, so he can
avoid some of the constraints on the shop floor. But according to the efficiency (τ), the designer will
choose the eighth distribution which has the highest quality (0.70). In this case the grouping measure
of efficiency has different impacts on the same system having the same number of minimum
exceptions. In both cases the optimal distributions have different values of efficiency (0.51 for the
second distribution and 0.70 for the eighth distribution). In this case the designer decision will depend
on the constraints on the shop floor, since there is a contradictory between efficiency and optimality.
The optimal solution for both distributions are shown in Fig. 5 and Fig. 6.
115
A. Al-Zawahreh et al. / Decision Science Letters 8 (2019)
Table 3
All possible distributions to form 2-cells from 5-machines with minimum exceptions
#
1
2
All possible
distributions with
minimum exceptions
(m1)(m2m3m4m5)
(m2)(m1m3m4m5)
# of
exceptions
(e)
4
# of
voids
(v)
7
11
e+v
Sparsity
(B)
11
13
3
4
5
6
7
8
(m3)(m1m2m4m5)
(m4)(m1m2m3m5)
(m5)(m1m2m3m4)
(m1m2)(m3m4m5)
(m1m3)(m2m4m5)
(m1m4)(m2m3m5)
4
3
3
6
7
2
10
9
9
8
8
4
9
10
11
12
13
14
15
(m1m5)(m2m3m4)
(m1m2m3)(m4m5)
(m1m2m4)(m3m5)
(m1m2m5)(m3m4)
(m2m3)(m1m4m5)
(m2m4)(m1m3m5)
(m2m5)(m1m3m4)
5
6
4
6
3
5
4
7
7
6
7
5
8
6
2
2
1
3
4
5
3
1
0
1
0
0
# of operations
inside the cells
19
25
Total number
of operations in
the MP matrix
16
16
14
12
12
14
15
6
22
22
22
18
17
18
16
16
16
16
16
16
12
13
13
10
9
14
0.70
12
13
10
13
8
13
10
18
17
18
17
18
19
18
16
16
16
16
16
16
16
11
10
12
10
13
11
12
0.47
0.43
0.54
0.43
0.62
0.45
0.54
1
1
0
1
0
1
Parts
4
2
0
1
0
1
0
0
1
0
1
0
5
0
1
0
0
1
12
14
6
0
1
1
1
0
Grouping
Efficacy
(τ)
0.52
0.51
Optimality vs.
Efficiency
First optimal
solution with
minimum
exceptions (e=2)
0.46
0.52
0.52
0.41
0.37
Second optimal
solution with
minimum
exceptions ( e=2)
and the highest
efficiency (τ= 0.7)
7
0
0
1
0
1
Fig. 5. First optimal 2-cell solution with minimum exceptions
1
4
2
3
5
2
1
1
0
0
0
4
1
1
0
0
0
6
1
1
0
1
0
Parts
5
1
0
0
0
1
1
0
0
1
1
1
3
0
0
1
1
0
7
0
0
0
1
1
Fig. 6. Second optimal 2-cell solution with minimum exceptions and highest efficiency
From Table 4, it is clear that the first and the eighth distribution have the minimum voids (v=3). For
that these distributions will be the optimal distributions among the fifteenth distributions. According to
optimality the designer will choose the two distributions. According to efficiency (τ) the eighth
distribution with τ = 0.73 will be chosen by the designer. In both cases the optimal distributions have
different values of efficiency (0.37 for the first distribution and 0.73 for the eighth distribution). In this
case the designer’s decision depends on the constraints on the shop floor, since there is a contradiction
between the efficiency and the optimality. Also in this case the grouping measure of efficiency has
different impacts on the same system having the same number of minimum voids. The optimal solutions
for both distributions are shown in Fig. 7 and Fig. 8. In this case the shop floor constraints will be taken
into consideration to choose the most adequate distribution.
116
Table 4
All possible distributions to form 2-cells from 5-machines with minimum voids
#
All possible
# of
# of
e+v
Sparsity
Total number
# of operations
( )
distributions with
exceptions
voids
(B)
of operations in
inside the cells
minimum voids
(m1)(m2m3m4m5)
(e)
(v)
1
9
3
12
10
16
7
0.37
2
(m2)(m1m3m4m5)
11
5
16
10
16
5
0.23
3
(m3)(m1m2m4m5)
10
4
14
10
16
6
0.30
4
5
6
7
8
(m4)(m1m2m3m5)
(m5)(m1m2m3m4)
(m1m2)(m3m4m5)
(m1m3)(m2m4m5)
(m1m4)(m2m3m5)
10
10
6
7
2
4
4
7
6
3
14
14
13
13
5
10
10
17
15
17
16
16
16
16
16
6
6
10
9
14
0.30
0.30
0.43
0.41
0.73
9
10
11
12
13
14
15
(m1m5)(m2m3m4)
(m1m2m3)(m4m5)
(m1m2m4)(m3m5)
(m1m2m5)(m3m4)
(m2m3)(m1m4m5)
(m2m4)(m1m3m5)
(m2m5)(m1m3m4)
6
6
6
6
3
6
4
6
7
6
6
5
7
5
12
13
12
12
8
13
9
16
17
16
16
18
17
17
16
16
16
16
16
16
16
10
10
10
10
13
10
12
0.45
0.43
0.45
0.45
0.62
0.43
0.57
Optimality vs.
Efficiency
the MP matrix
First optimal
solution with
minimum voids
(v=3)
Second optimal
solution with
minimum voids
(v=3) and highest
efficiency(τ= 0.73)
Parts
2
1
0
0
1
0
1
2
3
4
5
3
0
1
1
0
0
4
1
0
0
1
0
5
1
0
0
0
1
6
1
0
1
1
0
7
0
0
1
0
1
1
0
1
1
0
1
Fig. 7. First optimal 2-cell solution with minimum voids
2
1
1
0
0
0
1
4
2
3
5
4
1
1
0
0
0
5
1
0
0
0
1
Parts
6
1
1
0
1
0
1
0
0
1
1
1
3
0
0
1
1
0
7
0
0
0
1
1
Fig. 8. Second optimal 2-cell solution with minimum voids and highest efficiency
From Table 5, it is clear that there is one optimal solution with (e+ v=5) and the efficiency of the system
is 0.73. The optimal solution is shown in Fig. 9.
Table 5
Optimal solution with minimum sum of voids and exceptions
#
Optimal solution
from all possible
distributions to form
2-cells from 5machinews with
minimum sum of
voids and exceptions
(m1m4)(m2m3m5)
# of
exceptions
(e)
# of
voids
(v)
e+v
Sparsity
(B)
Total number of
operations in
the MP matrix
# of operations
inside the cells
2
3
5
17
16
14
(
)
0.73
Optimal solution
Optimal solution with
minimum sum of
voids and exceptions
(e+v=5) and highest
efficiency (
0.73)
=
117
A. Al-Zawahreh et al. / Decision Science Letters 8 (2019)
2
1
1
0
0
0
1
4
2
3
5
4
1
1
0
0
0
5
1
0
0
0
1
Parts
6
1
1
0
1
0
1
0
0
1
1
1
3
0
0
1
1
0
7
0
0
0
1
1
Fig. 9. Optimal 2-cell solution with minimum sum of voids and exceptions
Using the three types of part assignment on the same system (two cells- with alternative optimal
solutions) (Table 3, 4 and 5), the designer has three options of optimal manufacturing distributions.
These options will give him more flexibility to avoid more constraints on the shop floor. Moreover, it
is clear that the choice of part assignment may change the efficiency of the optimal solution. The impact
of different types of part assignment (minimum sum of exceptions and/ voids) for the same system with
different optimal cell layouts will change the designer’s decision. While choosing one type of part
assignment for alternative optimal solution (same cell size) may lead to us to face with some conflict
between the optimality and the efficiency (Table 3 and 4 and related Figs. 5-8). In this case, the
designer’s decision will be based on the constraint on the shop floor.
2.3 Impact of using one type of part assignment on different optimal distributions
In order to study and analyze the effect of using one type of part assignment (minimum sum of voids
and exceptions) on different optimal distributions of the same system, the same problem in Fig. 4. is
solved to form 3-cells and 4-cells from 5-machines.
Cell Formation
From the literature, any method can be used to find all the possible distributions to form 3-cells from
5-machines with no cell empty. Then part assignment was done with minimum sum of voids and
exceptions as shown below in Table 6. The optimal solution is shown in Figure 10.
Table 6
Optimal solution with minimum sum of voids and exceptions
#
Optimal solution from
all possible
distributions to form
3-cells from 5machinews with
minimum sum of
voids and exceptions
(m2m3)(m1m4)(m5)
# of
exceptions
(e)
# of
voids
(v)
e+v
Sparsity
(B)
Total number of
operations in the
MP matrix
# of operations
inside the cells
(τ)
4
0
4
12
16
12
0.75
2
3
1
4
5
1
1
1
0
0
1
3
1
1
0
0
0
2
0
0
1
1
0
Parts
4
0
0
1
1
0
6
0
1
1
1
0
5
0
0
1
0
1
Optimal
solution
Optimal
7
0
1
0
0
1
Fig. 10. Optimal 3-cell solution with minimum sum of voids and exceptions
Cell Formation
In the same way the same problem in Fig. 1 has been solved to form 4-cells from 5-machines using any
method from the literature as shown in Table 7. The optimal solution is shown in Fig. 11.
118
Table 7
Optimal solution with minimum sum of voids and exceptions
#
Optimal solution from
all possible distributions
to form 4-cells from 5machinews with
minimum sum of voids
and exceptions
(m2)(m3)(m1m4)(m5)
# of
exceptions
(e)
# of
voids
(v)
e+v
Sparsity
(B)
Total number of
operations in the
MP matrix
# of operations
inside the cells
(τ)
6
0
6
10
16
10
0.62
2
3
1
4
5
1
1
1
0
0
1
3
1
1
0
0
0
7
0
1
0
0
1
Parts
2
0
0
1
1
0
4
0
0
1
1
0
6
0
1
1
1
0
Optimal
solution
Optimal
5
0
0
1
0
1
Fig. 11. Optimal 4-cell solution with minimum sum of voids and exceptions
From Table 5, 6 and 7, the system designer can choose between different optimal cells layout. The
selection between these layouts is based on the efficiency. In this case he may choose the three cell
formation with the efficiency equal to 0.75. It is clear that, the impact of the same type of part
assignment (minimum sum of voids and exceptions) on the same system with different number of cells
is different for each layout. For that, the choice of the most adequate solution among these optimal
distributions may depend totally on efficiency.
3. Discussion and Conclusion
Optimal cell solutions can be reached by finding all possible ways to form n-distinguishable machines
into p-indistinguishable cells with no empty cell. All these possible ways will give the designer the
flexibility of choosing the machine(s) inside the cell. In this paper, the impact of part assignment in
cellular manufacturing systems has been studied for three case studies. The three cases have shown that
the system designer cannot depend totally on optimality and/or efficiency as an effective tool to choose
or compare between alternative optimal solutions. This is due to the conflicting objectives between
optimality and efficiency. Moreover, the choice of the type of part assignment has a big impact on the
manufacturing systems. In general the analysis of the impact of part assignment in cellular
manufacturing systems has shown that:
Alternative optimal solutions will give the designer more flexibility and in this case he can
control the cell size and avoid the effects of some constraints on the shop floor.
Using different grouping efficiency measures at the same time will make the designer more
confused in taking his decision.
The constraints on the shop floor will force the designer to choose the type of part
assignment.
Contradictory between the optimality and the efficiency in cellular manufacturing systems
will make the designer more confused and in this case the type of part assignment and the
constraints on the shop floor will be an effective tool to help him.
References
Adil, G. K., Rajamani, D., & Strong, D. (1996). Cell formation considering alternate
routeings. International Journal of Production Research, 34(5), 1361-1380.
Al-Bashir, A., Mukattash, A., Dahmani, N., & Al-Abed, N. (2018). Critical analysis of modified
grouping efficacy measure; new weighted modified grouping efficiency measure. Production &
Manufacturing Research, 6(1), 113-125.
A. Al-Zawahreh et al. / Decision Science Letters 8 (2019)
119
Al-Bashir, A. A., Mukattash, A. M., Muqattash, R. S., Al-Tal, S. Y., & Qamar, A. M. (2016). Grouping
Cell Indicator: A Modified Cell Formation Grouping Measure. Middle-East Journal of Scientific
Research, 24(7), 2309-2320.
Chen, H. G., & Guerrero, H. H. (1994). A general search algorithm for cell formation in group
technology. The International Journal of Production Research, 32(11), 2711-2724.
Chow, W. S., & Hawaleshka, O. (1993). Minimizing intercellular part movements in manufacturing
cell formation. The International Journal of Production Research, 31(9), 2161-2170.
Crama, Y., & Oosten, M. (1996). Models for machine-part grouping in cellular
manufacturing. International Journal of Production Research, 34(6), 1693-1713.
Del Valle, A. G., Balarezo, S., & Tejero, J. (1994). A heuristic workload-based model to form cells by
minimizing intercellular movements. The International Journal of Production Research, 32(10),
2275-2285.
Gupta, Y. P., Gupta, M. C., Kumar, A., & Sundram, C. (1995). Minimizing total intercell and intracell
moves in cellular manufacturing: a genetic algorithm approach. International Journal of computer
integrated manufacturing, 8(2), 92-101.
Harhalakis, G., Nagi, R., & Proth, J. M. (1990). An efficient heuristic in manufacturing cell formation
for group technology applications. The International Journal of Production Research, 28(1), 185198.
Ho, Y. C., & Moodie, C. L. (1996). Solving cell formation problems in a manufacturing environment
with flexible processing and routeing capabilities. International Journal of Production
Research, 34(10), 2901-2923.
Hsu, C.P. (1990). Similarity coefficient approaches to machine-component cell formation in cellular
manufacturing: a comparative study. PhD thesis,Industrial and Systems Engineering, University of
Wisconsin-Milwaukee.
Keeling, K. B., Brown, E. C., & James, T. L. (2007). Grouping efficiency measures and their impact
on factory measures for the machine-part cell formation problem: A simulation study. Engineering
Applications of Artificial Intelligence, 20(1), 63-78.
Kusiak, A. (1987). The generalized group technology concept. International journal of production
research, 25(4), 561-569.
Kusiak, A., & Cho, M. (1992). Similarity coefficient algorithms for solving the group technology
problem. The International Journal Of Production Research, 30(11), 2633-2646.
Lee, K., & Ahn, K. I. (2013). GT efficacy: a performance measure for cell formation with sequence
data. International Journal of Production Research, 51(20), 6070-6081.
Mahdavi, I., Javadi, B., Fallah-Alipour, K., & Slomp, J. (2007). Designing a new mathematical model
for cellular manufacturing system based on cell utilization. Applied Mathematics and
Computation, 190(1), 662-670.
Miltenburg, J., & Zhang, W. (1991). A comparative evaluation of nine well-known algorithms for
solving the cell formation problem in group technology. Journal of operations management, 10(1),
44-72.
Mukattash, A. M., Tahboub, K. K., & Adil, M. B. (2017). Interactive design of cellular manufacturing
systems, optimality and flexibility. International Journal on Interactive Design and Manufacturing
(IJIDeM), 1-8.
Mukattash, A. (2003). Grouping Cell Index : A Modified Cell Formation Grouping Measure.
Proceedings of the 31st International Conference on Computers and Industrial Engineering, San
Francesco, USA.
Mukattash, A. M., Adil, M. B., & Tahboub, K. K. (2002). Heuristic approaches for part assignment in
cell formation. Computers & industrial engineering, 42(2-4), 329-341.
Mukattash, A., Dahmani, N., Al-Bashir, A., & Qamar, A. (2018). Comprehensive grouping efficacy:
A new measure for evaluating block-diagonal forms in group technology. International Journal of
Industrial Engineering Computations, 9(1), 155-172.
120
Nair, G. J. K., & Narendran, T. T. (1996). Grouping index: a new quantitative criterion for goodness
of block-diagonal forms in group technology. International Journal of Production
Research, 34(10), 2767-2782.
Nair, G. J., & Narendran, T. T. (1998). CASE: A clustering algorithm for cell formation with sequence
data. International journal of production research, 36(1), 157-180.
Nagendra Parashar, B.S. (2004), Evaluation of cellular manufacturing systems design- VEDO
Analysis, Industrial Engineering Journal, 33(6),pp.4-8.
Ng, S. M. (1993). Worst-case analysis of an algorithm for cellular manufacturing. European Journal
of Operational Research, 69(3), 384-398.
Papaioannou, G., & Wilson, J. M. (2010). The evolution of cell formation problem methodologies
based on recent studies (1997–2008): Review and directions for future research. European journal
of operational research, 206(3), 509-521.
Pachayappan, M., & Panneerselvam, R. (2015). Hybrid genetic algorithm for machine-component cell
formation. Intelligent Information Management, 7(03), 107.
P Chandrasekharan, M., & Rajagopalan, R. (1986). An ideal seed non-hierarchical clustering algorithm
for cellular manufacturing. International Journal of Production Research, 24(2), 451-463.
Rajesh, K. D., Chalapathi, P. V., Chaitanya, A. B. K., Sairam, V., & Anildeep, N. (2006). Modified
grouping efficacy and new average measure of flexibility: performance measuring parameters for
cell formation applications. ARPN Journal of Engineering and Applied Sciences, 11(15), 92129215.
Rajamani, D., Singh, N., & Aneja, Y. P. (1996). Design of cellular manufacturing
systems. International journal of production research, 34(7), 1917-1928.
Sarker, B. R., & Balan, C. V. (1996). Cell formation with operation times of jobs for even distribution
of workloads. International Journal of Production Research, 34(5), 1447-1468.
Sarker, B. R. (1999). Grouping efficiency measures in cellular manufacturing: a survey and critical
review. International Journal of Production Research, 37(2), 285-314.
Sarker, B. R. (2001). Measures of grouping efficiency in cellular manufacturing systems. European
Journal of Operational Research, 130(3), 588-611.
Sarker, B. R., & Balan, C. V. (1996). Cell formation with operation times of jobs for even distribution
of workloads. International Journal of Production Research, 34(5), 1447-1468.
Sarker, B. R., & Khan, M. (2001). A comparison of existing grouping efficiency measures and a new
weighted grouping efficiency measure. Iie Transactions, 33(1), 11-27.
Seifoddini, H., & Djassemi, M. (1996). A new grouping measure for evaluation of machine-component
matrices. International Journal of Production Research, 34(5), 1179-1193.
Srinivasan, G., & Narendran, T. T. (1991). GRAFICS—a nonhierarchical clustering algorithm for
group technology. The International Journal of Production Research, 29(3), 463-478.
Srivastava, B., & Chen, W. H. (1995). Efficient solution for machine cell formation in group
technology. International Journal of Computer Integrated Manufacturing, 8(4), 255-264.
Suresh Kumar, C., & Chandrasekharan, M. P. (1990). Grouping efficacy: a quantitative criterion for
goodness of block diagonal forms of binary matrices in group technology. International Journal of
Production Research, 28(2), 233-243.
Viswanathan, S. (1995). Configuring cellular manufacturing systems: a quadratic integer programming
formulation and a simple interchange heuristic. The International Journal of Production
Research, 33(2), 361-376.
Viswanathan, S. (1996). A new approach for solving the P-median problem in group
technology. International Journal of Production Research, 34(10), 2691-2700.
© 2019 by the authors; licensee Growing Science, Canada. This is an open access article
distributed under the terms and conditions of the Creative Commons Attribution (CC-BY)
license ( />