GRAHP TOP model for supplier selection in Supply Chain: A hybrid MCDM approach
Bạn đang xem bản rút gọn của tài liệu. Xem và tải ngay bản đầy đủ của tài liệu tại đây (560.49 KB, 16 trang )
Decision Science Letters 8 (2019) 65–80
Contents lists available at GrowingScience
Decision Science Letters
homepage: www.GrowingScience.com/dsl
GRAHP TOP model for supplier selection in Supply Chain: A hybrid MCDM approach
Venkata Krishnarao Kogantia, Nagaraju Menikondab, S. P. Anbuudayasankarc*, T. Krishnarajc,
Rajesh Kumar Athhukurid and Mokkapati Sai Vastave
aThe
University of Texas, Dallas, USA
Stralsund University of Applied Sciences, Germany
cAmrita School of Engineering,Amrita Vishwa Vidhyapeetham, India
dInfosys Limited, India
eHAN University of Applied Sciences, Netherlands
CHRONICLE
ABSTRACT
Article history:
Decision makers of various disciplines are facing challenges because of vast availability of
Received November 18, 2017
options in the real world. Even though each and every decision made by a decision maker is
Received in revised format:
being done with a great knowledge and conscience, the decision maker needs suitable support to
April 28, 2018
choose the most favorable option to acquire great results in an agile environment. Supplier
Accepted May 4, 2018
selection is imperative for an efficient supply chain management. Many industries are in need of
Available online
effective decision making tools which aids them in valuable supplier selection. This paper
May 5, 2018
proposes a model using Multi Criteria Decision Making (MCDM) tools viz., Grey Relational
Keywords:
Analysis (GRA), Analytical Hierarchy Process (AHP) and Technique for Order Performance by
AHP
GRA
Similarity to Ideal Solution (TOPSIS). GRA is used to shortlist the criteria from the available
MCDM
options, while AHP is used to assign weights to the criteria. The final supplier in the selection
Supplier selection
process is obtained using TOPSIS. The proposed GRA-AHP-TOPSIS model (GRAHP TOP) is
TOPSIS
used to analyze and formulate the important criteria and the applicability of the model is tested
on a case of a small scale industry located in South India.
bHochschule
© 2019 by the authors; licensee Growing Science, Canada.
1. Introduction
Multi-criteria decision making (MCDM) techniques are used where there are several conflicting criteria
through which a decision has to be made. MCDM works with prioritizing, organizing and solving
problems involving multiple criteria. It aids the decision makers and gives a better understanding of the
problem. These tools take into account of the opinion of various decision makers and gives importance
to each decision maker’s opinion. The abstract of the optimal solution is being replaced by a nondominated set of solutions and it makes decision maker to choose from these set of solutions. However,
the solutions to a set of non-dominated criterions are too large to be evaluated by the decision makers
to conclude to a solution. Hence, we need different tools to address the issue of problems with multiple
attributes. Several tools have been used to address multi criteria problems over a period of time. So it
needs significant amount of time to investigate on the tools which can provide better solutions for a
variety of such problems. So hybridization of the tools may be used to utilize the expertise of an array
* Corresponding author.
E-mail address: (S.P.Anbuudayasankar)
© 2019 by the authors; licensee Growing Science, Canada.
doi: 10.5267/j.dsl.2018.5.002
66
of tools. Supplier selection is one of the key processes in supply chain in which the heads of the firm
select the best suppliers from all the available sources. Since the process plays an important role in
determining the accomplishment of the system there should be a specific scientific process to select a
supplier, rather than mere brainstorming and taking a decision. Though there are plenty of researches
carried out in the supplier selection and there are several hybridization of tools (Prasad et al., 2017).
Recently there is an increase in the usage of hybrid MCDM (HMCDM) to assist the decision maker.
The primary reason is the credence in the results obtained when more than one method is combined to
solve multiple criteria problem. HMCDM can address challenging problems involving diverse and
complex information. In this paper an attempt has been made to develop a HMCDM combining Grey
Relation Analysis (GRA), Analytical Hierarchy Process (AHP) and Technique for Order of Preference
by Similarity to Ideal Solution (TOPSIS).
2. Literature review
Conventional decision-making methods are used to ameliorate overall sustainability and create efficient
organizations. During the past few years, there is a rapid increase in works aggregating sustainability
by using variety of MCDM. Huge amount of literature encapsulating these techniques have been
reported. The importance and usefulness of MCDM in supplier selection can be seen by the number of
papers on literature review alone. To quote some important review papers are Agarwal et al. (2011);
Govindan et al. (2015); Chai et al. (2013); Govindan and Jepsen. (2016); Ho et al. (2010); Mardani et
al. (2015a); Mardani et al. (2015b); Zare et al. (2016); Zavadskas et al. (2016); Renganath and Suresh,
(2016).
Table 1
Literature on criteria for supplier selection
Criteria
Commitment to Delivery
Schedule
Willingness of Supplier to
Continuously Improve Quality
Post Sale Service by Supplier
The Sample Quality Checking
Report
Financial Stability of the
Supplier
An ISO 9000 Certified
Supplier
Past Supply Record
Supply Capacity of Supplier
Packing Done to The Raw
Material by The Supplier
Geographical Position of the
Supplier
Authorized Suppliers for the
Material
Reference of Customers
Questionna
Reference
ire Code
Q1
Galankashi et al., 2016; Deng et al., 2014; Polat & Eray, 2015; Lima-junior &
Carpinetti, 2016; Adalı et al., 2016
Q2
Rezaei et al., 2014; Lima-junior & Carpinetti, 2016; Gupta & Barua, 2017;
Azimifard et al., 2018
Q3
Wan & Beil, 2009; Shemshadi et al., 2011
Q4
Rezaei et al., 2014; Deng et al., 2014; Polat & Eray, 2015; Lima-junior & Carpinetti,
2016; Singh et al., 2018
Q5
Rezaei et al., 2014; Junior et al., 2014; Büyüközkan & Çifçi, 2012; Mwikali &
Kavale, 2012
Q6
Rouyendegh & Saputro, 2014; Akman, 2015; Shemshadi et al., 2011; Mwikali &
Kavale, 2012
Q7
Deng et al., 2014; Peng, 2012; Rouyendegh & Saputro, 2014; Büyüközkan & Çifçi,
2012; Mwikali & Kavale, 2012; Hamdan & Cheaitou, 2017
Q8
Rezaei et al., 2014; Deng et al., 2014; Polat & Eray, 2015; Lima-junior & Carpinetti,
2016; Banaeian et al., 2018
Q9
Büyüközkan & Çifçi, 2012; Awasthi & Kannan, 2016; Petrudi et al., 2017
Q10
Q11
Q12
Rouyendegh & Saputro., 2014; Büyüközkan & Çifçi, 2012; Awasthi & Kannan,
2016
Rezaei et al., 2014; Deng et al., 2014; Polat & Eray, 2015; Lima-junior & Carpinetti,
2016
Rouyendegh & Saputro, 2014; Akman, 2015; Shemshadi et al., 2011; Mwikali &
Kavale., 2012
Supplier selection is one of the standards and, is extremely researched area in procuring and
subcontracting. In fact, analyses of literature in vendor selection specify a strong diversity in the
universal approaches for selection (Ho et al., 2010) and as well as in the assessment of criteria (Weber
et al., 1991).There are many criteria which affect the supplier selection. Busch (1962) and Dickson
(1966) institute that criteria similar to quality, assurances and delivery schedule are vital assessment
factors among many others like administration capability, value, manufacturing capability, monetary
67
V. K. Koganti et al. / Decision Science Letters 8 (2019)
position, labor associations, vendor standing, technical competence, post sales services and numerous
other relationship explicit qualities like reciprocal provisions and past business chronicles. The
effectiveness of the supplier selection depends on the preciseness of the criteria to be considered in the
process. Numerous literatures have been analyzed and a survey has been prepared with the criteria that
are considered as prominent ones. This survey was filled by experts from ten different firms. Table 1
shows the criteria that were considered in the questionnaire with which a survey is taken from 10
industries in South India. The criteria that are selected through literature review are used in different
scenarios by the above mentioned authors. They are systematically presented in Table 2.
Table 2
Literature on the scenario of criteria used for supplier selection
Criteria
Commitment to delivery schedule
Willingness of supplier to
continuously improve quality
Post sales service by supplier
Scenario
Supplier selection with incomplete and imprecise information
Subcontractors in railway industry
Supplier selection in automobile industry
Galankashi et al., 2016
Supplier selection in automobile supply chain
Lima-junior & Carpinetti, 2016
Supplier selection in airline retail industry
Supplier selection in automobile supply chain
Rezaei et al., 2014
Lima-junior & Carpinetti, 2016
Green supplier selection
Gupta & Barua.,2017
Supplier selection in steel industry
Azimifard et al., 2018
Supplier selection in Contracting
Supplier selection in petro chemical Industry
Wan & Beil, 2009
Shemshadi et al., 2011
Supplier in airline retail industry
The sample quality checking report Supplier selection with incomplete and imprecise information
Subcontractors selection in railway industry
Financial stability of the supplier
An ISO 9000 certified supplier
Past supply record
Supply capacity of supplier
Packing done to the raw material
by the supplier
Geographical position of the
supplier
Authorized suppliers for the
material
Reference of customers
Reference
Deng et al., 2014
Polat & Eray,2015
Rezaei et al., 2014
Deng et al., 2014
Polat & Eray, 2015
Supplier selection in automobile supply chain
Lima-junior & Carpinetti, 2016
Supplier selection in procurement
Supplier selection in automotive industry
Mwikali & Kavale, 2012
Junior et al., 2014
Supplier selection in airline retail industry
Rezaei et al., 2014
Green supplier selection
Büyüközkan & Çifçi, 2012
Supplier selection in automobile industry
Supplier selection in petro chemical industry
Akman, 2015
Shemshadi et al., 2011
Supplier selection in procurement
Mwikali & Kavale, 2012
Supplier selection in fertilizer industry
Rouyendegh & Saputro, 2014
Supplier selection in logistics industry
Supplier selection in procurement
Peng, 2012
Mwikali & Kavale, 2012
Supplier selection in fertilizer industry
Rouyendegh & Saputro, 2014
Supplier selection with incomplete and imprecise information
Deng et al., 2014
Green supplier selection
Büyüközkan & Çifçi, 2012
Green supplier selection
Hamdan & Cheaitou, 2017
Supplier selection in airline retail industry
Rezaei et al., 2014
Deng et al., 2014
Supplier selection with incomplete and imprecise information
Subcontractor selection in railway industry
Polat & Eray, 2015
Supplier selection in automobile supply chain
Lima-junior & Carpinetti, 2016
Supplier selection in agro-food industry
Banaeian et al., 2018
Green supplier selection
Green supplier selection
Büyüközkan & Çifçi, 2012
Awasthi & Kannan, 2016
Supplier selection in fertilizer industry
Green supplier selection
Rouyendegh & Saputro, 2014
Büyüközkan & Çifçi, 2012
Green supplier selection
Awasthi & Kannan, 2016
Supplier selection in airline retail industry
Supplier selection with incomplete and imprecise information
Rezaei et al., 2014
Deng et al., 2014
Subcontractor selection in construction industry
Polat and Eray, 2015
Supplier selection in automobile supply chain
Lima-junior & Carpinetti, 2016
Supplier selection in fertilizer industry
Supplier selection in automobile industry
Rouyendegh & Saputro, 2014
Akman, 2015
Supplier selection in petro chemical industry
Shemshadi et al., 2011
Supplier selection in procurement
Mwikali & Kavale, 2012
68
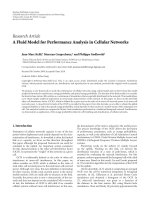
3. GRA – AHP – TOPSIS (GRAHP TOP)
Hybrid tool combination: (GRAHP TOP)
GRA
AHP
TOPSIS
Grey Relation Analysis (GRA) is used to find the Grey Relation Grades and is used to reduce the
uncertainty of the results and to prioritize the criteria that are considered. Short listing of criteria and a
pair wise comparison matrix has been formed using Analytical Hierarchy Process (AHP). Weights for
the criteria are obtained from AHP and these weights are further used in TOPSIS to find out the best
alternative from among all the alternatives available.
The proposed methodology consists of fifteen steps
Step 1: Identification of important criteria for selection using a survey
Step 2: Collection of the results for the calculation of the difference between sequences and reference
sequence
Step 3: Calculation of the grey relational coefficient
Step 4: Calculation of the grey relational grades
Step 5: Formulation of the aim of the work
Step 5: Evaluation of the criteria for selection of the alternatives
Step 6: Pair wise comparison using Saaty nine-point scale
Step 7: Computation of relative criteria weights
Step 8: Determination of consistency ratio
Step 9: Formulation of the decision matrix
Step 10: Calculation of the Standard Decision Matrix
Step 11: Construction of the Weighted Standard Matrix
Step 12: Determination of the ideal solution and the negative ideal solution
Step 13: Determination of the separation from the ideal solution Si*
Step 14: Determination of the separation from the negative ideal solution Si’
Step 15: Determination of the comparative closeness to the ideal solution to declare the best alternative
Generally, the data that is collected from survey will be uncertain like the uncertainties in subjective
judgments. People are not sure while making subjective decisions. In some cases information pertaining
to some attributes may not be available at all. Hence an uncertainty caused due to lack of data is a
common problem faced by a decision maker. So this incomplete information would give a vague output.
In order to avoid this and reduce the uncertainty in the survey values, GRA is used. GRA reduces the
fuzziness in the data and gives the output as Grey Relational Grades. Hence pre-processing of the data
is done to get the optimized output.
AHP has been the decision making methodology which is helpful in making judgments by breaking
down a complicated and complex problem into a multi-level hierarchy structure. It is one of the simplest
and powerful methodologies used to address MCDM problems (Mohanavelu et al., 2017). AHP method
is one of the best methodologies to prioritize various selection criteria. The AHP method is useful in
V. K. Koganti et al. / Decision Science Letters 8 (2019)
69
determining weights of the criteria and to find the consistency ratio which is used for examination of
the degree of consistency for the pair wise comparison (Saaty, 1980)
TOPSIS methodology is an MCDM system which enables the decision makers to establish the problem
in a simplified way, and carry out analysis. Also it helps in comparing and determining ranks of the
alternatives of actual problems (Hwang & Yoon, 1981). The rankings of the alternatives are obtained
by perceiving shortest distance from the ideal solution and the utmost distance from the negative ideal
solution. Cheng et al. (2002) report TOPSIS as the usefulness based methodology as it does the
comparison of each and every alternative directly depending on the available information that is
available in the evaluation matrices and weights. Also TOPSIS is one of the techniques that have
answered numerous real world glitches. TOPSIS is useful in attaining final ranking of supplier selection
criteria. Fig.1 summarizes the hybrid tool combination.
Fig. 1. Methodology - Hybrid tool combination - GRAHP TOP
4. Case study
A valve manufacturing industry is considered for the case study to validate the GRAHP TOP. The
company receives many outsourcing orders from medium and large scale industries. The design is
provided by an outsourcing company and manufactures the product from scratch i.e., procurement of
raw materials, manufacturing, quality checking and delivery of the product. Therefore, the company
70
requires suppliers to provide raw materials on a regular basis. Generally, the company manufactures
valves with cast iron and the company gets the material from five suppliers in lots whenever required.
Recently the company got an order from new outsourcing company to manufacturer piston cylinders
of cast iron. So it has to get the extra quantity of material from the available suppliers. All the five
suppliers are supplying the cast iron material for the manufacture of valves. Now the company has to
choose a supplier from regular pool and decide upon from whom to acquire the raw material for the
new product piston cylinder. Being associated with the existing suppliers for a long time the company
is in a position to evaluate the suppliers on different criteria. The proposed tool is applied to facilitate
effective supplier selection from the pool of available suppliers.
4.1 GRA
Grey relational analysis (GRA) technique was proposed by Deng in 1989 and has been effectively used
in unraveling a plethora of MCDM complications. It is used for addressing many problems in the
sectors like routing, business, academic, financial series, design evaluation problems etc. Generally,
for any problem, the solution begins with the questionnaire and the survey. So, better survey gives best
output. But it is found that the data that is collected from the survey is uncertain. So, in order to reduce
this uncertainty in the value, GRA is used. The procedure of GRA starts with finding the comparability
sequence from the performance of all alternatives. To proceed with the first step, an ideal sequence for
which all the criteria are rated as 5 on a 5 scale is defined. Then, the grey relational coefficient between
the comparability sequences and the ideal sequence is calculated. Finally, the grey relational degree
between ideal sequence and every comparability sequences are calculated with the help of grey
relational coefficients. Thus, the more the grade, the more important the sequence is.
A list of criteria is shown below with which the questionnaire for taking a survey from industry experts
is prepared.
Generally, the GRA is done in four steps:
1) Listing the results from questionnaire responses.
2) Derivation of the reference sequence.
3) Calculation of Grey Relation Coefficient.
4) Determination of Grey Relation Grade.
Step 1: A survey is taken on the scale of 5 from 10 Small and Medium scale Industries in south India
for the importance of the respective criteria in the selection process of the supplier.
Table 3
Survey values from 10 industry experts who are involved in supplier selection
Response from Experts
R1
R2
R3
R4
R5
R6
R7
R8
R9
R10
4
5
4
3
1
2
3
4
2
5
4
5
3
4
4
3
3
5
2
5
5
5
5
5
5
5
4
5
5
5
4
5
4
3
3
5
5
3
4
4
4
4
3
3
3
2
3
3
3
4
3
5
4
5
4
5
4
4
5
5
4
5
3
3
4
2
3
4
3
3
3
3
3
3
3
2
2
3
3
3
4
4
3
2
2
3
3
2
3
4
3
5
3
3
4
3
3
3
3
4
Let Xi (k) be the value of importance of with criteria given by the kth respondent.
3
3
4
4
4
3
3
3
3
4
4
4
5
5
4
5
5
4
4
5
71
V. K. Koganti et al. / Decision Science Letters 8 (2019)
Step 2: List the results from the questionnaire responses, and calculate the difference between
sequences with the reference sequence (1) (Table 4.)
e. X0(k)-Xi (k) =ΔXi (k)
(1)
Table 4
Difference with reference sequence values
Response
from
Experts
R1
R2
R3
R4
R5
R6
R7
R8
R9
R10
Q1
Q2
Q3
Q4
Q5
Q6
Q7
Q8
Q9
Q10
Q11
Q12
1
0
1
2
4
3
2
1
3
0
1
0
2
1
1
2
2
0
3
0
0
0
0
0
0
0
1
0
0
0
1
0
1
2
2
0
0
2
1
1
1
1
2
2
2
3
2
2
2
1
2
0
1
0
1
0
1
1
0
0
1
0
2
2
1
3
2
1
2
2
2
2
2
2
2
3
3
2
2
2
1
1
2
3
3
2
2
3
2
1
2
0
2
2
1
2
2
2
2
1
2
2
1
1
1
2
2
2
2
1
1
1
0
0
1
0
0
1
1
0
Step 3: Calculate the grey relational coefficient according to Eq. (2).
The grey relational coefficient (2) is calculated to express the relation between the reference sequence
and sequences to be compared for each effort driver.
ξ K
Δmin
ΔX K
pΔmax
pΔmax
(2)
Where,
Δ min = min imin kΔXi(k),
Δ max = max i max kΔXi(k).
Here "p" is called distinguishing coefficient and is taken as 0.5. The tenacity of the peculiar coefficient
is to increase/decrease the range of the grey relational coefficients.
Table 5
Calculated Grey Relational Coefficients
Response from
R1
R2
R3
R4
R5
R6
R7
R8
R9
R10
0.67
1
0.67
0.5
0.333
0.4
0.5
0.67
0.4
1
0.67
1
0.5
0.67
0.67
0.5
0.5
1
0.4
1
1
1
1
1
1
1
0.67
1
1
1
0.67
1
0.67
0.5
0.5
1
1
0.5
0.67
0.67
0.67
0.67
0.5
0.5
0.5
0.4
0.5
0.5
0.5
0.67
0.5
1
0.67.
1
0.67
1
0.67
0.67
1
1
0.67
1
0.5
0.5
0.67
0.4
0.5
0.67
0.5
0.5
0.5
0.5
0.5
0.5
0.5
0.4
0.4
0.5
0.5
0.5
0.67
0.67
0.5
0.4
0.4
0.5
0.5
0.4
0.5
0.67
0.5
1
0.5
0.5
0.67
0.5
0.5
0.5
0.5
0.67
0.5
0.5
0.67
0.67
0.67
0.5
0.5
0.5
0.5
0.67
0.67
0.67
1
1
0.67
1
1
0.67
0.67
1
Step 4: The grey relational grades, which are equal to the arithmetic mean of the grey relation
coefficients, is calculated. So, the arithmetic mean of Grey Relational Coefficients for the values of all
the 10 industries gives the final grey relational grade of the particular question/criteria/factor. The grey
relational grade characterizes the association between sequence and comparison sequence. If the
72
change in two factors shows the same tendency, it means that the extent of synchronous change is high,
as well as the degree of the correlation. Thus, the factor with high grey relational grade factor can more
possibly consider as an important factor that influences the selection of the supplier. (Table 6.)
Table 6
Calculated Grey Relational Grades
Criteria
GRG
Q1
0.613
Q2
0.69
Q3
0.967
Q4
0.717
Q5
0.54
Q6
0.817
Q7
0.59
Q8
0.48
Q9
0.52
Q10
0.583
Q11
0.567
Q12
0.833
From these Grey Relational Grades, the most prominent criteria are shortlisted and are provided to
AHP for further evaluation of those criteria and to find out the weights of those prioritized criteria.
Here among the eleven criteria that are considered five criteria are selected as prominent when
compared to the other criteria.
4.2 AHP
Analytical Hierarchy Process (AHP) is a structured technique which is used to make decisions in an
organized way. Developed by Dr. Thomas L Saaty in 1970’s, AHP is mostly used Multi Criteria
Decision Making process (Saaty, 1980). AHP is being widely used in engineering, manufacturing,
management, education, IT, medical sectors etc. (Vaidya & Kumar, 2006) due to its ease, simplicity
and flexibility. With AHP, the decision grows into the step-by-step process, which abridges decisionmaking, allows association and advances the value of decisions. It breaks down the problem into a
hierarchical structure consisting of several levels, such as goal, criteria and sub-criteria (Saaty, 1980;
Mangla et al., 2015a & Mangla et al., 2015b; Yazdani, 2014). Once the hierarchy tree is set up the
decision maker does the pairwise comparison by comparing two criteria at a time. This gives the
decision maker and evaluator a clear idea about the understanding of the problem. AHP takes
qualitative inputs and gives quantitative outputs. The steps used for this study in AHP are given as
follows:
Step 5: Formulation of the aim of the work: Evaluating the criteria of supplier selection which is a
common problem faced by companies, is the aim of AHP in this particular problem.
Step 6: Formulation of pair wise comparisons: Pair wise comparison is done by collecting data from
panel of experts. The panel consists of managing director and board of directors of the company who
are having a strong enterprise experience. The pair wise comparisons are done using Saatynine-point
scale
Step 7: Computation of relative weights: The final pair wise comparison matrix is used to determine
Eigen vectors and Eigen values, which are later processed to find the relative criteria weights.
Step 8: Determination of consistency ratio: The consistency ratio (CR) is computed to determine the
consistency of pair wise comparisons. The mathematical expression for finding CR is,
C.R=C.I/R.I,
(3)
Where consistency index is denoted by
(C.I) = (λmax - n) / (n - 1)
(4)
where λmax is the maximum Eigenvalue and n is the number of criteria being evaluated. The value of
the random consistency index (R.I) depends on the value of (n) as shown in Table 6. The value of C.R
should me less than 0.1 in order to have a better level of consistency. The shortlisted criteria are taken
as input from Grey Relational Analysis and is ranked using AHP. Five criteria were shortlisted out the
twelve. The panel of experts did a pairwise comparison for the shortlisted five criteria and relative
weights are found for the criteria as shown in Table below. (Table 7)
73
V. K. Koganti et al. / Decision Science Letters 8 (2019)
Table 7
Ranking of the shortlisted criteria using AHP
Shortlisted Criteria
Commitment to Delivery Schedule
Willingness of Supplier to Continuously Improve Quality
Post Sale Service by the Supplier
The Sample Quality Checking Report
Financial Stability of Supplier
Weight
0.275413
0.322713
0.137904
0.217610
0.046360
Ranking
2
1
4
3
5
The consistency of the ranking can be tested by calculating the Consistency Ratio (CR). CR calculates
to be 0.0785685 which is found using Eq. (3). The calculated CR is less than 0.1 which can be inferred
that the judgment is consistent.
The results of AHP are further given to TOPSIS for determining the best alternative. TOPSIS method
is used to determine the best alternative since it relates each alternative straightly depending on the data
in judgment matrices and weights.
4.3 TOPSIS
Technique for Order Performance by Similarity to Ideal Solution (TOPSIS) is a tool used for solving
MCDM complications in the real world and was technologically advanced by Hwang and Yoon in 1981
(Hwang & Yoon, 1981) and further developed by Lai and Liu (1993). It aids the decision maker to
organize and rank the alternatives. Based on the ranking the best alternative can be found. However, as
TOPSIS is applied to MCDM problems it will be a collective effort of decision makers. It compares
the distance between the alternatives from an ideal solution and non-ideal solution. The alternative
which is at least distance from ideal solution is the best alternative. (Belenson & Kapur, 1973; Zelany,
1974). Hwang and Yoon (1981) later proposed that the ranking of the alternatives will depend on on
the closest distance from the positive ideal solution (PIS) and the farthest distance from the negative
ideal solution (NIS). TOPSIS method ponders both the distances to PIS and NIS simultaneously and a
ranking order is given based on the relative closeness-distance. The advantages of TOPSIS are (Kim et
al., 1997): (i) a logic that represents the mindset of human choice; (ii) a measurable value that accounts
for both the ideal and non-ideal choices concurrently; (iii) an easy computation process that is easy to
program into a spreadsheet. These advantages make TOPSIS most frequently used tool along with
Analytical hierarchy process (AHP), ELECTRE and more. TOPSIS is a utility based method which
directly relates each alternative directly based on the data obtained in the evaluation matrices (Cheng
et al., 2002). In recent times TOPSIS found its wide application across different fields like human
resource management (Chen & Tzeng, 2004), transportation (Janic, 2003), product design (Kwong &
Tam, 2002), manufacturing (Milani et al., 2005), water management (Srdjevic et al., 2004), quality
control (Yang & Chou, 2005) and location analysis (Yoon & Hwang, 1985). The high flexibility of
TOPSIS allowed the decision makers to apply on various occasions and this enabled to further extend
the model and apply to multi-objective decision making (Yoon & Hwang1985) and group decision
making. TOPSIS is hybridized with various other MCDM tools to get a better output.
Step 9: Write the decision matrix.
This decision matrix values are the values obtained from a survey conducted in a company located in
South India. (Table 8.)
74
Table 8
Decision Matrix
Criteria
Commitment to Delivery
Schedule
Willingness of Supplier to
continuously improve quality
Post sale service by Supplier
The sample quality checking
report
Financial stability of the
supplier
Supplier 1
Supplier 2
Supplier 3
Supplier 4
Supplier 5
5
5
3
5
3
4
4
4
3
3
5
4
4
3
3
5
5
4
3
3
3
4
3
3
3
Step 10: Calculate the Standard Decision Matrix
Numerous attribute dimensions converted into non-dimensional attributes, which consents assessments
across criteria. Each column of decision matrix is divided by root of the sum of the square of respective
columns for the purpose of standardization. (Table 9.)
Table 9
Extra column is added showing the root of sum of squares
Criteria
Supplier 1
Supplier 2
Supplier 3
Supplier 4
Supplier 5
Commitment to Delivery
Schedule
Willingness of Supplier
to continuously improve
quality
Post sale service by
Supplier
The sample quality
checking report
Financial stability of the
Supplier
5
5
3
5
3
Root of sum of
squares
9.64365
4
4
4
3
3
8.124038
5
4
4
3
3
8.660254
5
5
4
3
3
9.165151
3
4
3
3
3
7.2111025
An extra column is added showing the root of sum of squares of respective criteria, each value in that
extra column divides each and every value in that particular row for making the decision matrix
standardized. (Table 9)
Table 10
Standard Decision Matrix
Criteria
Commitment to Delivery
Schedule
Willingness of Supplier to
continuously improve quality
Post sale service by Supplier
The sample quality checking
report
Financial stability of the
Supplier
Supplier 1
Supplier 2
Supplier 3
Supplier 4
Supplier 5
0.518475
0.518475
0.311085
0.518475
0.311085
0.492366
0.492366
0.492366
0.369274
0.369274
0.577350
0.461880
0.461880
0.346410
0.346410
0.545544
0.545544
0.436435
0.327326
0.327326
0.4160251
0.554700
0.4160251
0.4160251
0.4160251
Step 11: Construct the Weighted Standard Matrix
75
V. K. Koganti et al. / Decision Science Letters 8 (2019)
The weighted standardized decision matrix is constructed by multiplying criteria weights to each rating
in the standardized decision matrix. These criteria weights are already obtained from AHP before.
(Table 12)
Table 11
Multiplying criteria weight to each rating in the standardized decision matrix
Criteria
Commitment to
Delivery Schedule
Willingness of
Supplier to
continuously improve
quality
Post sale service by
Supplier
The sample quality
checking report
Financial stability of
the Supplier
Weights
0.275413
Supplier 1
0.518475
Supplier 2
0.518475
Supplier 3
0.311085
Supplier 4
0.518475
Supplier 5
0.311085
0.322713
0.492366
0.492366
0.492366
0.369274
0.369274
0.137904
0.577350
0.461880
0.461880
0.346410
0.346410
0.21761
0.545544
0.545544
0.436435
0.327326
0.327326
0.04636
0.4160251
0.554700
0.4160251
0.4160251
0.4160251
The criteria weights obtained from AHP are shown in Table 11. These criteria weights are multiplied
to every corresponding value in standardized decision matrix for making it weighted standardized
decision matrix.
Table 12
Weighted Standardized Decision Matrix
Criteria
Commitment to Delivery
Schedule
Willingness of Supplier to
continuously improve
quality
Post sale service by Supplier
The sample quality checking
report
Financial stability of the
Supplier
Supplier 1
0.142794
Supplier 2
0.142794
Supplier 3
0.085676
Supplier 4
0.142794
Supplier 5
0.085676
0.1588929
0.1588929
0.1588929
0.1191695
0.1191695
0.0796188
0.1187158
0.063695
0.1187158
0.063695
0.0949726
0.04777132
0.0712294
0.04777132
0.0712294
0.019286
0.0257158
0.019286
0.019286
0.019286
Step 12: Determine the ideal solution and the negative ideal solution.
The ideal solution and negative ideal solution are marked. (Table 13.)
A set of maximum values for each criterion is the Ideal solution.
A set of minimum values for each criterion is the Negative Ideal solution.
Table 13
Determining the ideal solution and the negative ideal solution
Criteria
Commitment to Delivery
Schedule
Willingness of Supplier to
continuously improve quality
Post sale service by Supplier
The sample quality checking
report
Financial stability of the Supplier
IDEAL SOLUTION
Supplier 1
Supplier 2
Supplier 3
Supplier 4
Supplier 5
0.142794
0.142794
0.085676
0.142794
0.085676
0.1588929
0.1588929
0.1588929
0.1191695
0.1191695
0.0796188
0.063695
0.063695
0.0477132
0.0477132
0.1187158
0.1187158
0.0949726
0.0712294
0.0712294
0.019286
0.0257158
0.019286
0.019286
0.019286
NEGATIVE IDEAL SOLUTION
76
Ideal solution = {0.20479469, 0.1925947, 0.09188, 0.1044032, 0.222987} = S*
Negative Ideal solution = {0.1535970, 0.10592695, 0.044872, 0.09, 0.1052995} = S’
Step 13: Determine separation from the ideal solution. Si*
Subtract the ideal solution from each value and square each value for more accuracy and all values in
an alternative will be added and named as Si*. (Table 14.)
Table 14
Separation from the ideal solution
Criteria
Commitment to
Delivery Schedule
Willingness of
Supplier to
continuously improve
quality
Post sale service by
Supplier
The sample quality
checking report
Financial stability of
the Supplier
Supplier 1
Supplier 2
Supplier 3
Supplier 4
Supplier 5
0
0
0.003262
0
0.003262
0
0
0
0.001577
0.001577
0
0.00025356
0.00025356
0.0010179
0.0010179
0
0
0.00056373
0.0022549
0.0022549
0.000041342
0
0.000041342
0.000041342
0.000041342
Step 14: Determine separation from the negative ideal solution Si’.
Subtract the negative ideal solution from each value and square each value for more accuracy and all
values in an alternative will be added and named as Si’. (Table 15.)
Table 15
Separation from the Negative ideal solution
Criteria
Commitment to Delivery
Schedule
Willingness of Supplier to
continuously improve
quality
Post sale service by
Supplier
The sample quality
checking report
Financial stability of the
Supplier
Supplier 1
Supplier 2
Supplier 3
Supplier 4
Supplier 5
0.003262
0.003262
0
0.003262
0
0.001577
0.001577
0.001577
0
0
0.0010179
0.000255418
0.000255418
0
0
0.0022549
0.0022549
0.00056373
0
0
0
0.00004134
0
0
0
Step 15: Determine comparative closeness to the ideal solution. (Table 16.)
Table 16
The comparative closeness of different suppliers
Criteria
Si*
Si’
Si*+ Si’
Si’/( Si*+ Si’)
Supplier 1
0.000041342
0.008118
0.008159342
0.994933
Supplier 2
0.00025356
0.0073906
0.00764416
0.966829
Supplier 3
0.0041206
0.00239615
0.00651675
0.367690
Supplier 4
0.004891
0.003262
0.008153
0.40
Supplier5
0.008153142
0
0.008153142
0
V. K. Koganti et al. / Decision Science Letters 8 (2019)
77
From Table 16, it is evident that “Supplier 1” is comparatively close to the positive ideal solution and
comparatively far from the negative ideal solution of the problem. So, “Supplier 1” is the best supplier
amongst the other alternatives mentioned.
5. Conclusion
The problems in conventional supply chain were studied and understood, that it is a drawback for the
enterprises in this competitive global market. A decision maker spends a great amount of time in
selecting the appropriate method. This is an important setback in the case of individual MCDM
methods. Hybrid approach combining more methods can consolidate the results for decision making,
thus making the decision making process efficient. One of the main benefits of hybrid tools over
traditional tools is to uncover a possibility of harmonizing subjective and objective criteria. A hybrid
tool was coined, combining GRA, AHP and TOPSIS considering the pros and cons of the tools. The
GRAPHTOP hybrid tool was then used to evaluate supply chain processes.
The GRAPHTOP was used to perform an analysis on small and medium scale industries in the selection
of suppliers and was applied to a small scale industry in South India. In the initial stage, GRA was used
to reduce the uncertainty and used to prioritize the criteria. Among the twelve criteria that were
considered initially, the five most important criteria were used for AHP. When the results were
analyzed, it is understood that the pair wise decision matrix made by the expert team is congruous as
the consistency ratio is less than 0.1. It shows that the decision made by the team is proper for the
further analysis. The results of GRA were used by AHP to give criteria weights to the shortlisted
criteria. Later at the final stage of testing of the tool TOPSIS was used to find the best alternative. The
tool analysis shows that supplier 1 is closer to the positive ideal solution which is evident that it is the
ideal option. The scope of the work can be extended to all industries and aid the decision makers in
MCDM scenarios.
Acknowledgement
The authors would like to thank the anonymous referees for constructive comments on earlier version
of this paper.
References
Adalı, E., Işık, A & Kundakcı, K. (2016). An alternative approach based on Fuzzy PROMETHEE
method for the supplier selection problem.Uncertain Supply Chain Management, 4(3), 183-194.
Agarwal, P., Sahai, M., Mishra, V., Bag, M., & Singh, V. (2011). A review of multi-criteria decision
making techniques for supplier evaluation and selection. International journal of industrial
engineering computations, 2(4), 801-810.
Akman, G. (2015). Evaluating suppliers to include green supplier development programs via fuzzy cmeans and VIKOR methods. Computers & industrial engineering, 86, 69-82.
Awasthi, A., & Kannan, G. (2016). Green supplier development program selection using NGT and
VIKOR under fuzzy environment. Computers & Industrial Engineering, 91, 100-108.
Azimifard, A., Moosavirad, S. H., & Ariafar, S. (2018). Selecting sustainable supplier countries for
Iran's steel industry at three levels by using AHP and TOPSIS methods. Resources Policy.
Banaeian, N., Mobli, H., Fahimnia, B., Nielsen, I. E., & Omid, M. (2018). Green supplier selection
using fuzzy group decision making methods: A case study from the agri-food industry. Computers
& Operations Research, 89, 337-347.
Belenson, S. M., & Kapur, K. C. (1973). An algorithm for solving multicriterion linear programming
problems with examples. Journal of the Operational Research Society, 24(1), 65-77.
Busch, G. (1962). New twist on supplier evaluation. Journal of Purchasing, 55(1), 102-103.
78
Büyüközkan, G., & Çifçi, G. (2012). A novel hybrid MCDM approach based on fuzzy DEMATEL,
fuzzy ANP and fuzzy TOPSIS to evaluate green suppliers. Expert Systems with Applications, 39(3),
3000-3011.
Chai, J., Liu, J. N., & Ngai, E. W. (2013). Application of decision-making techniques in supplier
selection: A systematic review of literature. Expert Systems with Applications, 40(10), 3872-3885.
Chen, M. F., & Tzeng, G. H. (2004). Combining grey relation and TOPSIS concepts for selecting an
expatriate host country. Mathematical and Computer Modelling, 40(13), 1473-1490.
Cheng, S., Chan, C. W., & Huang, G. H. (2002). Using multiple criteria decision analysis for supporting
decisions of solid waste management. Journal of Environmental Science and Health, Part A, 37(6),
975-990.
Deng, X., Hu, Y., Deng, Y., & Mahadevan, S. (2014). Supplier selection using AHP methodology
extended by D numbers. Expert Systems with Applications, 41(1), 156-167.
Dickson, G. W. (1966). An analysis of vendor selection systems and decisions. Journal of
purchasing, 2(1), 5-17.
Galankashi, M. R., Helmi, S. A., & Hashemzahi, P. (2016). Supplier selection in automobile industry:
A mixed balanced scorecard–fuzzy AHP approach. Alexandria Engineering Journal, 55(1), 93-100.
Govindan, K., Rajendran, S., Sarkis, J., & Murugesan, P. (2015). Multi criteria decision making
approaches for green supplier evaluation and selection: a literature review. Journal of Cleaner
Production, 98, 66-83.
Govindan, K., & Jepsen, M. B. (2016). ELECTRE: A comprehensive literature review on
methodologies and applications. European Journal of Operational Research, 250(1), 1-29.
Gupta, H., & Barua, M. K. (2017). Supplier selection among SMEs on the basis of their green
innovation ability using BWM and fuzzy TOPSIS. Journal of Cleaner Production, 152, 242-258.
Hamdan, S., & Cheaitou, A. (2017). Supplier selection and order allocation with green criteria: An
MCDM and multi-objective optimization approach. Computers & Operations Research, 81, 282304.
Hwang, C. L., & Yoon, K. (1981). Methods for multiple attribute decision making. Multiple Attribute
Decision Making (pp. 58-191).
Ho, W., Xu, X., & Dey, P. K. (2010). Multi-criteria decision making approaches for supplier evaluation
and selection: A literature review. European Journal of operational research, 202(1), 16-24.
Janic, M. (2003). Multicriteria evaluation of high-speed rail, transrapid maglev and air passenger
transport in Europe. Transportation Planning and Technology, 26(6), 491-512.
Junior, F. R. L., Osiro, L., & Carpinetti, L. C. R. (2014). A comparison between Fuzzy AHP and Fuzzy
TOPSIS methods to supplier selection. Applied Soft Computing, 21, 194-209.
Kim, G., Park, C. S., & Yoon, K. P. (1997). Identifying investment opportunities for advanced
manufacturing systems with comparative-integrated performance measurement. International
Journal of Production Economics, 50(1), 23-33.
Kwong, C. K., & Tam, S. M. (2002). Case-based reasoning approach to concurrent design of low power
transformers. Journal of Materials Processing Technology, 128(1-3), 136-141.
Lima-Junior, F. R., & Carpinetti, L. C. R. (2016). Combining SCOR® model and fuzzy TOPSIS for
supplier evaluation and management. International Journal of Production Economics, 174, 128141.
Mangla, S. K., Kumar, P., & Barua, M. K. (2015a). Risk analysis in green supply chain using fuzzy
AHP approach: A case study. Resources, Conservation and Recycling, 104, 375-390.
Mangla, S. K., Kumar, P., & Barua, M. K. (2015b). Flexible decision modeling for evaluating the risks
in green supply chain using fuzzy AHP and IRP methodologies. Global Journal of Flexible Systems
Management, 16(1), 19-35.
Mardani, A., Jusoh, A., MD Nor, K., Khalifah, Z., Zakwan, N., & Valipour, A. (2015a). Multiple
criteria decision-making techniques and their applications–a review of the literature from 2000 to
2014. Economic Research-Ekonomska Istraživanja, 28(1), 516-571.
V. K. Koganti et al. / Decision Science Letters 8 (2019)
79
Mardani, A., Jusoh, A., & Zavadskas, E. K. (2015b). Fuzzy multiple criteria decision-making
techniques and applications–Two decades review from 1994 to 2014. Expert Systems with
Applications, 42(8), 4126-4148.
Milani, A. S., Shanian, A., Madoliat, R., & Nemes, J. A. (2005). The effect of normalization norms in
multiple attribute decision making models: a case study in gear material selection. Structural and
multidisciplinary optimization, 29(4), 312-318.
Mwikali, R., & Kavale, S. (2012). Factors affecting the selection of optimal suppliers in procurement
management. International journal of Humanities and Social science, 2(14), 189-193.
Peng, J. (2012). Selection of logistics outsourcing service suppliers based on AHP. Energy
Procedia, 17, 595-601.
Petrudi, S., Abdi, M & Goh, M. (2018). An integrated approach to evaluate suppliers in a sustainable
supply chain.Uncertain Supply Chain Management, 6(4), 423-444.
Polat, G., & Eray, E. (2015). An integrated approach using AHP-ER to supplier selection in railway
projects. Procedia Engineering, 123, 415-422.
Prasad, K., Subbaiah, K & Prasad, M. (2017). Supplier evaluation and selection through DEA-AHPGRA integrated approach- A case study.Uncertain Supply Chain Management, 5(4), 369-382.
Renganath, K., & Suresh, M. (2016, December). Supplier selection using fuzzy MCDM techniques: A
literature review. In Computational Intelligence and Computing Research (ICCIC), 2016 IEEE
International Conference on (pp. 1-6). IEEE.
Rezaei, J., Fahim, P. B., & Tavasszy, L. (2014). Supplier selection in the airline retail industry using a
funnel methodology: Conjunctive screening method and fuzzy AHP. Expert Systems with
Applications, 41(18), 8165-8179.
Rouyendegh, B. D., & Saputro, T. E. (2014). Supplier selection using integrated fuzzy TOPSIS and
MCGP: a case study. Procedia-Social and Behavioral Sciences, 116, 3957-3970.
Saaty, T. L. (1980). The analytic hierarchy process: planning, priority setting, resources allocation. New
York: McGraw, 281.
Shemshadi, A., Shirazi, H., Toreihi, M., & Tarokh, M. J. (2011). A fuzzy VIKOR method for supplier
selection based on entropy measure for objective weighting. Expert Systems with
Applications, 38(10), 12160-12167.
Singh, H., Garg, R & Sachdeva, A. (2018). Supply chain collaboration: A state-of-the-art literature
review.Uncertain Supply Chain Management, 6(2), 149-180.
Srdjevic, B., Medeiros, Y. D. P., & Faria, A. S. (2004). An objective multi-criteria evaluation of water
management scenarios. Water resources management, 18(1), 35-54.
Mohanavelu, T., Krishnaswamy, R., & Marimuthu, P. (2017). Simulation modelling and development
of analytic hierarchy process-based priority dispatching rule for a dynamic press shop. International
Journal of Industrial and Systems Engineering, 27(3), 340-364.
Vaidya, O. S., & Kumar, S. (2006). Analytic hierarchy process: An overview of applications. European
Journal of operational research, 169(1), 1-29.
Wan, Z., & Beil, D. R. (2009). RFQ auctions with supplier qualification screening. Operations
Research, 57(4), 934-949.
Weber, C. A., Current, J. R., & Benton, W. C. (1991). Vendor selection criteria and methods. European
journal of operational research, 50(1), 2-18.
Yang, T., & Chou, P. (2005). Solving a multiresponse simulation-optimization problem with discrete
variables using a multiple-attribute decision-making method. Mathematics and Computers in
simulation, 68(1), 9-21.
Yazdani, M. (2014). An integrated MCDM approach to green supplier selection. International Journal
of Industrial Engineering Computations, 5(3), 443-458.
Yoon, K., & Hwang, C. L. (1985). Manufacturing plant location analysis by multiple attribute decision
making: Part I—single-plant strategy. International Journal of Production Research, 23(2), 345359.
80
Zare, M., Pahl, C., Rahnama, H., Nilashi, M., Mardani, A., Ibrahim, O., & Ahmadi, H. (2016). Multicriteria decision making approach in E-learning: A systematic review and classification. Applied
Soft Computing, 45, 108-128.
Zavadskas, E. K., Antucheviciene, J., Turskis, Z., & Adeli, H. (2016). Hybrid multiple-criteria
decision-making methods: A review of applications in engineering. Scientia Iranica. Transaction A,
Civil Engineering, 23(1), 1.
Zelany, M. (1974). A concept of compromise solutions and the method of the displaced
ideal. Computers & Operations Research, 1(3-4), 479-496.
© 2019 by the authors; licensee Growing Science, Canada. This is an open access article
distributed under the terms and conditions of the Creative Commons Attribution (CC-BY)
license ( />