A hybrid approach based on the BWM-VIKOR and GRA for ranking facility location in construction site layout for Mehr project in Tehran
Bạn đang xem bản rút gọn của tài liệu. Xem và tải ngay bản đầy đủ của tài liệu tại đây (623.88 KB, 16 trang )
Decision Science Letters 8 (2019) 233–248
Contents lists available at GrowingScience
Decision Science Letters
homepage: www.GrowingScience.com/dsl
A hybrid approach based on the BWM-VIKOR and GRA for ranking facility location in
construction site layout for Mehr project in Tehran
Abdolrasoul Parhizgarsharifa, Alireza Lorkb* and Abdolrasoul Telvaric
aDepartment
of civil Engineering, Roudehen Branch, Islamic Azad University, Roudehen, Iran
of civil Engineering, Safadasht Branch, Islamic azad University, Tehran, Iran
cDepartment of civil Engineering, Ahvaz Branch, Islamic Azad University, Ahvaz, Iran
CHRONICLE
ABSTRACT
Article history:
This study presents a new hybrid framework based on the multi-criteria decision making in order
Received February 2, 2019
to rank the potential site layout locations by consideration of the cost and safety criteria in the
Received in revised format:
Mehr Construction Project in Tehran, Iran. To this end, all of the criteria in selecting suitable
March 8, 2019
potential locations are extracted from the research literature and the most effective ones, which
Accepted March 10, 2019
are matched with existing conditions in Tehran are considered based on the opinion of experts,.
Available online
Then, the proper locations for site layout are determined as the potential alternatives and ranked
March 10, 2019
by experts based on the structure. According to the data collected from the questionnaires, the
Keywords:
weights of the selected criteria are calculated using Best Worst Method (BWM) and the final
Site Facilities
Safety Criteria
ranking of the locations is performed using two Gray Relational Analysis and VIKOR methods.
Best-Worst Method (BWM)
The computational results indicate that both VIKOR and GRA methods yield the same ranking.
VIKOR Method
However, a method with higher reliability should be used to select the best potential location of
Gray Relational Analysis (GRA)
construction site layout. Therefore, the sensitivity analysis of final outputs on the parameters
Mehr Construction Project of
existing in VIKOR and GRA methods is used in order to rank the alternatives and select the best
Tehran
approach. According to the computational results, the GRA method provides higher robustness
compared with the VIKOR method. Accordingly, the ranking obtained from the GRA method is
employed as the final solution in implementing the case study.
bDepartment
© 2018 by the authors; licensee Growing Science, Canada.
1. Introduction
Heavy costs are spent on safety and suitable layout of facilities in some applications such as civil
projects and non-civil projects performed by government and private or public sectors respectively;
hence, the most important goal of such problems is to minimize system costs and maximizing safety
level (Kumar & Cheng, 2015; Said & El-Rayes, 2013). Many studies examined this problem only by
consideration of minimizing costs while managers tend to optimize more objectives like safety level
maximization in the real world. On the other hand, changing a facility layout after implementation of a
project is difficult or infeasible; accordingly, it is essential to consider all of the criteria affecting the
final decision-making (Yahya & Saka, 2014). Another important point for the implementation of all
industrial and construction projects is the safety level and factors affecting it. This is a vital issue
because endangered safety of workers, managers and equipment may lead to costly postponements and
* Corresponding author. Tel. : +98-901-816-7027
E-mail address: (A. Lork)
© 2019 by the authors; licensee Growing Science, Canada.
doi: 10.5267/j.dsl.2019.3.001
234
heavy private or public fines when workers’ safety is at risk (Kaveh et al., 2018). Therefore, a suitable
model should be proposed for proper facilities layout in construction projects efficiently by considering
all of the effective factors.
In this research, a hybrid method based on the BWM, VIKOR and GRA is presented to prioritize the
potential locations for construction site layout. This subject has been less considered by the researchers.
Jozi et al. (2015) employed the hybrid analytical hierarchy (AHP) process (Saaty, 2003) with data
envelopment analysis (DEA) (Banker et al., 1984) in order to rank layout design patterns. They applied
AHP method to determine functional values of qualitative criteria in order to use them in the DEA
model. Durmusoglu (2018) used a similar approach to prioritize layout design patterns with the
different method in which, two fuzzy variables of information flow and environmental condition were
used to determine the relationships between activities and closeness ratings based on the fuzzy decision
system. Ardeshir et al. (2014) used the searching GA approach and the ELECTRE multi-criteria
decision-making method (Jain & Ajmera, 2019) in order to rank the patterns. In this research, Paretooptimal solution was determined using boundary multi-objective genetic algorithms then the optimal
solution was selected using the ELECTRE method. Nguyen et al. (2016) employed the TOPSIS
approach (Biswas & Saha, 2019) in order to prioritize site layout designs then compared the obtained
results to the results of TOPSIS. The proposed approach dramatically depends on the subjective
judgments of the designers.
Marzouk and Al Daour (2018) presented a decision-making system, which consists of input, design,
evaluation, selection and output steps in order to solve the construction site layout planning multiobjective dynamic problem. Various objectives, scheduling plan and sites conditions were determined
at the input step. At the design step, two mathematical optimization models of Max–Min ant system
(MMAS) and the corrected algorithm based on the Pareto Ant Colony Optimization were presented to
solve single-objective and multi-objective optimization problems, respectively. Ultimately, The Fuzzy
TOPSIS (Aikhuele, 2019) method was used at evaluation and selection steps in order to evaluate and
select the best layout design among other generated designs at the design step. Mytilinou et al. (2018)
carried out a study in which, construction site criteria were ranked using quality management, cost, and
safety approach in construction projects using TOPSIS method. This study was conducted to be
beneficial for project managers’ success. Analyzing sub-criteria based on the above-mentioned method,
projection type, safety, project programming, work time and building dimensions were selected as prior
cases, respectively. Abune'Meh (2017) carried out a study where the criteria affecting the evaluation
of layout designs were identified at first step and a hybrid fuzzy multi-criteria decision-making method
was presented to select the optimum layout design. In this method, Fuzzy Group AHP, Shannon entropy
(Vatansever & Akgűl, 2018), and TOPSIS were utilized to determine the functional values of layout
designs by consideration of qualitative criteria, to calculate criteria’s weights and to rank final layout
designs, respectively. Moreover, qualitative and quantitative criteria were taken into account
simultaneously so that the function of layout designs was considered for qualitative criteria within a
fuzzy method. In addition, the optimal design was selected proportionally without considering the
relative importance between criteria based on the opinions of experts.
Esfahani and Nik (2016) carried out a study in order to address the layout of some facilities like Tower
Crane in construction site and effective factors of these facilities in construction site safety and
proposed an appropriate solution to increase safety within design step. Ning et al. (2016) conducted a
study where AHP approach was used to determine functional values of qualitative criteria. They
employed a commercial software to create layout patterns and functional quantitative values and finally
used a non-linear weighted optimization model for order of layout design patterns in presence of two
groups of criteria considering the order of criteria based on the designers’ ideas. This study
implemented the obtained model in a real case study in order to show the model applicability then
presented the results. Table 1 reports a classification of multi-criteria decision-making methods that
have been used in previous studies.
235
A. Parhizgarsharif et al. / Decision Science Letters 8 (2019)
Table 1
Different types of decision-making methods for energy sites selection
Ref.
Önüt et al., 2010)
Ataei & Branch, 2013
Zavadskas et al., 2013
Stanujkić et al., 2013
Jato-Espino et al., 2014
Ardeshir et al., 2014
Ardeshir et al., 2014
Jozi et al., 2015
Nguyen et al., 2016
Abune'Meh, 2017
Arashpour et al., 2018
Durmusoglu, 2018
Al Hawarneh et al., 2019
The proposed Study
AHP
√
√
√
ANP
ELECTRE
MCDM Methods
DEMATEL
TOPSIS
OWA
GRA
VIKOR
BWM
√
√
√
√
√
√
√
√
√
√
√
√
√
√
√
√
√
√
According to Table 1, most of the studies have utilized AHP method. In fact, AHP is one of the widely
used decision-making methods in this area (Kumar et al, 2017). Some of decision-making methods like
TOPSIS and VIKOR have been also employed with AHP in a hybrid method. However, the interesting
point is that the new decision-making methods such as BWM and GRA have not been considered by
the researchers in this field while BWM is a more powerful approach used to determine weight of
criteria compared to the other decision-making methods (Rezaei, 2016). This method can find the
weight of criteria precisely by using a linear optimization model. Except the questionnaires that have
been filled out with the experts and there is not any user interference in determining weight of these
criteria (Rezaei, 2015). Hence, the obtained weights have an acceptable reliability. Furthermore, GRA
method is highly robust in final ranking of alternatives based on the criteria (Zhang et al., 2011).
Therefore, the present study uses a hybrid approach based on BWM, GRA and VIKOR methods in
order to expand the application of these methods in finding suitable locations for construction site
layout. This paper has been organized as follows: section 2 explains the research problem and
introduces the taken alternatives and criteria. Section 3 describes the applied multi-criteria decisionmaking methods. Section 4 presents the computational results. Finally, section 5 presents a summary
of research results.
2. Definitions and Concepts of BWM, VIKOR and GRA Technics
This section introduces the definitions related to BWM and VIKOR and GRA technics as well as the
Monte Carlo Simulation Method. The hybrid model of MCDM is suggested based on the basic concept.
2.1. The Best Wordt-Method
BWM is a robust method proposed to solve MCDM problems and is used to calculate the weights of
alternatives and criteria (Rezaei, 2015, 2016). This method removes weaknesses such as
incompatibility of pairwise comparison-based methods (e.g AHP and ANP). In recent years, BWM has
been employed by many researchers to determine weights and rank alternatives in different fields. In
general, structure of BWM method steps is as follows:
Step 1: creation of decision criterion system: decision criterion system comprises a set of identified
criteria by reviewing literature and experts’ opinions as a set of {c1,c2,…,cn} . Values of decision criteria
reflect function of different alternatives.
Step 2: determining the best and the worst criteria among the main criteria and sub-criteria; according
to decision criterion system, the best and worst criteria should be identified by decision makers. The
best criterion is indicated by CB and the worst criterion is shown by WB.
236
Step 3: Reference comparisons for the best criterion: This step determines the priority of the best
criterion compared with other criteria using values between 1 and 9 based on the verbal comparison
scale, which is presented in Table 5. Results are indicated in a vector:
,
where,
,…,
(1)
,
is the priority related to the best-selected criterion of B compared to each criterion of j. So,
1.
Step 4: Reference comparisons for the worst criterion: priority of all of the criteria related to worst
selected criterion is calculated using values 1-9 in the same way. Results of this vector shown as
follows:
,
,…,
(2)
,
where,
indicates the priority of each criterion j relative to the worst selected criterion of W.
obviously,
1
Step 5: Determine the optimal weights ∗ , ∗ , … , ∗ : to achieve the optimal weights of the criteria
at this step, the highest absolute difference
,
should be minimized for all
of js values. This is formulated as following optimization problem:
,
subject to
(3)
1
0,
Problem (3) can be modified to the following model:
subject to
,
,
(4)
1
0,
Model (4) is linear with exclusive solution. Hence, optimal weights
of ∗ are obtained with solving this model. Values near to zero (
compatibility level (Rezaei, 2016).
∗
∗
, … , ∗ and optimal value
∗
) in this model indicate high
,
2.2. Grey Relational Analysis Technique
Grey Relational Analysis (GRA) was developed by Deng (1982). Grey system theory is an algorithm
that analyzes the indefinite relations between members of a system. This algorithm can be used in multicriteria decision-making problems. This approach is able to identify both qualitative and quantitative
relationships between sophisticated factors within a system. The approach can examine the relationship
between two alternatives by measuring the distance between them. It is assumed that the multi-criteria
decision-making problem consists of m alternatives A1, A2,….,Am and n criteria C1, C2,…,Cn so that
each alternative is evaluated based on the n criteria and all of the measured values are assigned to the
alternatives and shown based on the decision matrix
. GRA steps are as follows:
237
A. Parhizgarsharif et al. / Decision Science Letters 8 (2019)
Step 1: Calculate the normal decision matrix and normalized value
,
,
,
1,2, … ,
,
1,2, … ,
,
1,2, … ,
,
1,2, … ,
1,2, … ,
1,2, … ,
using Eq. (5) and Eq. (6).
1,2, … ,
;
1,2, … , ;
∈
(5)
1,2, … ,
;
1,2, … , ;
∈
(6)
where, i represents the sequence of benefit criteria and J is the sequence of costs.
Step 2: Determine the reference sequence
,
,…,
(7)
1,2, … , .
and
where,
using the Eq. (7).
Step 3: calculate the gray relational degree using the Eq. (8).
∆
∆
,
∆
∆
where, ∆
|
|,
equals 0.5 in this research.
1,2, … ,
,
Step 4: The gray relational rate between
relational degrees.
,
,
,
1,2, … , , and
and
is the fix coefficient
0,1 , which
is calculated using Eq. (9) by calculating all of gray
1
indicates the weight of criteria and
where,
(8)
(9)
1,2, … ,
,
1,2, … , .
Step 5: ranking the alternatives based on the gray relational value in a way that the greater value of
, shows the optimality of alternative .
2.3 VIKOR Technique
VIKOR technique is a customized ordering method, which is mostly used in presence of different
conflicting criteria (Opricovic, 1998). This is a compromise solution based on the closeness to the ideal
solution and an agreement established by mutual concessions. This method has been widely used by
researchers to rank the alternatives. VIKOR Method has the following steps (Gupta, 2018):
Step 1: Calculate the pairwise matrix for each alternative so that each criterion is evaluated using the
verbal scale, which is presented in Table 4.
Step 2: Calculate the average decision matrix using Eq. (10).
1
where,
1,2, … ,
;
(10)
1,2, … ,
is the value of alternative i relative to the criterion j given by the expert t.
Step 3: Calculate the best
∗
and the worst
of all criteria using Eq. (11) and Eq. (12).
238
∗
,
,
1,2, … , ;
1,2, … , ;
1,2, … ,
1,2, … ,
(11)
(12)
where, ∗ represents the positive ideal solution and
criterion j.
Step 4: Compute the values
and
1,2, … ,
represents the negative ideal solution for
by the Eq. (13) and Eq. (14).
∗
,
∗
(13)
∗
(14)
,
∗
where, represent the distance between the positive ideal solution and alternative i; represents the
distance between the negative ideal solution and alternative i,
indicates the weights of factors
obtained from fuzzy BWM analysis.
value by the Eq. (15).
Step 5: compute the
∗
∗
1
∗
where,
,
∗
(15)
∗
and
,
∗
and parameter
is introduced as
a weight for the strategy of “the majority of criteria”, which equals 0.5 in this research.
Step 6: Rank the alternatives using
values.
Step 7: The alternatives are ranked based on the minimum
satisfied:
if the following two conditions are
C1. “Acceptable Advantage”: the alternative A1 is chosen if
1/
the alternative with the second position and represents the total alternatives.
C2. “Acceptable stability in decision making”: The alternative
and or values.
Step 8: The alternative with the minimum value in
1 where,
is
must also be the best ranked by
should be ranked at the first position.
3. Computational Results
This section examines the results obtained from the case study, which in the Mehra Housing
construction project in Tehran, Iran using the proposal method. Some information were randomly
generated based on the problem structure due to inaccessibility to all data of the project. In this project,
40 potential locations have been selected to establish 20 facilities by the experts.
1- Metal and concrete material storage 1
4- Engineering offices and laboratory
7- Material indoor storage 1
10- Joist, block and slab workshop 3
13- Material indoor storage 4
16- Parking for passenger vehicles
2- Self-service and Residence
5- Metal and concrete material storage 3
8- Joist, block and slab workshop 2
11-Material indoor storage 3
14- Forging and carpentry workshop 2
17- Electrical and mechanical
equipment indoor storage 1
19- Electrical and mechanical equipment indoor storage 2
3- Metal and concrete material storage 2
6- Joist, block and slab workshop 1
9- Material indoor storage 2
12- Forging and carpentry workshop 1
15- Material indoor storage 5
18- Parking for heavy and construction
vehicles
20- Repair shop
239
A. Parhizgarsharif et al. / Decision Science Letters 8 (2019)
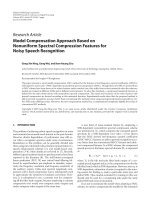
Fig. 1 demonstrates the initial site of the studied construction workshop.
Fig. 1. The initial site of the studied workshop
Methodology steps to achieve the results have been presented in following sections.
3.1 Determining the weights of the criteria affecting the increasing safety level and ranking the
potential locations for site layout
Data analysis is a multistep process in which, the data that have been collected by using the data
collecting tools in the statistical sample (society) are summarized, coded, classified and processed in
order to provide the field for analyses and relationships between the data to achieve the research goals.
In this process, the data are refined conceptually and empirically.
3.2 Validation of safety criteria
Lawshe's Validation was used in this section by distributing and collecting the questionnaire (1) in
order to determine safety criteria affecting the site layout. In this case, 30 experts were interviewed to
determine validity of the identified criteria, which the results are reported in Table 1.
Table 1
Results of validating the safety criteria affecting site layout
Criterion
Visual beauty
Safety flexibility of equipment
Light shortage
Respiratory risks
Association with the other parts
Possible further development
Safe feeding equipment
Access to standard equipment
Protective equipment for labor
Materials safety information and
guidelines
N
30
30
30
30
30
30
30
30
30
30
ne
19
28
26
27
19
18
15
27
25
28
CVR
0.27
0.87
0.73
0.80
0.27
0.20
0.00
0.80
0.67
0.87
Criterion
The relationship between labor and equipment
Automation level of equipment
type of products
Product features
Suitable final plan
Temperature changes
Noise disturbance
Safe access to the raw materials
Wastewater and waste disposal
Fire and explosion
N
30
30
30
30
30
30
30
30
30
30
ne
27
18
19
19
28
14
18
26
18
19
CVR
0.80
0.20
0.27
0.27
0.87
-0.07
0.20
0.73
0.20
0.27
As there are 30 evaluators, the minimum CVR equals to 0.33 according to the table 1. Therefore, the
finalized safety criteria affecting the site layout are indicated in Table 2:
Table 2
Final criteria for site layout
Final criteria for layout evaluation
Safety flexibility of equipment
Light shortage
Respiratory risks
Access to standard equipment
Protective equipment for labor
ID
C1
C2
C3
C4
C5
Final criteria for layout evaluation
Materials safety information and guidelines
The relationship between labor and equipment
Suitable final plan
Safe access to the raw materials
ID
C6
C7
C8
C9
240
3.3 Weights of safety criteria
This section presents the results of the most important (best) and unimportant (worst) criteria using the
BWM questionnaire. To valuate criteria, the opinions of an expert committee in the area of HS were
used. The best and worst criteria identified by each respondent were the most important and
unimportant criteria affecting site layout, respectively based on the experts’ opinions. The best and
worst criteria, which are identified by experts, can be seen in Table 3.
Table 3
The best and worst identified criterion by the experts
The most unimportant criterion
1, 4, 5
2, 7
3, 8
6
The most important criterion
1,5
3, 7, 8
4, 2
6
-
Relevant criterion
C1
C2
C3
C4
C5
C6
C7
C8
C9
This part of study determines the preferences of the the best criterion among all of the criteria. This
information is obtained from distributing and collecting the BWM questionnaire so that the respondents
are asked to identify the preference of the best criterion relative to other criteria. Therefore, the bestother criteria vectors are indicated in Table 4.
Table 4
The best-other criteria vectors
Experts
The best criterion
Expert 1
Expert 2
Expert 3
Expert 4
Expert 5
Expert 6
Expert 7
Expert 8
C
C
C
C
C
C
C
C
1
4
2
2
1
2
3
3
3
2
1
3
2
3
1
1
9
3
4
8
9
2
2
3
2
1
2
1
3
4
2
2
4
2
2
4
2
2
3
2
2
2
3
2
2
1
2
5
3
8
2
2
3
3
9
2
2
3
9
3
4
3
2
8
4
4
4
5
2
9
5
2
Preferences of other criteria relative to the worst criterion are determined in a same way. This
information is obtained from distributing and collecting the BWM questionnaire so that the respondents
are asked to identify the preference of the worst criterion relative to other criteria. Therefore, the worstother criteria vectors are indicated in Table 5.
Table 5
The worst-other criteria vectors
Experts
The worst criterion
Criterion
C
C
C
C
C
C
C
Expert 1
9
2
1
2
3
4
3
2
2
Expert 2
2
3
2
8
3
2
1
4
2
Expert 3
2
9
3
5
2
2
2
1
3
Expert 4
2
4
1
8
2
5
3
2
2
Expert 5
9
2
1
5
4
3
2
3
3
Expert 6
2
2
3
4
5
9
3
2
1
Expert 7
2
9
2
3
5
2
1
4
2
Expert 8
2
8
2
3
5
3
3
1
2
241
A. Parhizgarsharif et al. / Decision Science Letters 8 (2019)
Ultimately, the best-worst method is employed to determine the results of consistency coefficient of
pairwise comparisons as well as the weights of the criteria affecting site layout. The weights of safety
criteria are calculated by solving the linear WBM technique among eight experts and using GAMS24.3
Software and BARON solver. These weights are the average weights for each criterion, which are
demonstrated in a unit weigh vector in Table 6.
Table 6
Weights of safety criteria for site layout
Criterion
Safety flexibility of equipment
Light shortage
Respiratory risks
Access to standard equipment
Protective equipment for labor
Materials safety information and
guidelines
The relationship between labor
and equipment
Suitable final plan
Safe access to the raw materials
∗
ξ
Respondent (Experts)
R(4)
R(5)
R(6)
0.106 0.253 0.100
0.097 0.104 0.095
0.034 0.028 0.129
0.251 0.099 0.071
0.072 0.149 0.143
R(1)
0.256
0.099
0.033
0.107
0.074
R(2)
0.072
0.139
0.096
0.249
0.139
R(3)
0.103
0.256
0.077
0.103
0.103
0.149
0.105
0.103
0.145
0.133
0.099
0.033
0.154
0.140
0.107
0.076
0.041
0.095
0.072
0.038
0.026
0.077
0.051
0.097
0.058
0.039
Final
weights
0.135
0.159
0.074
0.142
0.114
R(7)
0.097
0.246
0.101
0.129
0.095
R(8)
0.091
0.236
0.091
0.130
0.0137
0.243
0.101
0.055
0.129
0.099
0.095
0.028
0.130
0.097
0.075
0.060
0.046
0.095
0.029
0.043
0.145
0.058
0.044
0.031
0.099
0.038
0.084
0.066
0.043
∗
Here ξ represents consistency of comparisons. According to the Table 6, comparisons are highly
compatible due to their proximity to zero. It is concluded from the pairwise comparisons between the
criteria that the obtained weights for criteria of light shortage, access to standard equipment and safety
flexibility of equipment had the highest values respectively relative to the other criteria. Table 6 shows
that the final value of CR is lower than 0.1 indicating the proper criteria selection to achieve the result.
In fact, it can be stated based on the opinions of experts that the introduced criteria had an appropriate
consistency and could affect the final responses.
3.4 Evaluation of potential locations
At this step, 40 potential locations are evaluated for site layout. To facilitate this process, the locations
are assessed by the verbal variables including very good, good, moderate, poor, very poor, which are
scored from one to five. Very good variable for each criterion indicates the best evaluation value per
all of the criteria. Locations evaluation values are reported in following tables.
3.5 Ranking the potential locations
At this section, verbal variables are converted to quantitative ones then functional weights of the
locations are measured using VIKOR and GRA techniques. The functional weights of locations have
been shown in following tables by consideration on safety criteria.
3.5.1. VIKOR ranking results
At this section, the 40 initial locations are ranked for site layout by distributing and collecting the
questionnaire 3 as well as stepwise implementation of VIKOR method. This process is accomplished
through following steps:
Step 1: creating the decision matrix: decision matrix is created as indicated in table 7 based on the
number of criteria, alternatives and evaluation of all alternatives for different criteria.
242
Table 7
Values for evaluation of initial locations for site layout
Relevant criteria
Alternative-criterion matrix
Location (1)
Location (2)
Location (3)
Location (4)
Location (5)
3.87
2.04
4.33
2.25
3.60
⋮
3.64
3.53
3.79
2.49
4.05
2.36
⋮
Location (35)
Location (36)
Location (37)
Location (38)
Location (39)
Location (40)
4.45
3.50
2.85
3.12
2.77
⋮
1.44
1.29
1.73
3.49
3.75
2.26
1.04
3.39
2.67
3.83
3.43
⋮
3.24
2.14
3.44
2.03
3.89
1.89
3.24
4.43
1.96
1.68
1.12
⋮
2.89
3.46
1.61
2.91
1.24
3.08
1.15
1.17
3.04
2.51
4.02
⋮
1.83
2.35
1.53
1.99
4.08
4.26
2.58
4.10
3.96
2.78
4.07
⋮
2.10
3.14
2.97
4.18
3.69
2.18
2.29
4.37
3.73
1.61
1.89
⋮
2.31
1.48
3.47
2.79
1.30
1.21
1.94
1.47
4.48
1.66
1.85
⋮
1.32
3.84
1.46
1.38
2.77
2.70
3.52
1.00
2.86
1.13
1.97
⋮
2.98
4.31
4.05
3.89
4.43
4.14
Step 2: Normalization of the decision matrix: the alternative-criterion decision-making matrix should
be normalized. For example, fij is calculated as follows:
f
x
3.87
∑
√3.87
x
2.04
…
4.05
0.186
2.36
(16)
and other f values are calculated then the obtained values up to three decimal places are shown as a
matrix in Table 8.
Table 8
Normalized matrix of evaluation values of initial locations for site layout
Relevant criteria
Alternative-criterion matrix
Location (1)
Location (2)
Location (3)
Location (4)
Location (5)
0.186
0.098
0.208
0.108
0.173
⋮
0.175
0.169
0.182
0.119
0.194
0.113
⋮
Location (35)
Location (36)
Location (37)
Location (38)
Location (39)
Location (40)
0.213
0.168
0.137
0.150
0.133
⋮
0.069
0.062
0.083
0.167
0.180
0.108
0.050
0.163
0.128
0.184
0.165
⋮
0.155
0.103
0.165
0.097
0.187
0.091
0.155
0.212
0.094
0.081
0.054
⋮
0.139
0.166
0.077
0.140
0.059
0.148
0.055
0.056
0.146
0.120
0.193
⋮
0.088
0.113
0.073
0.095
0.196
0.204
0.124
0.197
0.190
0.133
0.195
⋮
0.101
0.151
0.142
0.200
0.177
0.105
0.110
0.210
0.179
0.077
0.091
⋮
0.111
0.071
0.166
0.134
0.062
0.058
0.093
0.071
0.215
0.080
0.089
⋮
0.063
0.184
0.070
0.066
0.133
0.129
0.169
0.048
0.137
0.054
0.094
⋮
0.143
0.207
0.194
0.187
0.212
0.199
Step 3: determining the best and worst value. The best and worst values of each criterion are determined
as indicated in Table 9.
Table 9
The best and worst criteria
Relevant criteria
Relevant features
f∗
f∗
f
f
0.213
0.048
0.048
0.215
0.050
0.213
0.215
0.052
0.211
0.054
0.216
0.052
0.214
0.054
0.215
0.056
0.212
0.048
0.165
-0.167
-0.163
0.163
0.157
0.164
0.160
0.159
0.165
Table 10
Maximum and minimum distance between alternatives and the ideal solution
S
S∗
S
S∗
0.730
0.266
0.463
R
R∗
R
R∗
0.159
0.080
0.079
243
A. Parhizgarsharif et al. / Decision Science Letters 8 (2019)
Step 4: calculating the advantage, regret and VIKOR indicators besides determining the potential
locations: The considered initial locations are sorted at this step by considering the VIKOR index,
where the alternatives with lower Qi have lower preferences. As it is shown, the selected locations 7,
36 and 30 have ranked at the 1 to 3 positions, respectively.
Table 11
Results of the advantage (Si), regret (Ri) and VIKOR (Qi) indicators and the proposal alternatives ranking
Alternative
Location (1)
Location (2)
Location (3)
Location (4)
Location (5)
0.562
0.534
0.348
0.709
0.524
⋮
0.516
0.343
0.501
0.511
0.515
0.454
⋮
Location (35)
Location (36)
Location (37)
Location (38)
Location (39)
Location (40)
0.157
0.114
0.105
0.117
0.140
⋮
0.091
0.087
0.120
0.113
0.135
0.094
Rank
37
21
6
33
32
⋮
10
2
23
19
31
7
0.807
0.502
0.247
0.710
0.659
⋮
0.337
0.123
0.505
0.474
0.618
0.292
3.5.2 Results of GRA ranking
At this section, the 40 initial locations are ranked for site layout by distributing and collecting the
questionnaire 3 as well as stepwise implementation of VIKOR method. This process is done through
following steps:
Step 1: forming decision-making matrix: at this step, the opinions collected from the questionnaire and
then the criterion-alternative matrix is formed based on the averaged opinions indicated in Table 12.
Table 12
The values of evaluating initial locations for site layout
Rel ev ant crit eria
Alternative-criterion matrix
Location (1)
Location (2)
Location (3)
Location (4)
Location (5)
⋮
Location (35)
Location (36)
Location (37)
Location (38)
Location (39)
Location (40)
3.87
2.04
4.33
2.25
3.60
⋮
3.64
3.53
3.79
2.49
4.05
2.36
4.45
3.50
2.85
3.12
2.77
⋮
1.44
1.29
1.73
3.49
3.75
2.26
1.04
3.39
2.67
3.83
3.43
⋮
3.24
2.14
3.44
2.03
3.89
1.89
3.24
4.43
1.96
1.68
1.12
⋮
2.89
3.46
1.61
2.91
1.24
3.08
1.15
1.17
3.04
2.51
4.02
⋮
1.83
2.35
1.53
1.99
4.08
4.26
2.58
4.10
3.96
2.78
4.07
⋮
2.10
3.14
2.97
4.18
3.69
2.18
2.29
4.37
3.73
1.61
1.89
⋮
2.31
1.48
3.47
2.79
1.30
1.21
1.94
1.47
4.48
1.66
1.85
⋮
1.32
3.84
1.46
1.38
2.77
2.70
3.52
1.00
2.86
1.13
1.97
⋮
2.98
4.31
4.05
3.89
4.43
4.14
Step 2: forming the normal decision-making matrix: at this step, the matrix is normalized; accordingly,
the normal alternative-criterion matrix is indicated in Table 13.
Table 13
Normalized matrix of values evaluating the site layout initial locations
Rel eva nt criteria
Alternative-criterion matrix
Location (1)
Location (2)
Location (3)
Location (4)
Location (5)
⋮
Location (35)
Location (36)
Location (37)
Location (38)
Location (39)
Location (40)
0.834
0.300
0.968
0.362
0.755
⋮
0.767
0.735
0.810
0.431
0.886
0.394
0.011
0.284
0.470
0.393
0.493
⋮
0.874
0.917
0.791
0.287
0.212
0.639
1.000
0.309
0.521
0.179
0.297
⋮
0.353
0.676
0.294
0.709
0.162
0.750
0.635
0.985
0.259
0.176
0.012
⋮
0.532
0.700
0.156
0.538
0.047
0.588
0.009
0.015
0.585
0.424
0.884
⋮
0.216
0.375
0.125
0.265
0.902
0.957
0.437
0.883
0.842
0.496
0.874
⋮
0.296
0.601
0.551
0.906
0.762
0.320
0.350
0.973
0.781
0.147
0.231
⋮
0.356
0.108
0.704
0.500
0.054
0.027
0.235
0.093
1.000
0.151
0.208
⋮
0.048
0.807
0.090
0.066
0.485
0.464
0.735
0.000
0.542
0.038
0.283
⋮
0.577
0.965
0.889
0.843
1.000
0.915
244
Step 3: calculating the gray relational degree matrix: at this step, gray relational degree is calculated
for each alternative and the results are indicated in Table 14.
Table 14
Gray relational degree matrix
Rel eva nt criteria
Alternative-criterion matrix
Location (1)
Location (2)
Location (3)
Location (4)
Location (5)
0.751
0.417
0.940
0.439
0.671
⋮
0.682
0.653
0.725
0.468
0.815
0.452
⋮
Location (35)
Location (36)
Location (37)
Location (38)
Location (39)
Location (40)
0.336
0.411
0.485
0.451
0.496
⋮
0.799
0.857
0.705
0.412
0.388
0.581
1.000
0.420
0.511
0.379
0.416
⋮
0.436
0.607
0.415
0.632
0.374
0.667
0.578
0.971
0.403
0.378
0.336
⋮
0.517
0.625
0.372
0.520
0.344
0.548
0.335
0.337
0.547
0.465
0.812
⋮
0.390
0.444
0.364
0.405
0.837
0.921
0.470
0.810
0.759
0.498
0.799
⋮
0.415
0.556
0.527
0.842
0.678
0.424
0.435
0.949
0.696
0.369
0.394
⋮
0.437
0.359
0.628
0.500
0.346
0.339
0.395
0.355
1.000
0.371
0.387
⋮
0.344
0.722
0.355
0.349
0.493
0.483
0.653
0.333
0.522
0.342
0.411
⋮
0.542
0.935
0.819
0.761
1.000
0.855
Step 4: calculating the gray relational rank: the gray relational rank of each alternative is calculated at
this step. The results are reported in Table 15.
Table 15
Gray relational rank matrix
Location
Rank
Location
Rank
Location
Rank
Location
Rank
10
0.664
4
20
0.573
14
30
0.623
10
40
0.570
16
9
0.738
1
19
0.489
34
29
0.698
2
39
0.572
15
8
0.555
20
18
0.537
25
28
0.453
38
38
0.532
27
7
0.686
3
17
0.648
6
27
0.562
19
37
0.548
23
6
0.570
17
16
0.527
30
26
0.563
18
36
0.638
8
5
0.541
24
15
0.491
33
25
0.494
32
35
0.530
28
4
0.419
40
14
0.534
26
24
0.475
36
34
0.463
37
3
0.645
7
13
0.602
11
23
0.662
5
33
0.554
21
2
0.577
13
12
0.484
35
22
0.631
9
32
0.550
22
1
0.528
29
11
0.588
12
21
0.499
31
31
0.426
39
According to the gray relational analysis, an alternative with the highest gray relational degree is the
preferred alternative; therefore, priority of bank branches is determined based on the gray relational
degree. The results obtained from the gray relational degree computations imply that the selected
locations 9, 29 and 7 are ranked at positions 1 to 3.
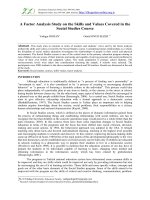
3.6. Sensitivity Analysis of GRA and VIKOR Techniques
To analyze sensitivity and reliability of the results obtained from the VIKOR method, the effect of
various v values on the VIKOR results were examined. The obtained findings are illustrated in the Fig.
1. As it can be seen in this figure, changing alternatives’ preferences have minor difference based on
the values of the strategy of the majority of group utility (v). Nevertheless, the selected locations 7, 9,
30 and 36 are the highest ranks.
Therefore, VIKOR technique does not have an acceptable compatibility with changes in v parameter.
To examine the effect of different determination coefficients on the results of gray relational analysis,
the gray relational degree was calculated for each location by consideration of various determination
coefficients. Different determination coefficients were taken in this analysis and the obtained results
are shown in Fig. 2. As it is seen, the preferences related to the options have not changed when
determination coefficient (ξ) varies and the results obtained from the GRA method are more stable
relative to the VIKOR method.
245
A. Parhizgarsharif et al. / Decision Science Letters 8 (2019)
0.8
0.6
0.4
0.2
VIKORIndex
1.0
0.0
1
3
5
7
9
11
13
15
17
19
21
23
25
27
29
31
33
35
37
39
Location
Series1
Series2
Series3
Series4
Series5
GrayRelationaldegree
Fig. 2. Sensitivity analysis of VIKOR method
0.9
0.8
0.7
0.6
0.5
0.4
0.3
0.2
0.1
0.0
1
3
5
7
9
11
13
15
17
19
21
23
25
27
29
31
33
35
37
39
Location
Series1
Series2
Series3
Series4
Series5
Fig. 3. Sensitivity analysis of GRA method
Ultimately, the potential locations for site layout were determined as indicated in Table 16. It should
be noted that the alternatives, which their gray relational degrees were greater than 0.555 were selected
as the potential locations based on the consensus of decision makers.
Table 16
The selected potential locations
Row
1
2
3
4
5
6
7
8
9
10
Location
Location 9
Location 29
Location 7
Location 10
Location 23
Location 17
Location 3
Location 36
Location 22
Location 22
Gray relational
degree ( )
0.738
0.698
0.686
0.664
0.662
0.648
0.645
0.683
0.631
0.631
Row
Location
11
12
13
14
15
16
17
18
19
19
Location 13
Location 11
Location 2
Location 20
Location 39
Location 40
Location 6
Location 26
Location 27
Location 27
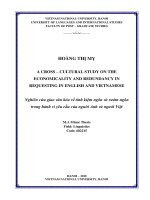
Fig. 3 represents the structure of selected potential locations.
Gray relational
degree ( )
0.602
0.588
0.577
0.5763
0.572
0.570
0.570
0.563
0.562
0.562
246
Fig. 3. The selected potential locations for facilities site layout
As it is seen in Fig. 3, almost all of the selected site layout locations are located at the central parts of
the site; this may be related to the scores of safety criteria provided by the BWM technique. In fact, the
experts believe that safety level at the central part of the site is higher that the marginal space. Moreover,
some facilities should be located close to the main street in order to achieve an appropriate
transportation system and this can be seen in the obtained results of research.
4. Conclusion and Further Suggestions
This study developed a new hybrid method based on the BWM, GRA and VIKOR techniques in order
to select the facility location in the construction layout in accordance with the research framework of
the construction management area in the Mehr Housing Project in Tehran, Iran. The research executive
structure was designed based on the three operational phases. In the first phase, the criteria were
extracted from the research literature then approved by the experts. Furthermore, the potential locations
were determined for site layout by the experts and the required data were finally collected in the frame
of questionnaire for problem solving. At the second phase, the weight of each criterion was determined
using BWM. The results obtained from evaluation of potential locations for site facilities layout in this
research introduced light shortage, access to standard equipment and flexible safety in equipment as
three important criteria. Then, the final ranking of alternatives was done using GRA and VIKOR
techniques. Accordingly, three selected alternatives by the GRA were locations 9, 27 and 7; while
VIKOR method selected locations 9, 36 and 7 as preferred alternatives. The similar ranking of
alternatives for the best potential location of construction site layout in these two methods requires
application of a method with high reliability. Therefore, sensitivity analysis was done on the parameters
existing in VIKOR and GRA methods in the third phase in order to select the best ranking method. The
computational results showed higher stability of GRA method compared to the VIKOR method.
Accordingly, the GRA ranking can be used as the final response for case study implementation. It is
recommended to employ new MCDM methods and compare them in order to evaluate their
effectiveness and to develop the research dimensions.
References
Abune'Meh, M. (2017). Construction Site Layout Optimization, Considering Risk of Natural or
Technological Hazard Utilizing GIS. Université Paris-Est.
A. Parhizgarsharif et al. / Decision Science Letters 8 (2019)
247
Aikhuele, D. (2019). A model for supporting designers and for determining design stakeholders’
preferences.International Journal of Data and Network Science, 3(2), 109-118.
Al Hawarneh, A., Bendak, S., & Ghanim, F. (2019). Dynamic facilities planning model for large scale
construction projects. Automation in Construction, 98, 72-89 .
Arashpour, M., Wakefield, R., Abbasi, B., Arashpour, M., & Hosseini, R. (2018). Optimal process
integration architectures in off-site construction: Theorizing the use of multi-skilled resources .
Architectural Engineering and Design Management, 14(1-2), 46-59 .
Ardeshir, A., Mohseni, N., Behzadian, K., & Errington, M. (2014). Selection of a bridge construction
site using fuzzy analytical hierarchy process in geographic information system. Arabian Journal for
Science and Engineering, 39(6), 4405-4420 .
Ataei, E., & Branch, A. (2013). Application of TOPSIS and fuzzy TOPSIS methods for plant layout
design. World Applied Sciences Journal, 24(7), 908-913 .
Banker, R. D., Charnes, A., & Cooper, W. W. (1984). Some models for estimating technical and scale
inefficiencies in data envelopment analysis. Management Science, 30(9), 1078-1092.
Biswas, T & Saha, P. (2019). Selection of commercially available scooters by new MCDM method.
International Journal of Data and Network Science, 3(2), 137-144.
Deng, J.-L. (1982). Control problems of grey systems. Systems & Control Letters, 1(5), 288-294 .
Durmusoglu, Z. D. (2018). A TOPSIS-based approach for sustainable layout design: activity relation
chart evaluation. Kybernetes, 47(10), 2012-2024 .
Esfahani, H. K., & Nik, M. S. A. (2016). Use of GIS-based Multi-Criteria Decision Making to Optimal
Site Selection in an Illustrative Study Area in the Center of Iran. International Journal of
Engineering Research, 5(4), 260-263 .
Gupta, H. (2018). Evaluating service quality of airline industry using hybrid best worst method and
VIKOR. Journal of Air Transport Management, 68, 35-47 .
Jain, V & Ajmera, P. (2019). Evaluation of performance factors of FMS by combined decision making
methods as AHP, CMBA and ELECTRE methodology.Management Science Letters, 9(4), 519-534.
Jato-Espino, D., Castillo-Lopez, E., Rodriguez-Hernandez, J., & Canteras-Jordana, J. C. (2014). A
review of application of multi-criteria decision making methods in construction. Automation in
Construction, 45, 151-162 .
Jozi, S. A., Shoshtary, M. T., & Zadeh, A. R. K. (2015). Environmental risk assessment of dams in
construction phase using a multi-criteria decision-making (MCDM) method. Human and Ecological
Risk Assessment: An International Journal, 21(1), 1-16 .
Kaveh, A., Rastegar Moghaddam, M., & Khanzadi, M. (2018). Efficient multi-objective optimization
algorithms for construction site layout problem. Scientia Iranica, 25(4), 2051-2062 .
Kumar, A., Sah, B., Singh, A. R., Deng ,Y., He, X., Kumar, P., & Bansal, R. (2017). A review of multi
criteria decision making (MCDM) towards sustainable renewable energy development. Renewable
and Sustainable Energy Reviews, 69, 596-609 .
Kumar, S. S., & Cheng, J. C. (2015). A BIM-based automated site layout planning framework for
congested construction sites. Automation in Construction, 59, 24-37 .
Marzouk, M., & Al Daour, I. (2018). Planning labor evacuation for construction sites using BIM and
agent-based simulation. Safety Science, 109, 17 .185-4
Mytilinou, V., Lozano-Minguez, E., & Kolios, A. (2018). A framework for the selection of optimum
offshore wind farm locations for deployment. Energies, 11(7), 1855 .
Nguyen, H.-T., Dawal, S. Z. M., Nukman, Y., Rifai, A. P., & Aoyama, H. (2016). An integrated MCDM
model for conveyor equipment evaluation and selection in an FMC based on a fuzzy AHP and fuzzy
ARAS in the presence of vagueness. PloS one, 11(4), e0153222 .
Ning, X., Ding, L., Luo, H., & Qi, S. (2016). A multi-attribute model for construction site layout using
intuitionistic fuzzy logic. Automation in Construction, 72, 380-387 .
Önüt, S., Efendigil, T., & Kara, S. S. (2010). A combined fuzzy MCDM approach for selecting
shopping center site: An example from Istanbul, Turkey. Expert systems with applications, 37(3),
1973-1980 .
248
Opricovic, S. (1998). Multicriteria optimization of civil engineering systems. Faculty of Civil
Engineering, Belgrade, 2(1), 5-21 .
Rezaei, J. (2015). Best-worst multi-criteria decision-making method. Omega, 53, 49 .57Rezaei, J. (2016). Best-worst multi-criteria decision-making method: Some properties and a linear
model. Omega, 64, 126-130 .
Saaty, T. L. (2003). Decision-making with the AHP: Why is the principal eigenvector
necessary. European Journal of Operational Research, 145(1), 85-91.
Said, H., & El-Rayes, K. (2013). Performance of global optimization models for dynamic site layout
planning of construction projects. Automation in Construction, 36, 71-78 .
Stanujkić, D., Đorđević, B., & Đorđević, M. (2013). Comparative analysis of some prominent MCDM
methods: A case of ranking Serbian banks. Serbian Journal of Management, 8(2), 213-241 .
Vatansever, K & Akgűl, Y. (2018). Performance evaluation of websites using entropy and grey
relational analysis methods: The case of airline companies.Decision Science Letters , 7(2), 119-130.
Yahya, M., & Saka ,M. (2014). Construction site layout planning using multi-objective artificial bee
colony algorithm with Levy flights. Automation in Construction, 38, 14-29 .
Zavadskas, E. K., Antucheviciene, J., Šaparauskas, J., & Turskis, Z. (2013). Multi-criteria assessment
of facades’ alternatives: peculiarities of ranking methodology. Procedia Engineering, 57, 107-112 .
Zhang, S.-f., Liu, S.-y., & Zhai, R.-h. (2011). An extended GRA method for MCDM with intervalvalued triangular fuzzy assessments and unknown weights .Computers & Industrial Engineering,
61(4), 1336-1341 .
© 2019 by the authors; licensee Growing Science, Canada. This is an open access article
distributed under the terms and conditions of the Creative Commons Attribution (CC-BY)
license ( />