Empirical investigation of trust antecedents and consequences in decentralized supply chain: The case of cosmetics market in Iran
Bạn đang xem bản rút gọn của tài liệu. Xem và tải ngay bản đầy đủ của tài liệu tại đây (1.05 MB, 22 trang )
Decision Science Letters 8 (2019) 483–504
Contents lists available at GrowingScience
Decision Science Letters
homepage: www.GrowingScience.com/dsl
Empirical investigation of trust antecedents and consequences in decentralized supply chain:
The case of cosmetics market in Iran
Iman Nematollahia,b*
a
Head of Evaluation and Development of Project Management System, National Iranian Oil Company
Department of Industrial Engineering, Sciences and Researches Branch, Islamic Azad University, Tehran, Iran
CHRONICLE
ABSTRACT
Article history:
This study develops an empirical investigation of trust antecedents and consequences in creating
Received December 16, 2018
a collaborative business relationship between distribution companies and retailers in the
Received in revised format:
cosmetics market. A conceptual framework based on trust antecedents as inputs and trust
March 26, 2019
consequences as outputs is designed for both parties. In order to evaluate the performance and
Accepted April 19, 2019
effectiveness of each considered trust factor for each party, a fuzzy data envelopment analysis
Available online
(FDEA) based approach is proposed. In order to demonstrate the applicability of the proposed
April 19, 2019
model, a real-life case study is considered. The required data are collected using interview and
Keywords:
questionnaires, and the reliability of the collected data is examined using the Cronbach’s alpha.
Trust antecedents and
consequences
The obtained results indicate that there is no significant difference between both parties’
Collaborative business
tendency towards building a collaborative business relationship based on trust. The results also
relationship
indicate that information sharing is not an effective trust antecedent for both parties. The “product
Information sharing
quality” and “product price” are the most effective trust antecedents for retailers, while the
Fuzzy data envelopment analysis
“retailer’s financial conflicts records” along with “length of partnership” are the most effective
(FDEA)
trust antecedents for distribution companies. Finally, the most effective trust consequences for
Decentralized supply chain
distribution companies and retailers are “information sharing” and “brand advertising”,
respectively.
b
© 2018 by the authors; licensee Growing Science, Canada.
1. Introduction
The current aggressive competition in the market has forced companies to extend their business
relationships and markets in order to survive (Kotabe & Kothari, 2016). Creating collaborative
relationships with business partners is the key to stay in business and make money nowadays (Prajogo,
2016). Business relationships among partners are created based on reciprocal expectations, similar to
social relationships. The most significant known deliverables that each supply chain player can offer
in a business relationship are materials, money, and information. Accordingly, there are three important
flows among supply chain players, including materials, financial, and information flows (Arani &
Torabi, 2018; Stadtler, 2015). Each supply chain player expects its partners to deliver the deliverables
as they have agreed to. In an ideal world nothing would disrupt partners from fulfilling their
deliverables, however, the business world is full of uncertainties such as players’ opportunistic
* Corresponding author.
E-mail address: (I. Nematollahi)
© 2019 by the authors; licensee Growing Science, Canada.
doi: 10.5267/j.dsl.2019.4.004
484
behaviors. To this end, confidence in receiving the deliverables as they have agreed to is of great
significance (Melnyk et al., 2009; Yazdanparast et al., 2018). This macro ergonomic factor is called
trust (Chen & Paulraj, 2004). Various researchers and practitioners have studied trust in the past
decades, and various definitions are presented. According to Moorman et al. (1992), trust is defined as
a willingness to rely on an exchange partner in whom one has confidence. Trust is the key contributor
to a strategic alliance success. Does any business relationship require trust? The answer is no. Trust is
a necessary condition for commitment and commitment only matters if tomorrow matters. Therefore,
trust highly matters to collaborative relationships in decentralized supply chains. Although a huge
amount of studies addressed supply chain flows and related uncertainties and disruptions, relatively
few papers have dealt with trust antecedents and consequences among supply chain players. It is been
indicated that as environmental uncertainty grows, the effects of trust are more highlighted in business
relationships (Wang et al., 2011). As trust increases among partners, the perception of risk associated
with opportunistic behavior decreases (Lui et al., 2009). According to the literature, the lack of trust
between partners is one of the most important issues leading to unsuccessful relationships. When trust
decreases in a relationship, both parties scrutinize and verify each trade and transaction, emphasize on
more detailed contracts and confidential agreements. Finally, lack of trust results in more transaction
costs and time which finally reduces the agility and responsiveness of each player along with the whole
chain (Chen et al., 2011). Trust affects the supply chain performance from various perspectives. Kwon
and Suh (2005) indicated that trust leads to relationship commitment in supply chains. Trust also
impacts the cooperation among players in the supply chain significantly (Yeung et al., 2009; Zhao et
al., 2008; Zhao et al., 2011). It is important to note that earning trust is costly, parties have to invest
money and time, and expose themselves to vulnerability to earn their partners’ trust. Therefore, there
is a more important step after building trust, and that is keeping the trust. As business and social experts
say, trust is hard to gain, but easy to lose. To this end, identifying the trust antecedents for supply chain
players in a decentralized network is of great importance to build and keep trust (Urban et al., 2000).
There are various trust enablers in business relationships which are also known in the literature as trust
antecedents. According to the Mayer et al. (1995), the trust antecedents can be classified into three
main categories, including the general characteristics of the trustee, the trustor’s propensity to trust
others, and situational factors. The general enabler of trust is trustor’s satisfaction with the trustee’s
performance in the relationship. Trust also have some consequences in the business behaviors of
parties. For example, when a supplier trusts a retailer, delayed payments are allowed. This kind of
behaviors which occur only when a partner trust another are called trust consequences. Information
sharing is one of the most known and significant consequences of trust in supply chains. Parties share
information which they think would help their trusted partners in the supply chain. Information sharing
among supply chain players benefit the chain from various perspectives.
Previous studies have investigated the trust from various perspectives. Ozpolat et al. (2018)
investigated the relationship between the length of a vendor-managed inventory (VMI) and trust among
manufacturers and distributors in a supply chain. The impacts of trust and managerial ties on
information sharing in supply chains are evaluated by Wang et al. (2014). Fawcett et al. (2012)
investigated the relationship between trust and collaborative innovation capability in the supply chain.
Cai et al. (2013) investigated the effects of trust and power on knowledge sharing in collaborative
supply chains. Vlachos and Bourlakis (2006) indicated that the perceived trust of each player in the
supply chain is dependent on its own perceived affecting factors which are not necessarily similar for
all players. Laeequddin et al. (2010) proposed a conceptual framework for the evaluation of trust from
risk perspectives. Chen et al. (2011) investigated the relationship between trust and information sharing,
information quality, and information availability in a supply chain context. Han and Dong (2015)
developed a two-stage coordination model by considering the trust between supplier and retailer. Beer
et al. (2018) proposed a game theory-based approach to reflect supplier trustworthiness to potential
buyers. Fawcett et al. (2017) presented an empirically grounded approach to investigate trust-building
process between supplier and buyer in the supply chain context. Wang et al. (2011) evaluated the
I. Nematollahi / Decision Science Letters 8 (2019)
485
performance of trust and contract on innovativeness in the supply chain under uncertain environment.
Capaldo and Giannoccaro (2015b) investigated the impacts of interdependence structure on networklevel trust in the context of the supply chain. Zhang and Huo (2013) evaluated the impact of joint
dependence and trust on supply chain integration and financial performance. Panayides and Lun (2009)
demonstrated that trust has positive impacts on innovativeness and supply chain performance.
Sharfman et al. (2009) evaluated the role of trust in creating a cooperative environment in supply chain
management (SCM). Handfield and Bechtel (2002) indicated that trust among supply chain players has
positive effects on supply chain responsiveness. Capaldo and Giannoccaro (2015a) investigated the
effect of trust and interdependency degree on supply chain performance. Moore (1998) investigated the
role of trust and commitment in logistics alliances by focusing on buyer perspective. Tejpal et al. (2013)
reviewed and classified the concept of trust in the context of the supply chain. Laeequddin et al. (2012)
presented a conceptual framework for building trust among supply chain players.
According to the Glaeser et al. (2000), many researchers and practitioners in different fields believe
that social capitals such as trust have a significant impact on economic or political decisions and
performance. Although trust is extremely effective in supply chain relationships, collaboration, and
cooperation, it is hard to measure. The researchers also believe that managers do not understand the
nature of trust, neither the process of building it and there is a knowledge gap (Fawcett et al., 2012).
The complexity of trust in the real-world business relationships seems to be beyond what theories say.
For example, Ebrahim‐Khanjari et al. (2012) indicated that although manufacturers’ representatives
give false information about demand forecasts to the retailers to maximize their own profits by selling
more, the retailers tend to trust them in the long run. Therefore, it seems generalized trust evaluation
models based on empirical investigations is the best way to link the concept of trust with dynamics of
trust in the real-world business relationships and fill the knowledge gap. According to Sahay (2003),
in order to understand the role of trust in business relationships, some significant questions should be
answered; (i) What leads to a trusting behavior in a business relationship?, (ii) What is the effect of
trust on the behavior of each player?. The answer to the first question is trust antecedents, while the
answer to the second question is trust consequences. These factors should cover all aspects of each
player’s major expectations and business related behaviors in a business relationship in order to build
and keep trust. To this end, the objective of this study is to investigate the trust antecedents and
consequences among distributors and retailers in the cosmetics industry in Iran. First, using a
comprehensive investigation among executive and sales managers of the cosmetics distribution
companies and retailers the trust antecedents and consequences for both distributors and retailers are
identified. Then, the required data for trust assessment are collected using standard questionnaires
based on the developed conceptual model. Finally, the weight of each trust antecedent and consequence
from both distributors and retailers’ perspective are calculated. The obtained managerial insights help
practitioners in the cosmetics industry to improve their business relationships especially in Iran where
the economy is unstable and trust plays an important role in business relationships and successful
business alliances. The proposed conceptual model and obtained results also contribute to the existing
literature in performance evaluation of trust and better understanding using a ground-based empirical
investigation. To the best of our knowledge, this is the first study that investigates the trust between
distributors and retailers.
The rest of this paper is organized as follows. Section 2 presents the problem description. Section 3 is
dedicated to the proposed conceptual model of this study which is comprised of trust antecedents and
consequences from both distributors and retailers’ perspective. Section 4 proposes an empirical
investigation of trust in cosmetics supply chain in Iran. The obtained results and discussion are
presented in Section 5. Lastly, Section 6 concludes the paper and proposes some directions for future
research.
486
2. Problem description
2.1. Cosmetics market in Iran
The Persian culture emphasizes on fashion, art, aesthetics, and design more than any other culture in
the region. Iran is one of the biggest cosmetics markets in the world. Women above 15 years old are
the potential customers of this market. A vast majority of people below 40 has created a 4 billion
dollars’ cosmetics market in Iran which is an attractive destination for international cosmetics
companies’ products around the world (Hanzaee & Andervazh, 2012). The cosmetics supply chain in
Iran is completely decentralized. Distribution centers are located in Iran, while manufacturers and
suppliers are located in other countries. Due to the economic sanctions on Iran in the past decades and
political issues, cosmetics international brands do not hold any representatives in Iran. Therefore,
national distribution companies are importing cosmetics from international brands representatives
mainly located in Dubai, Turkey, and France. Currently, there are 93 legal cosmetics distribution
companies mainly located in Tehran which import various international cosmetics brands. After
importing the cosmetics, the distribution companies supply the demands of retailers in Tehran and send
the rest to the retailers in other major cities of Iran. Some of this distribution companies are working
exclusively with one international brand, while others import cosmetics from multiple brands.
Currently, there are more than two hundred cosmetics brands in Iran which are mainly produced in
Europe and China. The multiplicity of brands especially targeting middle and poor classes has resulted
in an aggressive competitive market. Besides the competition for market share, another problem in the
cosmetics market in Iran is fake cosmetics. Allergic reaction and skin breakouts are side effects of fake
cosmetics due to the presence of toxic materials such as mercury. It should be noted that it is not easy
to spot differences between fake and real cosmetics at the first look, however, the customer will finally
find out about the low quality of the product. The fake cosmetics can extensively damage brand and
retailers’ reputation. Besides the quality of the product, there are various other actions that can damage
each partner’s reputation and financial performance. For example, aggressive retail discounts can
damage brand reputation which is a financial damage to the manufacturer, main supplier and national
distributor. To this end, a collaborative business relationship between distributors and retailers plays
an important role in their financial performance. Trust is the key to a collaborative relationship which
results in a successful alliance and prosperity for both parties.
2.2. Trust antecedents and consequences
Trust between cosmetics distribution companies and retailers can benefit all the supply chain players.
The collaborative relationship which is the result of trust and commitment can improve the financial
performance of players in the context of the decentralized supply chain.
Distributors sell cosmetics to the retailers in Tehran and to the local distributors in other cities. The
scope of this study only considers cosmetics retailers in Tehran. The objective of this study is first,
determination of trust antecedents from both distributors and retailers’ perspective. Furthermore, the
trust consequences from both distributors and retailers’ perspective are determined using ground
empirical investigation. Finally, the weight and impact of each trust antecedent and consequence in the
cosmetics market is calculated.
3. Conceptual model
In order to build and keep the successful business relationship, we should build and keep trust. Since
trust is a multi-dimensional concept, there are various antecedents on it which should all be considered
in a comprehensive trust building model. According to Mayer et al. (1995), trust antecedents can be
classified into three main categories, including the general characteristics of the trustee, the trustor’s
propensity to trust others, and situational factors. The proposed conceptual model for the determination
487
I. Nematollahi / Decision Science Letters 8 (2019)
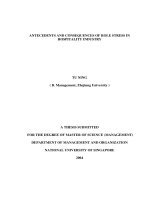
of trust antecedents in this study is based on the stated categories. In this regard, 78 executive and sales
managers, and business development experts of five cosmetics distribution companies located in
Tehran are interviewed and asked for their trust antecedents in retailers. The demographic features of
distribution companies’ participants in this empirical investigation are presented in Fig. 1. They are
also asked about their trust consequences and privileges for trusted retailers. After careful examination
of gathered data, the distributors’ trust antecedents and consequences are determined and presented in
Table 2.
70
61
60
49
45
50
44
40
26
29
25
7
10
17
12
4
2
Executive Manager
20
Doctoral
30
37
32
Age
Education
Position
Work Experience
Female
Male
> 10 Years
5-10 Years
< 5Years
Business and Market
Development Expert
Sales Manager and
Experts
Master
Bachelor
50-40
40-30
30-25
0
Gender
Fig. 1. The demographic features of distribution companies’ participants
Table 1
Trust antecedents and consequences of cosmetics distribution companies
Category
Indicators
Exclusive cooperation
Trust
Antecedents
Information sharing
Being a regular customer
Financial dependability
Retailer’s financial
conflicts records
Retailer’s consumer
complaints records
Retailer’s financial status
Trust
Consequences
Length of partnership
Permissible delay in
payments
Granting exclusive
products
Special discounts and
allowances
Advertising for the
trusted retailers
Information Sharing
Distributors’ Stand Point
Does this retailer exclusively present our products or he is presenting
other brands too?
Does this retailer share useful and reliable information?
Does this retailer make irregular orders or is he a regular customer?
Does this retailer make on-time payments or is he late in paying us?
Do we have any history of financial conflict with this retailer?
Have we received any consumer complaints regarding this retailer?
(Since our contact information is on all of our products, customers can
contact us any time)
How is the financial status of this retailer? Which part of the city is he
operating? How connected is he?
How long do we have a business relationship with this retailer?
We offer permissible delay in payments to our trusted retailers.
Sometimes we grant our exclusive or new products only to our trusted
retailers in each region of the city.
We offer special discounts and allowances to our trusted retailers.
There are usually customers who try to buy products directly from us,
however, we refer them to the available retailers in the city. In this
reference, our trusted retailers always come first. Also, we can
advertise our trusted retailers’ address and contact information on our
website.
We provide useful information for our trusted retailers.
488
In order to identify trust antecedents and consequences of retailers, 65 cosmetics retailers are
interviewed and asked. The demographic features of participant retailers are presented in Fig. 2. After
careful examination of gathered data, the retailers’ trust antecedents and consequences are determined
and presented in Table 3.
38
40
35
32
30
24
25
20
15
10
27
26
22
17
9
5
0
30-25
45-30
65-45
Age
< 5Years
5-10 Years
> 10 Years
Male
Work Experience
Female
Gender
Fig. 2. The demographic features of participant retailers
Table 2
Trust antecedents and consequences of cosmetics retailers
Category
Indicators
Information sharing
Brand reputation and
advertising
Product price
Trust
Antecedents
Distributor reputation
Product quality
Product delivery
Length of partnership
Brand advertising
Trust
Consequences
Increase in order volume
Making payments on time
Information sharing
Retailers’ Stand Point
Does this distributor share useful and reliable information?
Does this distributor provide brand reputable and well-known
products? (There are various distributors who sell Chinese lowquality products in the market)
Does this distributor provide products with a fair price?
Does this distributor have a good reputation in the cosmetics
market? Their previous partners (retailers) are satisfied with their
performance?
Are our customers satisfied with the product provided by this
distributor? Or we are receiving many complaints regarding
products quality.
Does this retailer deliver our orders on time?
How long do we have a business relationship with this distributors?
We advertise the brand of our trusted distributors in any way we
can (such as banners, stands and etc.)
We increase our order volume when we trust the distributor. This
can minimize our ordering costs and distributors’ delivering costs.
We try our best to make our trusted distributors’ payments on time.
We share any information we get directly from the market and
customers with our trusted distributors.
The proposed conceptual model is able to cover all aspects of trust from both distributors and retailers’
perspective. The identified trust antecedents form the trust of distributor-retailer business relationship,
while trust consequences determine the business behaviors which are the results of the formed trust.
4. Methodology
Performance evaluation of the proposed trust conceptual model is of great importance. As discussed in
Section 1, previous studies have indicated that various combination of trust antecedents can form trust
due to its multi-dimensionality. Ebrahim‐Khanjari et al. (2012) indicated that although distributors’
agents give false information to the retailers, they tend to trust agents in a long run. In other words,
although the information sharing which is one of the important antecedents of trust is violated, other
489
I. Nematollahi / Decision Science Letters 8 (2019)
trust antecedents have formed a trust. Therefore, determining the performance and weight of each
indicator in the proposed trust model is of great importance. This study proposes a fuzzy data
envelopment analysis (FDEA) based methodology for performance evaluation of the proposed trust
model. Since trust is a subjective concept, fuzzy logic is used to deal with the available uncertainty.
The proposed approach calculates a trust efficiency score by considering the trust antecedents as input
variables and trust consequences as outputs. The calculated efficiency score determines the level of
trust for each decision-making unit (DMU). The proposed FDEA based approach is used for distributors
and retailers, separately. The distribution companies’ participants and retailers’ participants are the
DMUs of each trust model, respectively. Fig. 3 demonstrates the schematic view of the proposed
approach.
Inputs: Distributors’ trust antecedents;
* Exclusive cooperation
* Information sharing
* Being a regular customer
* Financial dependability
* Retailer’s financial conflicts records
* Retailer’s consumer complaints
records
* Retailer’s financial status
* Length of partnership
Outputs: Distributor’s trust
consequences;
* Permissible delay in payments
* Granting exclusive products
* Special discounts and allowances
* Advertising for the trusted retailers
* Information sharing
Design questionnaire based on
distribution companies’ trust model
Design questionnaire based on
retailers’ trust model
Distribute the questionnaire among
distribution companies’ participants
and gather the required data
Distribute the questionnaire among
retailers’ participants and gather
the required data
Fuzzify the gathered data for better
dealing with uncertainty
Fuzzify the gathered data for better
dealing with uncertainty
Determine the input and output
variables of fuzzy data envelopment
analysis
Determine the input and output
variables of fuzzy data envelopment
analysis
Apply fuzzy data envelopment
analysis
Apply fuzzy data envelopment
analysis
Select the optimum FDEA (α-level)
based on maximum average
efficiency and normality test
Select the optimum FDEA (α-level)
based on maximum average
efficiency and normality test
Perform sensitivity analysis using
statistical methods
Perform sensitivity analysis using
statistical methods
Inputs: Retailers’ trust antecedents;
*Information sharing
* Brand reputation and advertising
* product price
* Distributor reputation
* Product quality
* Product delivery
* Length of partnership
Outputs: Retailers’ trust consequences;
* Brand advertising
* Increase in order volume
* Making payments on time
* Information sharing
Managerial insights for building
trust between distribution
companies and retailers
Fig. 3. The schematic view of the proposed methodology
4.1. Questionnaire design
In order to empirically test the proposed trust model for both distributors and retailers, a field
questionnaire is developed. Some of the items of the questionnaires for measuring the proposed
indicators are developed based on the conducted interviews, while others are derived from the past
studies such as Chen et al. (2011), Vlachos and Bourlakis (2006), Wang et al. (2014), and Panayides
and Lun (2009). In order to collect the required data from both distribution companies and retailers’
participants, two questionnaires based on the identified trust antecedents and consequences for each
party are distributed among related participants. In order to answer the items of the questionnaires,
participants have marked an evaluation ruler which ranges from 1 (Completely disagree) to 10
(Completely agree). The developed items for questionnaires are presented in Appendix A.
4.2. Fuzzy data envelopment analysis (FDEA)
Data envelopment analysis (DEA) is a non-parametric method for evaluating the efficiency of DMUs
based on multiple inputs and output variables. Although the primary use of DEA is investigating the
productivity and efficiency of DMUs, and finally ranking them, it is a popular tool for investigating the
relationship between multiple inputs and output variables in conceptual systems where the relationships
among variables are complex and vague (Azadeh et al., 2017a). In other words, DEA usually evaluates
490
the performance of a system by considering multiple inputs and output variables, however, in order to
evaluate the role of input and output variables, it is possible to reverse this process. In this regard, a set
of experts from the system who are aware of the system processes, express their knowledge about the
role of the input and output variables which form the overall performance of the system. Therefore, the
obtained efficiency score for each expert determines the overall performance of the system based on
the related input and output variables. The obtained set of efficiency scores from all participated experts
depict the efficiency map of the system which demonstrates the current status of the system. The
schematic view of the stated approach is presented in Fig. 4.
System’s Map of Efficiency
System
Processes
and
Procedures
Inputs
Outputs
Current Performance of
Variables
Fig. 4. Performance evaluation of system’s variables using DEA
In order to evaluate the performance of indicators in a conceptual model using DEA, first, the efficiency
scores of the DMUs considering all input and output variables are calculated. The obtained efficiency
scores depict the efficiency map of the considered system. Then, each variable is eliminated from the
model once, and the efficiency scores are recalculated. The non-existence of the eliminated variable
causes changes in the obtained efficiency scores and efficiency map of the system. Comparing the
obtained efficiency scores before and after the elimination of each variable from the model determines
the performance of the eliminated variable. The most important thing to set before efficiency
calculation using DEA is data preparation. Since efficiency can simply be defined as the ratio of output
variables to inputs, the output variables are the larger-the-better type (LTB), while inputs are smallerthe-better (STB) type. In the implementation of DEA based models for performance evaluation or
simply ranking DMUs, it is extremely important to fix the considered variables in the model based on
this process. In this study, trust antecedents are considered as input variables, while trust consequences
are outputs of each trust model (distributor’s trust model and retailer’s trust model). Since the nature of
all considered variables is LTB, inputs should be transformed to STB before efficiency calculation.
Therefore, Eq. (1) is used for transforming the input variables into STB type and scaling between 0 to
1 (called standardization), while Equation (2) only standardize the values of output variables (Azadeh
et al., 2017b; Rabbani et al.).
x ji
Max x ji x ji
Max x ji Min x ji
; i 1 , 2 ,..., I
(1)
491
I. Nematollahi / Decision Science Letters 8 (2019)
y ri
y ri Min y ri
Max y ri Min y ri
; i 1 , 2 ,..., I
(2)
where x ji is the value of input (trust antecedent) j from DMU i and x
ji
is the standardized value of
the transformed to STB type for input j from DMU i. Also, y ri is the value of output r from DMU i,
while y ri represents the standardized value of output r from DMU i. The traditional DEA models were
applicable for efficiency analysis of deterministic input and output variables, while in most cases data
sets are not deterministic. Considering the vague and subjective nature of trust and related collected
data, the fuzzy programming can be an appropriate choice. This study employs a fuzzy logic based
DEA model proposed by Azadeh and Alem (2010). The utilized FDEA model for R output variables
r 1 , 2 ,..., R , J input variables j 1 , 2 ,..., J , and I DMUs i 1 , 2 ,..., I is presented in Model
(3).
R
Max u r
y ri
r 1
J
v
j 1
j
(3)
R
u
r 1
x
ji 1
J
r
y ri v j xji 0
j 1
v j ,u r 0
where x
ji
; j 1 , 2 ,..., J ; r 1 , 2 ,..., R
represents the standardized value of input variable j from DMU i and y ri is the standardized
y ri are the fuzzy variables. Although various
value of output variable r from DMU i. Also, xji and
types of fuzzy membership functions are introduced in the literature, triangular fuzzy functions are the
most efficient ones due to the simplicity and accuracy. In order to transform the model (2) into the
triangular fuzzified model, the -cut method proposed by Chang and Lee (2012) is used. Lastly, the
transformed -cut based FDEA model is presented in Model (4).
xji x lji , x mji , x uji ,
y ri y ril , y rim , y riu
R
Max u r y rim 1 y ril , y rim 1 y riu
r 1
J
v x
j 1
j
m
ji
1 x lji , x mji 1 x uji 1
R
J
r 1
j 1
(4)
u r y rim 1 y ril , y rim 1 y riu v j x mji 1 x lji , x mji 1 x uji 0
v j ,u r 0
; j 1 , 2 ,..., J ; r 1 , 2 ,..., R
where u r represents the weight of output variables, while v
j
is the weight of inputs. The optimum -
cut is selected based on the highest average efficiency scores from the set of 0.1, 0.25, 0.5, 0.75, and
0.9.
492
5. Case study
As mentioned before, trust plays an important role in collaborative business relationships among supply
chain players particularly in a decentralized structure where each player tends to focus on its own
profits. Since each market and business has its own characteristics and motivational factors for trust, it
seems an effective and applicable trust model should arise from a case study. Cosmetics market is an
extremely competitive market in Iran which worth more than 4 billion dollars. Currently, the cosmetics
market is suffering from severe distrust and uncertainty due to the presence of low-quality fake
cosmetics. To this end, this paper proposes a trust model based on the empirical investigation for
cosmetics market in Iran. The considered players in the mentioned decentralized supply chain are
distribution companies and retailers.
5.1. Data gathering
As mentioned before, the required data in this study are collected using developed questionnaires
presented in Appendix A. The collected raw data from distribution companies and retailers’ participants
are presented in Appendix B. The demographic features of each DMU for distribution companies and
retailers’ trust models are presented in Appendix C, respectively.
5.2. Reliability of questionnaires
The reliability of the questionnaires’ data is evaluated by the Cronbach’s alpha test (Santos, 1999). The
total Cronbach’s alpha for distributors and retailers’ trust model are equal to 0.781 and 0.823,
respectively. Cronbach’s alpha value for each trust factor (trust antecedents and consequences) is also
calculated and presented in Table 3.
Table 3
The values of Cronbach’ alpha for the collected data
Distribution companies’ trust model
Trust factor
Cronbach’ alpha
Exclusive cooperation
Information sharing (as a trust
antecedent)
Being a regular customer
Financial dependability
Retailer’s financial conflicts
records
Retailer’s consumer
complaints records
Retailer’s financial status
Length of partnership
Permissible delay in payments
Granting exclusive products
Special discounts and
allowances
Advertising for the trusted
retailers
Information sharing (as a trust
consequence)
0.712
0.684
0.753
0.801
0.744
Retailers’ trust model
Trust factor
Cronbach’ alpha
Information sharing (as a trust
0.741
antecedent)
Brand reputation and
0.732
advertising
Product price
0.705
Distributor reputation
0.785
Product quality
0.762
0.712
Product delivery
0.744
0.715
0.694
0.736
0.853
Length of partnership
Brand advertising
Increase in order volume
Making payments on time
Information sharing (as a trust
consequence)
0.783
0.731
0.729
0.737
0.712
-
-
0.766
-
-
0.799
0.801
6. Computational results
6.1. Data preparation
In order to deal with the uncertainty and variability of the collected deterministic data, this study
implements a triangular fuzzification approach. Although various types of fuzzy membership functions
are introduced in the literature, triangular fuzzy functions are the most efficient ones due to the
simplicity and accuracy. Fuzzification of the collected data is performed based on Equations (5-10).
493
I. Nematollahi / Decision Science Letters 8 (2019)
xji x lji , x mji , x uji ,
y ri y ril , y rim , y riu
x lji Min x ji ; i 1 , 2 ,..., I
x
m
ji
x
ji
(5)
(6)
; i 1 , 2 ,..., I
x uji Max x ji ; i 1 , 2 ,..., I
(7)
y ril Min y ri
(8)
y
m
ri
; i 1 , 2 ,..., I
(9)
y ri ; i 1 , 2 ,..., I
y riu Max y riu ; i 1 , 2 ,..., I
(10)
where x uji is the maximum value of input j for all DMUs i 1 , 2 ,..., I , while x lji is the minimum
u
value of input j for all DMUs i 1 , 2 ,..., I . Also, y ri is the maximum value of output r for all
l
DMUs i 1 , 2 ,..., I , while y ri is the minimum value of output r for all DMUs i 1 , 2 ,..., I .
6.2. Determination of preferred -cuts
As mentioned before, the optimum α-cut for the FDEA model is determined based on the highest
average efficiency of DMUs and normality of the obtained results (Azadeh et al., 2017a). Therefore,
the efficiency scores of both trust models (distribution companies and retailers) are calculated with
candidate α-cuts, including 0.1, 0.25, 0.5, 0.75, and 0.9. All FDEA calculations in this study are
performed using AutoAssess package (Azadeh et al., 2013). According to the obtained results presented
in Table 4, the optimum α-cut for distributors and retailers’ trust models is 0.1. Figure 5 demonstrates
the results of the normality test for obtained efficiency scores of each trust model. It is notable that the
Anderson-Darling Normality test is used in this study. As a result of that, the next steps of the
performance evaluation of trust models are implemented based on the obtained optimum FDEA α-cuts
for each trust model.
Table 4
The obtained results of all considered FDEA models
Model
FDEA (α=0.1)
FDEA (α=0.25)
Distribution
Companies’ trust
model
Mean efficiency:
0.8775
P-value of normality
test: 0.202
Mean efficiency: 0.8701
P-value of normality
test:
0.164
Retailers’ trust model
Mean efficiency:
0.8633
P-value of normality
test: 0.217
Mean efficiency: 0.8524
P-value of normality
test:
0.145
FDEA (α=0.5)
Mean efficiency:
0.8038
P-value of
normality test:
0.105
Mean efficiency:
0.8503
P-value of
normality test:
0.057
FDEA (α=0.75)
Mean efficiency:
0.7854
P-value of normality
test: 0.049
Mean efficiency:
0.8250
P-value of normality
test: 0.067
FDEA (α=0.9)
Mean efficiency:
0.7599
P-value of
normality test:
0.085
Mean efficiency:
0.8131
P-value of
normality test:
0.093
Fig. 5. The results of the normality test for selected optimum FDEA α-cuts
The obtained efficiency scores for both introduced trust models using the selected optimum FDEA
models are presented in Table 5.
494
Table 5
The obtained efficiency scores for both trust models
DMU
1
2
3
4
5
6
7
8
9
10
11
12
13
14
15
16
17
18
19
20
21
22
23
24
25
26
27
28
29
30
31
32
33
34
35
36
Distribution Companies'
Trust
0.8242
0.8584
0.9169
0.8842
0.7823
0.8348
0.9405
0.9598
0.9367
0.8930
0.8169
0.8736
0.8249
0.7800
0.8601
0.9241
0.9245
0.9407
0.8306
0.8901
0.8641
0.8474
0.8286
0.8924
0.9615
0.8069
0.7902
0.8198
0.9819
0.9499
0.9432
0.8869
0.8718
0.8931
0.8579
0.8738
DMU
37
38
39
40
41
42
43
44
45
46
47
48
49
50
51
52
53
54
55
56
57
58
59
60
61
62
63
64
65
66
67
68
69
70
71
72
Distribution Companies'
Trust
0.9208
0.9512
0.8518
0.9245
0.8385
0.7765
0.8204
0.9566
0.7892
0.8310
0.7796
0.9630
0.9772
0.8941
0.8700
0.8876
0.8461
0.9087
0.8868
0.8777
0.9519
0.9114
0.7742
0.9190
0.8717
0.8144
0.9207
0.8827
0.8350
0.9555
0.8475
0.8490
0.8814
0.9180
0.8965
0.8344
DMU
73
74
75
76
77
78
DMU
1
2
3
4
5
6
7
8
9
10
11
12
13
14
15
16
17
18
19
20
21
22
23
24
25
26
27
28
29
Distribution Companies'
Trust
0.8277
0.9381
1.0000
0.7800
0.8893
0.8317
Retailers' Trust
0.8872
1.0000
0.8923
0.8149
0.8647
1.0000
0.8380
1.0000
0.9250
1.0000
0.8445
0.8719
0.7881
0.8032
0.8056
0.7988
0.8270
0.7080
0.8971
1.0000
0.8891
1.0000
0.9133
0.7278
0.9302
1.0000
0.8587
0.8976
0.8878
DMU
30
31
32
33
34
35
36
37
38
39
40
41
42
43
44
45
46
47
48
49
50
51
52
53
54
55
56
57
58
59
60
61
62
63
64
65
Retailers'
Trust
0.8672
0.8924
0.8584
0.8700
1.0000
0.8005
0.8783
0.9939
0.8311
1.0000
0.7230
0.8028
0.7998
0.7174
0.9137
0.8649
0.8758
0.7983
0.7521
0.8027
0.8080
0.9145
0.7730
0.6465
0.9214
0.8919
0.7356
0.7835
0.8672
0.7932
0.8983
0.8142
0.8475
0.9314
0.8513
0.9217
6.3. Results discussion
The obtained efficiency scores for all distribution companies and retailers’ decision-making units are
calculated using the selected FDEA models and presented in Table 5. In order to evaluate the tendency
of both parties toward forming a collaborative business relationship based on trust, 2 sample t-test is
used to compare the mean efficiency of both trust models. The obtained results indicate that both parties
are after building a collaborative business relationship based on trust and there is no significant
difference (Table 6).
Table 6
The result of 2 sample t-test between the mean efficiency of both parties for trust tendency
Model
Distribution companies’
trust model
Retailers’ trust model
Number
of DMUs
Mean
efficiency
78
0.8775
65
0.8633
2 Sample t-test
p-value
2 Sample t-test
t-value
Confidence
level
DF
0.245
1.17
95%
109
Evaluating the efficiency results of distribution companies’ trust model indicates that the age of
distribution companies’ experts doesn’t affect their tendency toward trust. Although there is not a
significant difference between the mean of trust efficiencies for experts’ educations in 95% confidence
level, as the education of distribution companies’ experts increases their tendency toward building a
collaborative business relationship based on trust with retailers slightly decreases (Table 7).
495
I. Nematollahi / Decision Science Letters 8 (2019)
Table 7
The impact of education on the development of trust in the distribution companies’ model
Education
Bachelor
Master
Ph.D.
Mean efficiency
0.8872
0.8659
0.8313
One-way ANOVA F-value
One-way ANOVA p-value
2.69
0.074
The obtained results indicate no significant difference between experts’ position, job experience and
gender on forming trust in distribution companies. Evaluating the efficiency results of retailers’ trust
model indicates that as the age of retailers grow, their tendency toward building a collaborative business
relationship based on trust decreases. The results also indicate that there is a significant difference
between the mean efficiencies of retailers based on gender. In this regard, female retailers demonstrate
more tendency toward building a collaborative business relationship based on trust. The results indicate
that retailers’ tendency grows as their job experience grows, however after ten years of job experience
their mean trust efficiency drops (Table 8).
Table 8
The impact of job experience on the development of trust in retailers’ model
Job Experience
<5 Years
5-10 Years
> 10 Years
Mean efficiency
0.8676
0.9024
0.8340
One-way ANOVA F-value
One-way ANOVA p-value
3.78
0.028
6.4. Sensitivity analysis
In order to calculate the performance weight of each trust factor, it is eliminated from the selected
FDEA model and efficiency scores are recalculated. The observed changes in the efficiency map of the
trust model are used to estimate the performance weight of eliminated factor. Table 9 demonstrates the
obtained results for each trust model.
Table 9
The estimated performance weight of each trust factor
Retailers’ trust model
Distribution companies’ trust model
Model
Trust factors
Full factor
Exclusive cooperation
Information sharing (as a trust antecedent)
Being a regular customer
Financial dependability
Retailer’s financial conflicts records
Retailer’s consumer complaints records
Retailer’s financial status
Length of partnership
Permissible delay in payments
Granting exclusive products
Special discounts and allowances
Advertising for the trusted retailers
Information sharing (as a trust consequence)
Full factor
Information sharing (as a trust antecedent)
Brand reputation and advertising
Product price
Distributor reputation
Product quality
Product delivery
Length of partnership
Brand advertising
Increase in order volume
Making payments on time
Information sharing (as a trust consequence)
Mean
efficiency
0.8755
0.9378
0.9103
0.8642
0.8319
0.8112
0.9545
0.8990
0.8286
0.9403
0.8641
0.8883
0.8569
0.8428
0.8633
0.9133
0.8740
0.8413
0.8512
0.8131
0.8914
0.8695
0.8251
0.8559
0.9054
0.8695
Efficiency
difference
-0.0623
-0.0348
0.0113
0.0436
0.0643
-0.0790
-0.0235
0.0469
-0.0648
0.0114
-0.0128
0.0186
0.0327
-0.0500
-0.0107
0.0220
0.0121
0.0502
-0.0281
-0.0062
0.0382
0.0074
-0.0421
-0.0062
Effect
Non-effective
Non-effective
Effective
Effective
Effective
Non-effective
Non-effective
Effective
Non-effective
Effective
Non-effective
Effective
Effective
Non-effective
Non-effective
Effective
Effective
Effective
Non-effective
Non-effective
Effective
Effective
Non-effective
Non-effective
Normalized
weight
0
0
0.1757
0.6781
1.0000
0
0
0.7294
0
0.1773
0
0.2893
0.5086
0.4382
0.2410
1.0000
0.7610
0.1474
-
496
The sensitivity analysis results indicate that in distribution companies’ trust model, trust antecedents
including exclusive cooperation, information sharing, retailers’ consumer complaints records, and
retailers’ financial status are non-effective in forming an efficient trust. However, retailers’ financial
conflicts records, length of partnership, financial dependability, and being a regular customer are most
effective trust antecedents, respectively. Regarding the distribution companies’ trust consequences in
retailers, the obtained results indicate that permissible delay in payments and special discounts and
allowances are non-effective, while information sharing, advertising for the trusted retailers, and
granting exclusive products are the most effective and desirable trust consequences. The sensitivity
analysis results for retailers’ trust model indicate that trust antecedents including information sharing,
brand reputation and advertising, product delivery, and length of the partnership are non-effective in
forming trust, however product quality, product price, and distributor reputation are the most effective
trust antecedents for retailers. Regarding the retailers’ trust consequences in distribution companies,
the obtained results indicate that brand advertising and increase in order volume are most effective and
desirable trust consequences while making payments on time and information sharing are noneffective.
7. Conclusion
Trust plays an important role in building collaborative business relationships between players
particularly in decentralized supply chain structures. To this end, identification and evaluation of
effective factors in building trust and its consequences in partnership is of great importance. Although
the concept of trust is very applicable to creating successful business alliances, further efforts are
needed to fill the knowledge gap. In this regard, this study proposed an empirical investigation of trust
antecedents and consequences in the business relationship of distribution companies and retailers in the
cosmetics market in Iran. Then, a performance evaluation algorithm based on the FDEA is proposed to
evaluate the weights of considered trust factors. It should be noted that the validity and reliability of
the obtained results are affected by the small sample size of the distribution companies’ experts (78)
and retailers’ participants (65). In order to verify the obtained results and get the better view of national
culture, future research on trust evaluation in cosmetics market is desirable. The obtained results of this
study indicated that information sharing is a non-effective trust antecedent, while it’s an important trust
consequence for both cosmetics players in the market. While information sharing is the main trust
consequence of distribution companies, brand advertising is the most effective trust consequence for
retailers. This study also investigated the role of both parties’ demographic features on building a
collaborative business relationship.
Acknowledgement
The authors would like to thank the anonymous reviewers for their constructive comments.
References
Arani, H. V., & Torabi, S. (2018). Integrated material-financial supply chain master planning under
mixed uncertainty. Information Sciences, 423, 96-114.
Azadeh, A., & Alem, S. M. (2010). A flexible deterministic, stochastic and fuzzy Data Envelopment
Analysis approach for supply chain risk and vendor selection problem: Simulation analysis. Expert
Systems with Applications, 37(12), 7438-7448.
Azadeh, A., Ghaderi, S., Anvari, M., Izadbakhsh, H., Rezaee, M. J., & Raoofi, Z. (2013). An integrated
decision support system for performance assessment and optimization of decision-making units. The
International Journal of Advanced Manufacturing Technology, 66(5-8), 1031-1045.
Azadeh, A., Salmanzadeh-Meydani, N., & Motevali-Haghighi, S. (2017a). Performance optimization
of an aluminum factory in economic crisis by integrated resilience engineering and mathematical
programming. Safety Science, 91, 335-350.
I. Nematollahi / Decision Science Letters 8 (2019)
497
Azadeh, A., Shafiee, F., Yazdanparast, R., Heydari, J., & Keshvarparast, A. (2017b). Optimum
Integrated Design of Crude Oil Supply Chain by a Unique Mixed Integer Nonlinear Programming
Model. Industrial & Engineering Chemistry Research, 56(19), 5734-5746.
Beer, R., Ahn, H.-S., & Leider, S. (2018). Can trustworthiness in a supply chain be signaled?
Management science, 64(9), 3971-4470.
Cai, S., Goh, M., de Souza, R., & Li, G. (2013). Knowledge sharing in collaborative supply chains:
twin effects of trust and power. International journal of production Research, 51(7), 2060-2076.
Capaldo, A., & Giannoccaro, I. (2015a). How does trust affect performance in the supply chain? The
moderating role of interdependence. International journal of production Economics, 166, 36-49.
Capaldo, A., & Giannoccaro, I. (2015b). Interdependence and network-level trust in supply chain
networks: A computational study. Industrial Marketing Management, 44, 180-195.
Chang, P.-T., & Lee, J.-H. (2012). A fuzzy DEA and knapsack formulation integrated model for project
selection. Computers & Operations Research, 39(1), 112-125.
Chen, I. J., & Paulraj, A. (2004). Understanding supply chain management: critical research and a
theoretical framework. International journal of production Research, 42(1), 131-163.
Chen, J. V., Yen, D. C., Rajkumar, T., & Tomochko, N. A. (2011). The antecedent factors on trust and
commitment in supply chain relationships. Computer Standards & Interfaces, 33(3), 262-270.
Ebrahim‐Khanjari, N., Hopp, W., & Iravani, S. M. (2012). Trust and information sharing in supply
chains. Production and Operations Management, 21(3), 444-464.
Fawcett, S. E., Jin, Y. H., Fawcett, A. M., & Magnan, G. (2017). I know it when I see it: the nature of
trust, trustworthiness signals, and strategic trust construction. The International Journal of Logistics
Management, 28(4), 914-938.
Fawcett, S. E., Jones, S. L., & Fawcett, A. M. (2012). Supply chain trust: The catalyst for collaborative
innovation. Business Horizons, 55(2), 163-178.
Glaeser, E. L., Laibson, D. I., Scheinkman, J. A., & Soutter, C. L. (2000). Measuring trust. The
quarterly journal of economics, 115(3), 811-846.
Han, G., & Dong, M. (2015). Trust-embedded coordination in supply chain information sharing.
International journal of production Research, 53(18), 5624-5639.
Handfield, R. B., & Bechtel, C. (2002). The role of trust and relationship structure in improving supply
chain responsiveness. Industrial Marketing Management, 31(4), 367-382.
Hanzaee, K. H., & Andervazh, L. (2012). The influence of brand loyalty on cosmetics purchase
intention of Iranian female consumers. Journal of Basic and Applied Scientific Research, 2(5), 53895398.
Kotabe, M., & Kothari, T. (2016). Emerging market multinational companies’ evolutionary paths to
building a competitive advantage from emerging markets to developed countries. Journal of World
Business, 51(5), 729-743.
Kwon, I.-W. G., & Suh, T. (2005). Trust, commitment and relationships in supply chain management:
a path analysis. Supply chain management: an international journal, 10(1), 26-33.
Laeequddin, M., Sahay, B., Sahay, V., & Abdul Waheed, K. (2010). Measuring trust in supply chain
partners' relationships. Measuring Business Excellence, 14(3), 53-69.
Laeequddin, M., Sahay, B., Sahay, V., & Abdul Waheed, K. (2012). Trust building in supply chain
partners relationship: an integrated conceptual model. Journal of Management Development, 31(6),
550-564.
Lui, S. S., Wong, Y.-y., & Liu, W. (2009). Asset specificity roles in interfirm cooperation: Reducing
opportunistic behavior or increasing cooperative behavior? Journal of Business research, 62(11),
1214-1219.
Mayer, R. C., Davis, J. H., & Schoorman, F. D. (1995). An integrative model of organizational trust.
Academy of management review, 20(3), 709-734.
Melnyk, S. A., Lummus, R. R., Vokurka, R. J., Burns, L. J., & Sandor, J. (2009). Mapping the future
of supply chain management: a Delphi study. International journal of production Research, 47(16),
4629-4653.
498
Moore, K. R. (1998). Trust and relationship commitment in logistics alliances: a buyer perspective.
Journal of Supply Chain Management, 34(4), 24-37.
Moorman, C., Zaltman, G., & Deshpande, R. (1992). Relationships between providers and users of
market research: The dynamics of trust within and between organizations. Journal of marketing
research, 29(3), 314.
Ozpolat, K., Dresner, M., Zwolińska, B., Michlowicz, E., & Werbińska, M. (2018). A dark side of longterm VMI relationships: supply chain trust. Research in Logistics and Production, 8(2), 117-143.
Panayides, P. M., & Lun, Y. V. (2009). The impact of trust on innovativeness and supply chain
performance. International journal of production Economics, 122(1), 35-46.
Prajogo, D. I. (2016). The strategic fit between innovation strategies and business environment in
delivering business performance. International journal of production Economics, 171, 241-249.
Rabbani, M., Farshbaf-Geranmayeh, A., & Yazdanparast, R. A simulation optimization approach for
integrated resource allocation in an emergency department, pharmacy, and lab. Intelligent Decision
Technologies, 12(2), 187-212.
Sahay, B. S. (2003). Understanding trust in supply chain relationships. Industrial Management & Data
Systems, 103(8), 553-563.
Santos, J. R. A. (1999). Cronbach’s alpha: A tool for assessing the reliability of scales. Journal of
extension, 37(2), 1-5.
Sharfman, M. P., Shaft, T. M., & Anex, R. P. (2009). The road to cooperative supply‐chain
environmental management: trust and uncertainty among pro‐active firms. Business Strategy and
the Environment, 18(1), 1-13.
Stadtler, H. (2015). Supply chain management: An overview Supply chain management and advanced
planning (pp. 3-28): Springer.
Tejpal, G., Garg, R., & Sachdeva, A. (2013). Trust among supply chain partners: a review. Measuring
Business Excellence, 17(1), 51-71.
Urban, G. L., Sultan, F., & Qualls, W. J. (2000). Placing trust at the center of your Internet strategy.
MIT Sloan Management Review, 42(1), 39.
Vlachos, I. P., & Bourlakis, M. (2006). Supply chain collaboration between retailers and
manufacturers: do they trust each other? Paper presented at the Supply Chain Forum: An
International Journal.
Wang, L., Yeung, J. H. Y., & Zhang, M. (2011). The impact of trust and contract on innovation
performance: The moderating role of environmental uncertainty. International journal of production
Economics, 134(1), 114-122.
Wang, Z., Ye, F., & Tan, K. H. (2014). Effects of managerial ties and trust on supply chain information
sharing and supplier opportunism. International journal of production Research, 52(23), 7046-7061.
Yazdanparast, R., Zadeh, S. A., Dadras, D., & Azadeh, A. (2018). An intelligent algorithm for
identification of optimum mix of demographic features for trust in medical centers in Iran. Artificial
intelligence in medicine, 88, 25-36.
Yeung, J. H. Y., Selen, W., Zhang, M., & Huo, B. (2009). The effects of trust and coercive power on
supplier integration. International journal of production Economics, 120(1), 66-78.
Zhang, M., & Huo, B. (2013). The impact of dependence and trust on supply chain integration.
International Journal of Physical Distribution & Logistics Management, 43(7), 544-563.
Zhao, X., Huo, B., Flynn, B. B., & Yeung, J. H. Y. (2008). The impact of power and relationship
commitment on the integration between manufacturers and customers in a supply chain. Journal of
Operations Management, 26(3), 368-388.
Zhao, X., Huo, B., Selen, W., & Yeung, J. H. Y. (2011). The impact of internal integration and
relationship commitment on external integration. Journal of Operations Management, 29(1-2), 1732.
© 2019 by the authors; licensee Growing Science, Canada. This is an open access article
distributed under the terms and conditions of the Creative Commons Attribution (CC-BY)
license ( />
I. Nematollahi / Decision Science Letters 8 (2019)
499
Appendix A
Table A1
The developed questionnaire for performance evaluation of distributors’ trust in retailers
Factor
Question
e.g. How important is retailer’s exclusive cooperation with you?
Exclusive cooperation e.g. To find out that our retailers are also presenting another brands and
working with other distribution companies affect our trust in them.
e.g. We expect our trusted retailers to provide us useful and reliable
information.
Information sharing
e.g. If our trusted retailers acquire any information that may be important
to us, they should share it with us.
e.g. We don’t tend to trust retailers with irregular orders.
Being a regular
e.g. One of the main prerequisites to earn our trust is to be our regular
customer
customer.
e.g. On-time payments are crucial for building trust in our business.
Financial dependability e.g. Although we work even with retailers who are late in paying us, we
don’t tend to trust them.
e.g. Our trusted retailers do not have any history of financial conflicts
Retailer’s financial
with us.
e.g. Previous financial conflicts prevent building a collaborative business
conflicts records
relationship.
e.g. Retailer’s financial status is a very important factor in his
Retailer’s financial
trustworthiness.
status
e.g. We tend to trust retailers with high financial liability.
e.g. We tend to trust our retailers in a long run.
Length of partnership e.g. The length of business relationship is very important in retailer’s
trustworthiness evaluation.
e.g. We provide permissible delay in payments for our trusted retailers.
Permissible delay in
e.g. Permissible delay in payments are only available for our trusted
payments
retailers.
e.g. In selecting retailers for granting exclusive products, trustworthiness
Granting exclusive
is a key factor.
products
e.g. Only our trusted retailers are granted exclusive products.
e.g. In granting special discounts and allowances, our trusted retailers
Special discounts and come first.
allowances
e.g. Only our trusted retailers are granted special discounts and
allowances.
e.g. We tend to advertise only for our trusted retailers.
Advertising for the
e.g. When it comes to advertising products, our trusted retailers are also
trusted retailers
considered.
e.g. We share useful information only with our trusted retailers.
Information sharing
e.g. When it comes to information sharing with partners, our trusted
retailers come first.
500
Table A2
The developed questionnaire for performance evaluation of retailers’ trust in local suppliers
Factor
Question
Information
e.g. Our trusted distributors should provide us useful and reliable information.
e.g. We don’t tend to trust distributors who don’t share information with us.
sharing
e.g. Brand reputation and advertising in the market significantly affect our trust in
Brand
distribution companies who present those brands.
reputation and
e.g. When don’t tend to trust distribution companies who don’t present reputable
advertising
brands.
e.g. We tend to trust distribution companies who provide us fair and competitive
prices.
Product price
e.g. Our trusted distributors always provide us products with competitive and fair
prices compare to the available products in the market.
e.g. The distribution company’s reputation in the market plays an important role in
its trustworthiness.
Distributor
e.g. We don’t tend to trust distribution companies who has not a reputation of being
reputation
fair and honest.
e.g. Our trusted distribution companies provide us high-quality products as
promised.
Product quality
e.g. Delivering product quality as promised determines the trustworthiness of
distribution companies.
e.g. We don’t tend to trust new distribution companies. Our trust is formed in the
long run.
Length of
e.g. The length of business relationship significantly affects the trustworthiness of
partnership
cosmetics distribution companies.
e.g. We usually advertise for out trusted distribution companies in the market.
Brand
e.g. We support our trusted distribution companies by advertising their products in
advertising
the market and recommending them to the other retailers.
e.g. We increase our order volume when we trust a distribution company.
Increase in
order volume e.g. Trust in distribution companies significantly affects our orders’ volume.
e.g. We try our best to make payments on time for our trusted distribution
Making
companies.
payments on
e.g. When it comes to making payments on time, our trusted distribution companies
time
come first.
e.g. We share useful information only with our trusted distribution companies.
Information
e.g. When it comes to information sharing with partners, our trusted distribution
sharing
companies come first.
Appendix B
The collected raw data
Table B1
The average values of each trust factor for distribution companies (average of two items for each factor in the questionnaire)
DMU
1
2
3
4
5
6
7
8
9
10
11
12
13
14
15
F1
5.5
6
6.5
5.5
7
4
6
5
6.5
5
6.5
5.5
4
6.5
5
F2
5
5.5
4.5
6.5
4.5
4.5
6.5
5
5.5
4.5
4.5
3.5
5
5.5
5
F3
8.5
6
4.5
6
7.5
6.5
6
6.5
5
6
7
5.5
7.5
6
5
F4
9
8.5
9
10
8.5
8
8.5
7.5
7.5
7.5
9
7.5
7.5
9
8
F5
7.5
9.5
8
7.5
10
9.5
8.5
6
7.5
7.5
9
7.5
9.5
9
10
F6
6
5.5
3.5
5.5
4.5
5.5
3
3.5
1.5
4
2.5
5
3.5
2.5
3
F7
7
5.5
8.5
5.5
6.5
5.5
3.5
5
7.5
8
7
8.5
4.5
6.5
7.5
F8
6.5
4.5
5.5
4
6.5
7.5
3.5
5
4.5
4.5
6.5
5.5
6.5
5
6.5
F9
5.5
4.5
5
3.5
3.5
5.5
6
4.5
5
3.5
3.5
3.5
1.5
1.5
4
F10
7
8
5.5
7
8
7
7.5
6
7.5
8.5
7
5.5
6
6.5
5.5
F11
7
5.5
7.5
8.5
6
4.5
6
4.5
4.5
3.5
6.5
5.5
7
4.5
6.5
F12
5.5
4.5
6.5
5.5
6
3.5
4.5
6.5
6.5
5.5
7
6
5
6
6.5
F13
7
8.5
10
7.5
6.5
9
7
8
6.5
7.5
5.5
8
6.5
5.5
8.5
501
I. Nematollahi / Decision Science Letters 8 (2019)
DMU
16
17
18
19
20
21
22
23
24
25
26
27
28
29
30
31
32
33
34
35
36
37
38
39
40
41
42
43
44
45
46
47
48
49
50
51
52
53
54
55
56
57
58
59
60
61
62
63
64
65
66
67
68
69
70
71
72
73
74
75
76
77
78
F1
5.5
6.5
5
4.5
6.5
4.5
4
5.5
5.5
6.5
5.5
2.5
4
3.5
3
4.5
4.5
4
2
2.5
2.5
4.5
3
4
3.5
3
5.5
4.5
4
6
2.5
4.5
3.5
4
4.5
3.5
5.5
4.5
4.5
4
4
3
4.5
4.5
5.5
4
4
2.5
3
4.5
3.5
4.5
5.5
1.5
2.5
4.5
6.5
5
1.5
2.5
4.5
1.5
2
F2
3.5
5.5
5.5
5.5
5
4.5
6
5
5.5
4.5
6.5
4.5
3
3
3.5
5
2.5
1.5
4.5
5.5
6
4
2.5
3.5
3.5
5.5
5
4
3.5
3
2
4.5
3.5
1.5
3
4.5
5
4.5
2.5
6
4
5.5
6.5
5
3.5
6
6
1.5
5.5
3
6.5
5.5
6.5
6
4.5
3.5
1.5
6
4.5
2
5
4.5
6.5
F3
7
6
6.5
8.5
7
7.5
6
7
5.5
5.5
8
6.5
9.5
5
5
4.5
6
9
7.5
5.5
7.5
4.5
5.5
6.5
8.5
9.5
9
9.5
5
7.5
7.5
8.5
6
4.5
4.5
5
5
8.5
8.5
5.5
5.5
5
5.5
9
5.5
8
6
7.5
7.5
9.5
6
6
4.5
6.5
7.5
7
8
7.5
5.5
5
8.5
7.5
6.5
F4
5.5
7.5
7.5
9
7
7.5
9.5
7.5
7
6.5
7.5
8.5
7
7.5
8.5
9.5
8.5
10
9.5
9.5
6.5
9.5
7.5
9
7.5
7.5
7.5
8.5
9.5
7.5
10
8.5
8.5
8
8.5
6.5
7.5
9
7
9.5
6.5
7.5
9.5
9.5
6.5
7
8.5
9.5
7.5
7
7.5
9.5
7.5
9
6.5
7.5
8
8
7.5
7.5
8.5
8
9.5
F5
8.5
7
9.5
9
8
9.5
8
8.5
9
7.5
8
8.5
10
8.5
8
7.5
9
6.5
8.5
8
7.5
7
7.5
7
7.5
9
9.5
6.5
7.5
9
7.5
10
6.5
8.5
8
9.5
10
9.5
9
7.5
10
8
8.5
8
9.5
8.5
9.5
9
9
7.5
7.5
7.5
9
6.5
8.5
9
7.5
8.5
9.5
9.5
8.5
8.5
10
F6
4.5
3
2.5
4
1.5
2.5
4
5
6
3
2
2.5
4.5
3.5
2
1.5
3.5
5.5
1.5
4.5
4
2.5
2
4.5
4
4.5
2.5
5.5
1.5
4
3.5
2
4.5
2
2.5
4.5
1.5
1.5
5.5
3.5
5.5
1.5
3
1.5
1.5
2.5
4
3.5
2
1.5
3
3.5
4
3.5
2
1.5
3
4
2.5
3
5
3.5
1.5
F7
8
4.5
4.5
4.5
5.5
6
6
7
6
7
7.5
7
6.5
4
5.5
5.5
3.5
3
5.5
6
5.5
5.5
5.5
5.5
4
6.5
5.5
6.5
5
6.5
6
4
4.5
5.5
6
5.5
6.5
6.5
3.5
4.5
5.5
3.5
3
5.5
6
5
5.5
5.5
6.5
5.5
4.5
4.5
6.5
4
6.5
5
5.5
5
5.5
6
4.5
4.5
5.5
F8
6
4.5
7
6.5
8
8
7.5
6.5
8.5
7.5
6.5
9.5
8.5
10
9.5
8.5
7
8
10
8.5
8
8.5
9
9.5
9
8.5
9
9
8.5
9
8.5
8.5
9.5
9
10
8.5
9
10.5
9
10
8.5
8.5
7
8.5
9.5
9
7.5
8.5
9
9.5
8.5
8.5
8.5
9.5
7.5
8.5
9.5
8.5
9.5
8.5
9.5
9
8.5
F9
5.5
5
7.5
4.5
5.5
3.5
3.5
3.5
5
6.5
3.5
3.5
2.5
6
5
7
2.5
5.5
5.5
4.5
2.5
3.5
4
4
4.5
6
3.5
3.5
5.5
2
3
1.5
4.5
5
4.5
2.5
4
5.5
5.5
5
5.5
3.5
3.5
3
3.5
3
2
3.5
3.5
4
5.5
3
4
5
5
4
2.5
4.5
5.5
4
4.5
4
3.5
F10
7.5
6
8
7.5
7
7.5
7
6
7
8.5
4.5
4.5
8.5
6.5
7
5.5
5.5
6.5
8.5
6.5
8
6.5
5.5
5.5
6
6
6
5.5
8.5
5.5
5
7.5
8
5.5
5.5
6.5
7.5
8.5
7.5
5.5
6
5
8
5
6.5
8.5
7.5
8
6.5
5
6.5
5.5
6.5
5.5
4.5
7
6.5
4.5
7
7
4.5
6.5
6
F11
5.5
5
6.5
4
3
7.5
6.5
5
6
5
6.5
4
6.5
7
7.5
6.5
4
4
7.5
4.5
3.5
6
7.5
5.5
4.5
7
4.5
7.5
5.5
5.5
4.5
4.5
5.5
7
5.5
4
6
6.5
4.5
7.5
5
4.5
4.5
3.5
7.5
5
5
6
6.5
4
7
5.5
7
6
6
5
5.5
5.5
5.5
7.5
6
5.5
5.5
F12
6.5
4
6
8
6.5
6.5
5.5
6
7.5
6
6
5.5
7
7
7.5
7
6.5
5.5
5.5
7.5
6.5
5.5
6.5
5.5
9
6.5
5.5
9
6.5
7
6
7.5
8.5
9
7.5
9
6.5
8.5
7.5
6.5
8.5
7.5
8.5
8.5
7
9.5
6.5
8.5
7.5
6.5
6
6.5
7.5
5.5
6.5
7
7
7.5
7.5
9
6.5
7.5
7.5
F13
7.5
7.5
6.5
6.5
8.5
6.5
8
9
10
8.5
6.5
7.5
7.5
8.5
5.5
7
9.5
7.5
6.5
7.5
7.5
9.5
6
8.5
9.5
8
9
5.5
6.5
8
8.5
5.5
8
6.5
7
6.5
9.5
6.5
9.5
8.5
6
9.5
8
6.5
8.5
5.5
7.5
9.5
9.5
7
9
8.5
5.5
5.5
8.5
7.5
6.5
8.5
8
9.5
7
7
8
Note; F1: Exclusive cooperation, F2: Information sharing (as a trust antecedent), F3: Being a regular customer, F4: Financial dependability, F5: Retailer’s
financial conflicts records, F6: Retailer’s consumer complaints records, F7: Retailer’s financial status, F8: Length of partnership, F9: Permissible delay in
payments, F10: Granting exclusive products, F11: Special discounts and allowances, F12: Advertising for the trusted retailers, and F13: Information
Sharing (as a trust consequence).
Table B2
The average values of retailers’ each trust factor (average of two items for each factor in the questionnaire)
DMU
1
2
3
4
5
6
7
8
9
10
11
12
13
14
15
16
17
18
R1
4.5
5.5
4.5
5
3.5
4.5
4.5
6
4.5
5
4.5
4
3.5
5
5.5
4
4.5
4
R2
9.5
7.5
5
6.5
9
6
5.5
4.5
6
8.5
7.5
9
6.5
7
8.5
9
7
6.5
R3
6.5
8.5
7
8.5
8.5
7
9.5
8.5
9.5
9.5
8
9.5
8.5
8.5
8.5
7.5
9
6.5
R4
6.5
7.5
9.5
8
7.5
7.5
6.5
6.5
5.5
8
9
9.5
7.5
8.5
9.5
8
6.5
7
R5
10
9
9
9.5
10
8.5
9.5
9
9.5
8.5
9
10
10
9.5
10
9.5
8.5
9
R6
6.5
8.5
7.5
6.5
8.5
5
5
4.5
5.5
7.5
6.5
7.5
6.5
4.5
6.5
7.5
5.5
7
R7
6
7.5
9.5
7.5
7.5
5.5
5.5
4.5
6
5.5
7.5
7.5
7.5
6.5
7
6.5
9.5
9
R8
8.5
9.5
8.5
9
9
10
9.5
8.5
10
10
9
8
8.5
7.5
8
8.5
9.5
7.5
R9
9
6.5
6.5
9.5
8.5
9.5
5.5
10
6.5
9.5
9.5
9.5
6.5
5.5
9.5
9.5
8.5
6
R10
5.5
4.5
6.5
4
6.5
7
4
5.5
4
6.5
7.5
3.5
5.5
4
6
3.5
6.5
7
R11
7
9
8.5
5.5
5.5
7.5
6.5
9
9.5
6.5
6.5
7.5
6.5
5.5
9.5
6
8.5
9
502
DMU
19
20
21
22
23
24
25
26
27
28
29
30
31
32
33
34
35
36
37
38
39
40
41
42
43
44
45
46
47
48
49
50
51
52
53
54
55
56
57
58
59
60
61
62
63
64
65
R1
4
7
3
3.5
2.5
2.5
4.5
2.5
5.5
4.5
5.5
4.5
4
4.5
4
4.5
5.5
6
6.5
5.5
2.5
6.5
6
4.5
3
5
5.5
2.5
3.5
5.5
5.5
5.5
3
5
3
3.5
3
3
5.5
5.5
3.5
5
5.5
5
2.5
5.5
1.5
R2
8.5
7
8.5
5
4.5
8
7.5
9
6.5
6.5
9
9
5.5
6.5
9
6
8.5
6.5
7.5
9.5
6
5
8.5
8.5
8.5
8.5
6
8
4.5
9.5
9
7.5
8
5
5
5.5
6.5
9.5
8.5
8.5
5
4.5
4.5
8.5
6
9.5
5
R3
10
8.5
8
7.5
8.5
7.5
7.5
8.5
8.5
8.5
6.5
9.5
7.5
8
7.5
9.5
8.5
8.5
8.5
8.5
9.5
9
7
7
8
6.5
7.5
9.5
9.5
9.5
7.5
10
7.5
9.5
8.5
9.5
8.5
7.5
6.5
6.5
9
7
8.5
9
10
8.5
9.5
R4
8.5
9.5
8.5
7.5
7.5
8
7
6
6
10
5.5
10
7.5
5.5
7
6.5
7.5
7.5
8.5
5.5
6
9
9.5
8.5
8.5
6.5
10
7.5
7.5
8.5
6
9.5
10
7
6.5
7.5
10
5.5
6.5
6.5
6
5.5
6.5
9.5
9.5
9
5.5
R5
10
9.5
9.5
9.5
10
9.5
9
9.5
9
10
10
10
9.5
10
9
8.5
9
10
9
9.5
9.5
9.5
9
9
10
8.5
9.5
9.5
10
10
10
9
8.5
9
9.5
10
9.5
9
9.5
9.5
9.5
8.5
10
9.5
9.5
9
10
R6
5
3.5
6
5.5
5.5
7.5
4.5
7
8.5
6.5
5.5
5
8.5
6.5
5.5
5
6.5
5.5
4
4.5
6.5
4.5
6.5
5
8
6.5
3.5
4.5
4
3.5
7
6.5
7.5
5.5
6
4.5
8.5
8.5
7
6.5
8.5
6.5
5.5
7
4
4.5
7.5
R7
5.5
7
5.5
9.5
7
8.5
8.5
7
8.5
8.5
7.5
8.5
9.5
9.5
7.5
5
9.5
7.5
4.5
6.5
5.5
6
8.5
10
9.5
7.5
9
6
10
8.5
8.5
8.5
7
6.5
10
7.5
6.5
9.5
10
8.5
8.5
9.5
9.5
9
5.5
6.5
8.5
R8
8
8.5
8.5
8
9.5
8
7.5
10
8.5
8.5
8.5
10
8.5
9.5
8.5
10
9.5
7.5
10
9
8.5
9.5
9.5
8.5
10
8.5
9
9.5
9.5
10
8.5
8
9.5
7.5
8.5
9
9.5
10
8
10
8
7.5
9.5
10
8.5
9.5
8.5
R9
8
9.5
5.5
9.5
7
6.5
6.5
9.5
8.5
7
8
10
8.5
7
10
5.5
9
9
8.5
7.5
8.5
5.5
6
7.5
5.5
5.5
10
8
5.5
6
7.5
9.5
8.5
8
9
9.5
5.5
6.5
10
8.5
7
7.5
7.5
8.5
10
7.5
7.5
R10
6.5
8
7.5
6.5
6.5
6
7.5
6.5
7.5
7.5
7.5
5
8
7.5
8.5
7
7
7.5
4.5
8
6.5
5
4.5
4.5
6.5
7.5
4.5
4.5
4.5
8.5
7.5
6.5
6.5
4
5.5
7
8
6.5
5
4
4.5
7.5
4.5
8
7
6.5
5
R11
5
4.5
8
9
5.5
7
8.5
4.5
6
6.5
7.5
5
7
6.5
7
7.5
8.5
8.5
8.5
7.5
9.5
6.5
8.5
8.5
6.5
9.5
4.5
8
7
4.5
7.5
5.5
8
8.5
7.5
9
6.5
5.5
8
8.5
5.5
8
9.5
8.5
9.5
7.5
7
Note; R1: Information sharing (as a trust antecedent), R2: Brand reputation and advertising, R3: Product price, R4:
Distributor reputation, R5: Product quality, R6: Product delivery, R7: Length of partnership, R8: Brand advertising, R9:
Increase in order volume, R10: Making payments on time, R11: Information sharing (as a trust consequence).
Appendix C. The demographic features of participants
Table C1
The demographic features of distribution companies’ experts
DMU
1
2
3
4
5
6
7
8
9
10
11
12
13
14
15
16
17
Gender
Female
Male
Male
Male
Male
Female
Male
Male
Male
Male
Female
Male
Male
Male
Male
Male
Female
Work Experience
< 5 Years
< 5 Years
< 5 Years
< 5 Years
< 5 Years
< 5 Years
< 5 Years
< 5 Years
< 5 Years
< 5 Years
< 5 Years
< 5 Years
< 5 Years
< 5 Years
< 5 Years
< 5 Years
< 5 Years
Position
Business and Market Development Expert
Business and Market Development Expert
Business and Market Development Expert
Business and Market Development Expert
Business and Market Development Expert
Business and Market Development Expert
Business and Market Development Expert
Business and Market Development Expert
Business and Market Development Expert
Business and Market Development Expert
Sales Manager
Business and Market Development Expert
Business and Market Development Expert
Business and Market Development Expert
Business and Market Development Expert
Business and Market Development Expert
Sales Manager
Education
Bachelor
Master
Bachelor
Bachelor
Bachelor
Master
Bachelor
Master
Master
Bachelor
Master
Master
Bachelor
Master
Master
Bachelor
Master
Age
25-30
503
I. Nematollahi / Decision Science Letters 8 (2019)
DMU
18
19
20
21
22
23
24
25
26
27
28
29
30
31
32
33
34
35
36
37
38
39
40
41
42
43
44
45
46
47
48
49
50
51
52
53
54
55
56
57
58
59
60
61
62
63
64
65
66
67
68
69
70
71
72
73
74
75
76
77
78
Gender
Male
Female
Male
Male
Male
Male
Female
Male
Female
Male
Male
Female
Male
Female
Male
Male
Male
Male
Male
Male
Male
Male
Male
Male
Male
Male
Female
Male
Male
Female
Male
Female
Male
Male
Female
Male
Male
Male
Male
Male
Female
Male
Male
Male
Male
Female
Male
Male
Male
Male
Male
Male
Male
Male
Male
Female
Male
Female
Male
Male
Male
Work Experience
< 5 Years
< 5 Years
< 5 Years
< 5 Years
< 5 Years
< 5 Years
< 5 Years
< 5 Years
< 5 Years
< 5 Years
5-10 Years
< 5 Years
5-10 Years
5-10 Years
5-10 Years
< 5 Years
5-10 Years
< 5 Years
5-10 Years
> 10 Years
< 5 Years
5-10 Years
> 10 Years
5-10 Years
> 10 Years
< 5 Years
5-10 Years
5-10 Years
< 5 Years
5-10 Years
> 10 Years
5-10 Years
> 10 Years
< 5 Years
5-10 Years
5-10 Years
< 5 Years
> 10 Years
< 5 Years
5-10 Years
> 10 Years
5-10 Years
< 5 Years
5-10 Years
5-10 Years
> 10 Years
5-10 Years
5-10 Years
5-10 Years
5-10 Years
5-10 Years
5-10 Years
> 10 Years
5-10 Years
5-10 Years
5-10 Years
> 10 Years
5-10 Years
> 10 Years
5-10 Years
> 10 Years
Position
Business and Market Development Expert
Sales Manager
Business and Market Development Expert
Business and Market Development Expert
Business and Market Development Expert
Business and Market Development Expert
Sales Manager
Business and Market Development Expert
Sales Manager
Business and Market Development Expert
Business and Market Development Expert
Sales Manager
Sales Manager
Sales Manager
Business and Market Development Expert
Sales Manager
Sales Manager
Business and Market Development Expert
Sales Manager
Business and Market Development Expert
Sales Manager
Business and Market Development Expert
Sales Manager
Sales Manager
Sales Manager
Business and Market Development Expert
Business and Market Development Expert
Sales Manager
Business and Market Development Expert
Business and Market Development Expert
Sales Manager
Sales Manager
Business and Market Development Expert
Business and Market Development Expert
Sales Manager
Business and Market Development Expert
Business and Market Development Expert
Sales Manager
Sales Manager
Business and Market Development Expert
Sales Manager
Business and Market Development Expert
Sales Manager
Sales Manager
Business and Market Development Expert
Business and Market Development Expert
Business and Market Development Expert
Business and Market Development Expert
Business and Market Development Expert
Sales Manager
Business and Market Development Expert
Sales Manager
Sales Manager
Business and Market Development Expert
Sales Manager
Sales Manager
Executive Manager
Sales Manager
Executive Manager
Sales Manager
Sales Manager
Education
Bachelor
Bachelor
Bachelor
Bachelor
Bachelor
Bachelor
Master
Bachelor
PhD
Master
Bachelor
Bachelor
Bachelor
Master
Bachelor
Master
Bachelor
Bachelor
Master
Bachelor
Bachelor
Bachelor
Bachelor
Master
Bachelor
PhD
Bachelor
PhD
Bachelor
Bachelor
Bachelor
Bachelor
Master
Bachelor
Master
Bachelor
PhD
Bachelor
Master
Bachelor
Bachelor
Bachelor
Bachelor
Master
Bachelor
Bachelor
Bachelor
Master
Bachelor
Bachelor
Master
Bachelor
Bachelor
Bachelor
Bachelor
Master
Master
Bachelor
Master
Bachelor
Master
Age
30-40
40-50
Table C2
The demographic features of retailers’ participants
DMU
1
2
3
4
Gender
Female
Male
Female
Female
Work Experience
< 5 Years
< 5 Years
< 5 Years
< 5 Years
Age
25-30
DMU
34
35
36
37
Gender
Female
Female
Male
Male
Work Experience
> 10 Years
< 5 Years
5-10 Years
> 10 Years
Age
30-45
504
DMU
5
6
7
8
9
10
11
12
13
14
15
16
17
18
19
20
21
22
23
24
25
26
27
28
29
30
31
32
33
Gender
Female
Female
Female
Female
Female
Male
Male
Female
Female
Male
Female
Male
Female
Male
Female
Female
Male
Female
Female
Male
Female
Female
Female
Female
Male
Male
Female
Male
Male
Work Experience
5-10 Years
< 5 Years
< 5 Years
< 5 Years
5-10 Years
5-10 Years
< 5 Years
> 10 Years
5-10 Years
< 5 Years
< 5 Years
> 10 Years
< 5 Years
> 10 Years
5-10 Years
5-10 Years
< 5 Years
5-10 Years
< 5 Years
5-10 Years
5-10 Years
5-10 Years
5-10 Years
< 5 Years
< 5 Years
< 5 Years
< 5 Years
5-10 Years
< 5 Years
Age
30-45
DMU
38
39
40
41
42
43
44
45
46
47
48
49
50
51
52
53
54
55
56
57
58
59
60
61
62
63
64
65
-
Gender
Female
Female
Male
Female
Male
Male
Male
Male
Male
Male
Male
Male
Male
Female
Male
Male
Male
Male
Male
Male
Male
Male
Male
Male
Male
Male
Male
Male
-
Work Experience
< 5 Years
5-10 Years
< 5 Years
< 5 Years
> 10 Years
> 10 Years
5-10 Years
> 10 Years
> 10 Years
> 10 Years
> 10 Years
> 10 Years
> 10 Years
5-10 Years
> 10 Years
> 10 Years
> 10 Years
> 10 Years
> 10 Years
5-10 Years
> 10 Years
> 10 Years
> 10 Years
> 10 Years
> 10 Years
> 10 Years
> 10 Years
> 10 Years
-
Age
45-65
-
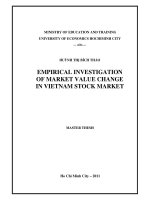
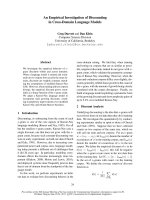

![chung - 2004 - selective mandatory auditor rotation and audit quality - an empirical investigation of auditor designation policy in korea [mar]](https://media.store123doc.com/images/document/2015_01/06/medium_bpj1420548143.jpg)