Optimizing government costs of supporting periodical publications through robust supply chain network redesign with the consideration of social welfare
Bạn đang xem bản rút gọn của tài liệu. Xem và tải ngay bản đầy đủ của tài liệu tại đây (437.34 KB, 14 trang )
Uncertain Supply Chain Management 8 (2020) 389–402
Contents lists available at GrowingScience
Uncertain Supply Chain Management
homepage: www.GrowingScience.com/uscm
Optimizing government costs of supporting periodical publications through robust supply chain
network redesign with the consideration of social welfare
Ali Asghar Emadabadia, Ebrahim Teimourya* and Fahimeh Pourmohammadia
a
School of Engineering, Department of Industrial Engineering, Iran University of Science and Technology, Tehran, Iran
CHRONICLE
Article history:
Received June 14, 2019
Received in revised format June
28, 2019
Accepted November 2 2019
Available online
November 2 2019
Keywords:
Social welfare
Periodical publication
Subsidy payment
Supply chain network redesign
Magazines’ subscription
ABSTRACT
In this paper, two policies are considered for supporting periodical publications by the
government: direct subsidy payment to these publications and opening new facilities which
could help with integration and reduce delivery costs. For this aim, a mixed-integer linear
mathematical model is presented that minimizes total costs while considering social welfare.
The robust programming approach developed by Bertsimas and Sim is used to cope with
uncertain parameters. In order to validate the model and investigate its applicability and
advantages, the magazines’ subscriptions in Tehran is selected as a case study. The output of
the model demonstrates that when social welfare is not considered, the risk-averted supply
chain will focus on low-cost areas of the chain, which are the central areas of Tehran. However,
when minimum social welfare is assured, the supply chain pays attention to all areas. Also, the
government should increase supply capacity by opening new facilities, and it should
differentiate between areas when paying direct subsidies.
© 2020 by the authors; license Growing Science, Canada.
1. Introduction
Social justice has been one of the critical issues in societies for centuries. Social justice means to pay
equal attention to all aspects of social life (economic, political, social, and cultural), and their main
values (wealth, power, and commitment, as well as knowledge) in terms of freedom of actions, equality
of opportunities, and conditional inequality in producing and distributing of main values (Rezaei,
2012). One of the issues that must be addressed in today's societies due to the expansion of urbanization
is social justice concerning urban public space. David Harvey defines social and spatial justice as a fair
allocation of public resources and facilities, in a way to make an awareness among people about their
rights, and their various demographic needs (Harvey, 2009; Zarrinpoor et al., 2018). Social justice is
succeeded through planning and implementation of social welfare programs. Due to the wide range of
activities and programs that take into account social welfare, it has been a controversial issue among
experts in different societies. Given the experience of developed countries, the supply of social services
must first be implemented by the government, and then followed with more targeted interventions
(Un.millennium.project, 2005). Therefore, it can be said that the government is the main provider of
social welfare, and social welfare programs are state-owned affairs (Salimi Far et al., 2015).
Government policies, including cost policies, tax policies, and laws and regulations could affect various
* Corresponding author
E-mail address: (E. Teimoury)
© 2020 by the authors; licensee Growing Science.
doi: 10.5267/j.uscm.2019.11.001
390
economic variables, particularly welfare and poverty (Un.millennium.project, 2005). In this regard,
various studies have focused on the role of the government in enhancing social welfare in recent years.
These studies can be divided into two categories: first, investigating the impact of macro policies such
as fiscal policies (Salimi Far et al., 2015. Rafeei et al., 2018) and Targeted subsidies (Piraee & Seif,
2010) on social welfare; and second, investigating the relationship between the role of the government
in the supply chain and social welfare. These studies are reviewed in Section 2. As newspapers and
other periodical publications can inform and educate at the same time, supporting magazine
publications can help to achieve social and political goals of social welfare. In this paper, two policies
are considered for supporting magazine publications by the government: direct subsidy payment and
opening new facilities which could help with integration and reduce delivery costs. The proposed model
is a mixed-integer linear mathematical model that reduces total costs while guaranteeing a minimum
level of social welfare. Also, a robust programming approach developed by Bertsimas and Sim (2004)
is employed to cope with uncertainties.
The remainder of the paper is organized as follows: The related literature is reviewed in the following
section. In Section 3, the Robust Programming approach developed by Bertsimas and Sim (2004) is
introduced. In Section 4, the problem is defined. Section 5 introduces the case study (magazine
subscriptions of Tehran). In section 6, the proposed model is solved, and the results, as well as the
sensitivity analysis, are presented. Finally, Section 7 is dedicated to conclusions and future research
suggestions.
2. Literature review
The most relevant work to this paper includes the study of Ovchinnikov and Raz (2011) that examined
the pricing problem of electric cars by considering the role of the government in designing incentive
mechanisms based on the newsvendor model. Also, Luo et al. (2014) have studied the supply chain of
electric cars; in their research, the government employs a discount incentive to encourage customers to
buy electric cars and consequently to reduce the air pollution. Xie and Ma (2016) have studied the
supply chain of color television recycling in China. They have introduced a duopoly market in which
the government plays the roles of both a subsidy provider and a wholesaler for the two firms in the
market. To the best of our knowledge, Mahmoudi and Rasti-barzoki (2018) are the first researchers to
model the contradiction between the government goals and the producers' goals using the Game Theory
approach. Their research shows that government policies affect producers’ behavior, competitive
markets, the emission of greenhouse gases, and imposing tariffs is the most effective way to minimize
environmental effects. Heydari et al. (2017) studied the coordination of the reverse and closed loop
supply chain components by considering the government’s role. The supply chain is intended to sustain
consumption by offering a discount or a direct fee in exchange. The primary purpose of the supply
chain network design is to determine the location and capacity of supply chain facilities as well as the
mode of transportation among them. Network design decisions are strategic decisions that have longterm effects on the supply chain’s performance (Ghavamifar, 2015). Strategic decisions are made for
three to five years in the future, during which many parameters such as demand, capacity, and costs of
the supply chain network could change, significantly. Furthermore, the parameters associated with the
design of the supply chain network include a large amount of data which are often accompanies by
rough estimates due to incorrect predictions, or poor measurements occurred during the modeling
process (Govindan et al., 2017; Wood & Gough, 2006). Researchers such as Mula et al. (2006) and
Klibi et al. (2010) have introduced different categories of data uncertainty. Mula et al. (2006) proposed
that the uncertainty of data can be due to 1) randomness, that comes from the random nature of
parameters or 2) epistemic uncertainty that comes from a lack of knowledge of the parameter values.
Klibi et al. (2010) proposed that data uncertainty can be due to normal business conditions or
disruptions. There are also different approaches to deal with uncertainties. Govindan et al. (2017)
introduced three categories for these approaches: random planning, fuzzy planning, and robust planning
(optimization). Zarinpour et al. (2018) presented a location-allocation hierarchy model to design a
A. A. Emadabadi et al. /Uncertain Supply Chain Management 8 (2020)
391
health service network. Cui et al. (2016) studied the design of a two-level supply chain in which a set
of suppliers serve a set of terminals with uncertain demand. In particular, they considered the possibility
of a transportation disruption that might stop a reliable supplier. Yahyaei and Bozorgi-Amiri (2018)
investigated the design of a disaster relief logistics network under uncertainty and disruptions. In the
paper above, an integer linear programming model is proposed. Kamalahmadi and MellatParast (2017)
studied the effectiveness of incorporating three types of redundancy practices (pre-positioning
inventory, backup suppliers, and protected suppliers) in a supply chain that faces both supply and
environmental risks. They demonstrated that regionalizing a supply chain is an effective way to reduce
the negative impacts of environmental disruptions. The design of hub transportation networks is a
strategic issue that has been explored by Rostami et al. (2018). Their model was designed for largescale problems based on the branch and bound framework of the Benders Decomposition technique.
Hasani et al. (2012) presented a general comprehensive model for the strategic design of a closed-loop
supply chain network under data uncertainty. The proposed model is multi-period, multi-product, and
multi-level. Also, it considers the uncertainties associated with demand quantities and purchase costs.
The integration of location and inventory problems in the supply chain is one of the standard topics in
this field that Dai et al. (2018) have addressed. They developed an optimization model with fuzzy
capacity and carbon emissions constraints for perishable products.
Reviewing the literature regarding supply chain management and social welfare reveals that the
existing studies have investigated the role of legislation or financial subsidies in social welfare.
However, to the best of our knowledge, no study considers the role of the government in designing the
supply chain network and strategic decisions. In this study, the government's goal is to minimize its
costs while providing social welfare through granting subsidies and direct interference in the supply
chain by establishing new facilities under uncertainty. Among the existing approaches for dealing with
uncertainty, a robust optimization method is employed in this study, and among the methods of
robustness, the method developed by Bertsimas and Sim (2004) is used for two reasons: First, it
provides a more realistic approach that can be adjusted to various levels of risk taking. Second, it retains
the linearity state of the model.
3. Bertsimas & Sim robust optimization approach (2004)
Consider the following linear optimization problem:
p 1 : max z c , x
(1)
subject to
AX b
(3)
l xu
(4)
Constraint (3) includes |I| constraints. Constraint number i ∈ I is showed as ai, x bi . The set of
coefficients 𝑎 , 𝑗 ∈ 𝐽 , which is subject to uncertainty, is named 𝐽 . The term 𝑎 , 𝑗 ∈ 𝐽 is based on a
symmetric distribution with the mean of 𝑎 . The 𝑎 takes values in 𝑎 − 𝑎 , 𝑎 +𝑎 . For every
constraint i∈ I, we introduce a parameter Γ , which is not necessarily an integer, and can take values in
the intervals 0, |𝐽 | . The linear model p(1) can be rewritten in p(2) using the approach provided by
Bertsimas & Sim.
p 2 : max z c, x
(5)
subject to
a x
j ij
j
(6)
zi Γi jJ pij bi
i
i
(7)
392
zi pij aˆij y j
i, j J i
(8)
yj xj yj
j
(9)
lj xj uj
j
(10)
pij 0
i, j J i
(11)
yj 0
j
(12)
zi 0
i
(13)
The role of the parameter Γ is to adjust the robustness of the proposed method against the level of
conservatism of the solution. Speaking intuitively, it is unlikely that all of the 𝑎 , 𝑗 ∈ 𝐽 will change.
Our goal is to be protected against all cases that up to ⌊Γ ⌋ of these coefficients are allowed to change,
and one coefficient 𝑎 changes by (Γ − ⌊Γ ⌋ 𝑎 .
4. Problem definition
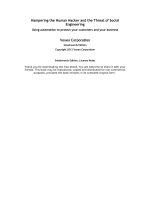
The supply chain studied in this paper has four levels: Suppliers, each produces a unique product and
receives the order’s information; Integrators who receive the orders’ information from the registration
system and package the orders; Distributors who receive the prepared packages from integrators and
deliver them to customers; and Customers who are the final receivers.
Material flow
Information flow
Integrator
Supplier
Distributor
Government
facility
Distributor
Integrator
Supplier
Customers
Supplier
Distributor
Customer
order
Fig. 1. The structure of the supply chain considered in this study
The flow of information and goods in the supply chain is as follows: the orders are registered by the
customer; the orders’ information is sent to the suppliers based on the goods being requested; the
suppliers send the customers’ orders to the integrators; the integrators wrap the packages and send them
to the distributors. The distributors, then, deliver the packages to the customers. Note that each customer
is allocated to one integrator. The government wants to intervene in this supply chain for assuring social
welfare goals. The social welfare of each region is measured by the demand that is met in that region.
The government has two means for providing social welfare: first, by granting subsidies to suppliers
(magazine publishers), which has an indirect effect on the supply chain; and second, by establishing
new facilities for integrating and distributing customers’ orders, which reduces total supply chain’s
costs and helps all members of the chain. This research aims to minimize the government’s costs
through a well-designed supply chain network. Also, we investigate the impacts of supply chain
network redesign on social welfare. For this aim, a mathematical model is presented in which both
types of interference by the government are considered (subsidy payment and facility establishment).
The supply chain’s profit is guaranteed through adding a constraint which considers a minimum level
A. A. Emadabadi et al. /Uncertain Supply Chain Management 8 (2020)
393
that must be met. Moreover, the level of social welfare is calculated based on the percentage of demand
quality that is met in each region. The mathematical model is presented after introducing the notations.
4.1. Sets and Indexes
Suppliers' index: s 1, 2, , S
Index related to the Integrator: o 1, 2,,O
Index related to the Distributors: d 1, 2,, D
Index related to the Customer: c 1, 2, ,C
Index related to the Period: t 1, 2, ,T
Index related to the Candidate integrator: ko 1, , Ko
Index related to the Candidate distributor: kd 1, , Kd
4.2. Parameters
Transportation Cost from Distributor s to Integrator o: cshsso
Transportation Cost from Supplier s to Candidate Integrator ko: cshsksko
Transportation Cost from Integrator o to Distributor d: cshood
Transportation Cost from Integrator o to Candidate Distributor kd: cshokokd
Transportation Cost from Candidate Integrator ko to Distributor d: cshkdkod
Transportation Cost from Candidate Integrator ko to Candidate Distributor kd: cshkkkokd
Transportation Cost from Distributor d to Customer c: cshddc
Transportation Cost from Candidate Distributor kd to Customer c: cshkckdc
Production Cost of Product s (per unit): csps
Cost of the vacant capacity of distributor d: cshbndd
Cost of the vacant capacity of candidate distributor kd: cshbnkd kd
Cost of the vacant capacity of integrator o: cshboo
Cost of the vacant capacity of candidate integrator ko: cshbkoko
Deficiency penalty coefficient (based on kg deficiency): bb
Amount of budget required to establish a candidate integrator ko: foko
Amount of budget required to establish a candidate distributor kd: fd kd
Big number: m
The capacity of Integrator o: capoo
The capacity of Candidate Integrator ko: capkoko
The capacity of Distributor d: capd d
The capacity of Candidate Distributor kd: capkdkd
The demand of Customer c, in Period t for Product s: destc
Minimum Profit of Supply Chain at Period t: had t
Subsidy Coefficient Allocated to Supplier s: zy s
Selling Price of Product s (per unit): ps
394
4.3. Decision Variables
Quantity sent from Supplier s to Integrator o, in Period t for Costumer c: xssotc
Quantity sent from Supplier s to Candidate Integrator ko, in Period t for Costumer c: xsk skotc
Quantity sent from Integrator o to Distributor d, in Period t for Customer c: xoodtc
Quantity sent from Integrator o to Candidate Distributor kd, in Period t for customer c: xokokdtc
Quantity sent from Candidate Integrator ko to Distributor d, in Period t for Costumer c: xkd kodtc
Quantity sent form Candidate Integrator ko to Candidate Distributor kd, in Period t for Customer c:
xkkkokdtc
Quantity sent from Distributor d to Costumer c, in Period t: xd dtc
Quantity sent from Candidate Distributor kd to Costumer c, in Period t: xkckdtc
Vacant Transportation Capacity from Integrator o, in Period t: xboot
Vacant Transportation Capacity from Distributor d, in Period t: xbd dt
Vacant Transportation Capacity from Candidate Integrator ko, in Period t: xbkokot
Vacant Transportation Capacity from Candidate Distributor kd, in Period t: xbkd kdt
Allocation Variables: Equals 1 when (Candidate) Integrator o (ko) is assigned to Customer c, otherwise
zero: a1oc a 2koc
Equals 1 if Candidate Integrator (ko) is opened, otherwise 0: zko
Equals 1 if Candidate Distributor (kd) is opened, otherwise 0: zzkd
Welfare Coefficient of each Region (Costumer) c, in Period t for Product s: zref stc
The subsidy paid by the government for Customer c in Period t for Product s (This subsicy is paied to
suppliers): yarstc
Gama (Level of protection against uncertainties in period t): gat
Variables of the Robust Model: zrt
Variables of the Robust Model: pr1sotc ,…, pr15kdt
Variables of the Robust Model: y1skotc ,..., y14kdt
4.4. Mathematical model
The mathematical model is as follows based on the problem definition and the model components:
min GO foko zko fd kd zzkd yarstc
ko
kd
s
(14)
c
subject to
cshs
c
o
s
so
xssotc pr1sotc cshsk sko xsk skotc
c
o
s
c
ko
s
pr 2 skotc cshood xoodtc pr 3odtc
c
ko
s
c
d
o
c
d
o
cshokokd xokokdtc pr 4okdtc cshkd kod xkd kodtc
c
kd
o
c
kd
o
c
d
ko
pr5kodtc cshkkkokd * xkkkokdtc pr 6kokdtc
c
d
ko
c
kd ko
c
kd ko
(15)
A. A. Emadabadi et al. /Uncertain Supply Chain Management 8 (2020)
395
cshd dc xd dtc pr 7 dtc cshkckdc xkckdtc pr8kdtc
c
d
c
d
c
kd
c
kd
ps csps xssotc pr 9 sotc ps csps xsk skotc
c
o
s
c
o
s
c
ko
s
pr10skotc xboot cshbo pr12ot xbd dt cshbnd pr13dt
c
ko
s
o
o
d
d
xbkokot cshbo xbkd kdt cshbnd pr14kot pr15kdt
ko
kd
ko
kd
yarstc gat zrt had t
s
t
c
xs
xoodtc xokokdtc
sotc
s
d
xsk
skotc
s
o, t, c
(16)
kd
xkd kodtc xkkkokdtc
d
ko, t , c
(17)
kd
xd dtc xoodtc xkd kodtc
o
d , t, c
(18)
ko
xkckdtc xokokdtc xkkkokdtc
o
kd , t, c
(19)
ko
s, o, t , c xssotc m a1oc
(20)
s, ko, t , c xsk skotc m a 2koc
(21)
a1
1
(22)
a 2
1
(23)
c
oc
o
c
koc
ko
a1
oc
o
a 2koc 1
xs
c
sotc
skotc
odtc
o
xok
c
xboot capoo o, t
(25)
xbkokot capkoko zko ko, t
(26)
s
xo
c
(24)
s
xsk
c
c
ko
o
xkd kodtc xbd dt capd d
c
okdtc
d , t
(27)
ko
xkkkokdtc xbkd kdt capkd kd zzkd
c
ko
destc zref stc xssotc xsk skotc destc
o
ko
s, t , c
kd
(28)
(29)
396
yarstc zys xssotc ps
s, t , c
(30)
o
s, o, t, c
pr1sotc zrt cshs1so y1sotc
s, ko, t , c
pr 2 skotc zrt cshsk1sko y 2 skotc
o, d , t, c
pr 3odtc zrt csho1od y 3odtc
(31)
(32)
(33)
pr 4okdtc zrt cshok1okd y 4okdtc
o, kd , t , c
(34)
pr5kodtc zrt cshkd 1kod y 5kodtc
ko, d , t , c
(35)
ko, kd , t , c
pr 6kokdtc zrt cshkk1kokd y 6kokdtc
(36)
d , t , c pr 7dtc zrt cshd 1dc y 7dtc
(37)
kd , t, c pr8kdtc zrt cshkc1kdc y8kdtc
(38)
s, o, t, c pr 9 sotc zrt csp1s y 9 sotc
(39)
s, ko, t, c pr10skotc zrt csp1s y10skotc
(40)
o, t
pr12ot zrt cshbo1 y11ot
(41)
pr13dt zrt cshbnd 1 y12 dt
d , t
(42)
pr14 kot zrt cshbo1 y13kot
ko, t
(43)
kd , t
pr15kdt zrt cshbnd 1 y14 kdt
s, o, t , c
y1sotc xssotc y1sotc
s, ko, t, c
y 2 skotc xsk skotc y 2 skotc
o, d , t, c
y 3odtc xoodtc y 3odtc
(44)
(45)
(46)
(47)
y 4okdtc xokokdtc y 4okdtc
o, kd , t , c
(48)
y 5kodtc xkd kodtc y 5kodtc
ko, d , t, c
(49)
y 6kokdtc xkkkokdtc y 6kokdtc
y 7dtc xd dtc y 7dtc
y8kdtc xkckdtc y8kdtc
y 9 sotc xssotc y 9 sotc
ko, kd , t , c
d , t, c
(50)
(51)
kd , t, c
(52)
s, o, t , c
(53)
s, ko, t , c y10skotc xsk skotc y10skotc
(54)
A. A. Emadabadi et al. /Uncertain Supply Chain Management 8 (2020)
397
y11ot xboot y11ot
o, t
(55)
y12 dt xbd dt y12dt
d , t
(56)
y13kot xbkokot y13kot
ko, t
(57)
y14 kdt xbkd kdt y14 kdt
kd , t
(58)
a1, a 2, z , zz 0,1
(59)
xsk skotc , xoodtc , xbkd kdt , xokokdtc , xkd kodtc , xkkkokdtc , zrt ,
All pr , All y, xd dtc , xkckdtc , xbstc , xboot , xbd dt , xbkokot , xssotc 0
In this model, Eq. (14) shows the objective function that represents the total government costs,
including subsidy payment and the establishment of new facilities. Eq. (15) to Eq. (59) state the
constraints of the model. Eq. (15) shows the supply chain’s profit which is calculated based on the
transportation costs, net revenue of selling products, the cost of vacant capacity, and the value of the
subsidy, as well as the cost of robustness. Constraints (16) to (19) are balance equations for
transportation quantities. Constraints (20) to (24) allocate customers to integrators. Note that each
customer should be allocated to one integrator. Constraints (25) to (28) determine the capacity of new
facilities. Constraint (29) guarantee that all customers’ demand is met. Constraint (30) demonstrates
the maximum subsidy that can be granted to each supplier. Constraints (31) to (58) are the robust
constraints of the model. Constraint (59) demonstrates the type of variables and their positivity.
5. Case study
In order to validate the proposed model and show its applicability and advantages, the magazines’
subscriptions of Tehran have been selected as a case study. The case study includes four types of
magazines (daily, weekly, bi-weekly, and monthly). To cope with Tehran’s diverse and wide urban
space, its 22 regions are divided into 119 zones. For each region, the demand quantity is considered
0.1% of the population, which is distributed equally among different zones. The number of customers
in each zone is specified in Table 1.
Table 1
demand value in each region
Region No.
1
2
3
4
5
6
7
8
9
10
11
12
13
14
15
16
17
18
19
20
21
22
Population
487,508
701,303
330,649
919,001
858,346
251,384
312,194
425,197
174,239
327,115
307,940
241,831
248,952
515,795
641,279
268,406
273,231
419,882
261,027
365,259
186,821
176,347
Number of zones
10
9
6
9
7
6
5
3
4
3
4
6
4
6
6
6
3
5
4
6
3
4
Number of customers per zone
49
78
55
102
123
42
62
142
44
109
77
40
62
86
107
45
91
84
65
61
62
44
398
Customers can order 150 daily newspapers, 24 weekly magazines, and 12 bi-weekly magazines, as well
as six monthly magazines during four periods. There are two distributors and two integrators, which
are placed in the eastern and the western part of the city, and new facilities can be opened if necessary.
Therefore, two locations in eastern and central parts of Tehran are considered as candidate locations to
open new integrators and distributors (meaning a total of four candidates). The rest of the information
is presented in Tables 2, 3, and 4.
Table 2
Transportation costs from suppliers to integrators
Supplier
Candidate integrator
Candidate 1 (east)
Candidate 2 (center)
Candidate 1 (east)
Candidate 2 (center)
Candidate 1 (east)
Candidate 2 (center)
Candidate 1 (east)
Candidate 2 (center)
Daily group
Weekly group
Bi-weekly group
Monthly group
Path 1
112
75
112
75
121
82
105
82
Path 2
125
87
125
87
130
95
115
95
Integrator
East
West
East
West
East
West
East
West
Path 2
145
95
132
107
132
115
172
145
Path 1
127
77
115
90
115
98
152
127
Table 3
Transportations costs from integrators to the distributors
Integrator
Integrator’s capacity
East
140000
West
120000
East
140000
West
120000
Candidate 1 (east)
100000
Candidate 2
(center)
110000
Candidate 1 (east)
100000
Candidate 2
(center)
110000
Distributor
East
West
East
West
Candidate 1 (east)
Candidate 2 (center)
Candidate 1 (east)
Candidate 2 (center)
Candidate 1 (east)
Candidate 2 (center)
Candidate 1 (east)
Candidate 2 (center)
East
West
East
West
Distributor’s capacity
200000
150000
200000
150000
100000
100000
100000
100000
100000
100000
100000
100000
200000
150000
200000
150000
Path 1
57
100
100
62
100
87
88
37
50
35
40
25
100
75
75
57
Path 2
50
90
100
72
50
75
100
55
35
55
60
37
75
75
75
75
Table 4
The minimum level of social welfare considered for each period
Period 1
70%
Period 2
80%
Period 3
90%
Period 4
95%
6. The results
The presented model is solved with GAMS software using the CPLEX solver for two scenarios. In the
first scenario (Scenario I), the constraint which guarantees minimum welfare is disabled. As a result,
no facilities are opened, and no subsidy is granted. Therefore, the total government costs are equal to
zero. In the second scenario (Scenario II), the constraint above is abled. As a result, the government
costs are equal to 1.75 billion Rials, which includes the costs of establishing an integrator in the eastern
part of Tehran and a distributer in the western part. In this case, the granted subsidy also equals zero.
6.1. Results
Table 5 represents the difference between total magazines quantities that are allocated to select zones
in Scenarios I and II (in percentage). Since the social welfare of each region is measured by total
demand quantity that is met in that region, Table 5 also shows the difference of provided social welfare
in Scenarios I and II. As it is shown in Table 5, the level of social welfare in Scenario II is always
higher than Scenario I, achieved by establishing new facilities. Note that while establishing a new
facility has a significant effect on the quantity of daily newspapers, its effect on monthly newspapers
A. A. Emadabadi et al. /Uncertain Supply Chain Management 8 (2020)
399
is almost zero. Another point in Table 5 is the integer behavior of the weekly and bi-weekly magazines;
that is, the weekly magazines are not allocated to the zone, or all of their volumes are allocated. We
also investigated whether considering social welfare would affect the allocation of customers to
facilities. The results are provided in Table 6. As it is shown in Table 6, the allocation of customers to
integrators is different (more than 65%) in Scenarios I and II. Since in Scenario II, new facilities are
opened, allocating a customer to a new facility might be less costly for the chain.
Table 5
The difference between total quantities allocated to zones in Scenarios I and II (percentage)
Weekly magazines
Bi-weekly magazines
Monthly magazines
Period
Newspapers
Period
1
Period
2
Period
3
Period
4
Period
1
Period
2
Period
3
Period
4
Period
1
Period
2
Period
3
Period
4
Period
1
Period
2
Period
3
Period
4
1
5
8
15
19
24
33
36
39
43
53
59
65
69
75
81
86
92
-70
-100
-42
0
-27
-100
0
0
0
-100
0
0
-20
0
0
0
-100
-40
-80
-100
-51
0
-40
-100
0
0
-22
-100
-8
0
-34
0
-17
-18
-41
-50
-90
-100
-91
0
-43
-100
0
0
0
-100
-12
0
-37
0
-21
-22
0
-14
-95
-100
-50
0
-34
-100
0
0
0
-100
0
0
-28
0
-9
0
0
-46
-100
0
0
0
0
0
0
0
0
0
0
0
0
0
0
0
0
0
-100
-100
0
0
0
0
0
0
0
0
0
0
0
0
0
0
0
0
-100
-100
0
0
0
0
0
0
0
0
0
0
0
0
0
0
0
0
-100
-100
0
0
0
0
0
0
0
0
0
-100
0
0
0
0
0
0
-70
0
0
0
0
0
0
0
0
0
0
0
0
0
0
0
-100
-100
-80
-100
0
0
0
0
0
0
0
-100
0
-100
0
0
0
0
0
0
-90
-100
0
0
0
-100
0
0
0
0
0
-100
-100
0
0
0
0
-100
-95
-100
0
0
0
-100
0
0
0
0
0
-100
0
0
0
0
0
-100
-100
0
0
0
0
0
0
0
0
0
0
0
0
0
0
0
0
0
-100
-100
0
0
0
0
0
0
0
0
0
0
0
0
0
0
0
0
-100
-100
0
0
0
0
0
0
0
0
0
0
0
0
0
0
0
0
-100
-100
0
0
0
0
0
0
0
0
0
0
0
0
0
0
0
0
zone
73
74
75
76
77
78
79
80
81
82
83
84
85
86
87
88
89
90
91
92
93
94
95
96
SCN I
o2
o1
o2
o2
o1
o1
o1
o1
o2
o1
o1
o2
o2
o1
o1
o2
o1
o2
o2
o1
o1
o1
o1
o1
Table 6
The allocation of customers to facilities in Scenarios I and II
zone
1
2
3
4
5
6
7
8
9
10
11
12
13
14
15
16
17
18
19
20
21
22
23
24
SCN I
o1
o2
o1
o1
o1
o2
o1
o1
o1
o1
o1
o1
o2
o1
o1
o2
o1
o1
o1
o1
o1
o1
o2
o1
SCN II
ko1
o2
ko1
ko1
o2
ko1
o2
o2
o2
o2
o2
o2
o2
ko1
ko1
ko1
ko1
o2
o2
o2
o2
o2
ko1
ko1
zone
25
26
27
28
29
30
31
32
33
34
35
36
37
38
39
40
41
42
43
44
45
46
47
48
SCN I
o1
o1
o1
o1
o1
o1
o1
o1
o2
o2
o2
o2
o2
o2
o2
o1
o2
o2
o1
o1
o1
o2
o1
o1
SCN II
ko1
o2
o2
ko1
o2
o2
o2
o2
o2
o2
o2
o2
o2
o2
o2
ko1
o2
o2
o1
ko1
ko1
ko1
ko1
ko1
zone
49
50
51
52
53
54
55
56
57
58
59
60
61
62
63
64
65
66
67
68
69
70
71
72
SCN I
o1
o1
o1
o1
o2
o1
o1
o1
o1
o1
o1
o1
o1
o1
o1
o1
o1
o1
o1
o1
o2
o1
o2
o1
SCN II
ko1
ko1
ko1
ko1
ko1
ko1
o1
o1
ko1
ko1
ko1
ko1
ko1
ko1
o2
ko1
o2
ko1
o2
o2
o1
ko1
o1
ko1
SCN II
o1
o1
o2
ko1
o1
ko1
o1
ko1
ko1
ko1
o1
o1
o1
o1
o1
o1
o1
o1
o1
o1
o1
o1
o1
o1
zone
97
98
99
100
101
102
103
104
105
106
107
108
109
110
111
112
113
114
115
116
117
118
119
SCN I
o1
o1
o1
o1
o2
o1
o1
o2
o1
o1
o1
o1
o1
o1
o2
o1
o1
o2
o2
o2
o2
o1
o1
SCN II
o1
o1
o1
o1
o1
ko1
ko1
o1
o1
o1
o1
o1
o1
o1
o1
o1
o1
o1
o1
o1
o1
o1
o1
6.2. Sensitivity analysis
Since the level of protection against uncertainties depends on the value of parameter Gama (Ga) in
Bertsimas & Sim’s method, here we investigated the effects in Scenarios I and II. Note that this
parameter might affect granted subsidies, the establishment of new facilities, and supply chain’s costs.
Table 7 represents the social welfare level in Scenario II for selected zones (1 to 10) when Gama is
increased from 0 to 40. The increase in the value of Gama has changed the level of social welfare about
0.5% in Scenario II (on average) and about 3% in Scenario I, meaning that the value of parameter Gama
400
has a negligible effect on average social welfare in both scenarios. However, it should be noted that
when the value of Gama is low, the supply chain concentrates on central parts of Tehran. However,
when Gama increases, the supply chain also pays attention to non-central parts of the city. The results
are represented in Fig. 2 and 3 for Scenarios I and II, respectively. As it is shown, the level of social
welfare in non-central parts in Scenario II is better than Scenario I, because in Scenario I social welfare
is not guaranteed and since central parts have lower delivery costs, the supply chain pays more attention
to them. In Scenario II, the supply chain must pay attention to all regions. Therefore, it takes full
advantage of the capacity of new facilities by concentrating on non-central parts of the city. Also, the
costs of opening new facilities are partly compensated by changing allocations.
Table 7
The level of social welfare for different values of Gama in Scenario II
Zones/The value of Gama
1
2
3
4
5
6
7
8
9
10
gama=10
0
84%
84%
84%
85%
84%
84%
84%
84%
84%
89%
5
89%
85%
92%
85%
85%
97%
94%
92%
86%
99%
gama=20
10
84%
92%
87%
99%
85%
97%
98%
89%
86%
91%
20
85%
86%
91%
93%
96%
96%
97%
93%
93%
93%
30
85%
95%
92%
94%
97%
97%
100%
87%
87%
87%
40
89%
92%
93%
100%
97%
97%
99%
87%
87%
93%
gama=50
Fig. 2. The level of social welfare in different zones for Scenario I
gama=10
gama=20
gama=40
Fig. 3. The level of social welfare in different zones for Scenario II
7. Conclusion
As mentioned before, providing social welfare is one of the main government's goals, and is closely
linked to how the government policies are applied. As newspapers and other periodical publications
can inform and educate at the same time, supporting magazines’ publications can help us provide
cultural and political aspects of social welfare. In this paper, two policies have been considered for
supporting magazine publications by the government: direct subsidy payment to the publications and
opening new facilities which could help with integration and reduce delivery costs and help all the
members of the supply chain of magazine publications. The proposed model is a mixed-integer linear
mathematical model that reduces total costs while guaranteeing a minimum level of social welfare. In
order to deal with uncertainties, the robust programming approach developed by Bertsimas and Sim
A. A. Emadabadi et al. /Uncertain Supply Chain Management 8 (2020)
401
has been employed. The magazines’ subscriptions in Tehran was selected as a case study to show the
applicability and advantages of the proposed model. The social welfare of each region has been
measured by the demand that is met in that region. The results show that when a minimum level for
social welfare is guaranteed, the government established two new facilities for integrating and
distributing customers’ orders. However, no subsidy is granted to publications. In other words, direct
intervention in the supply chain is more preferable than granting subsidies. Moreover, the results have
shown that when social welfare is not considered, the supply chain concentrates on central parts of
Tehran, as these regions have lower delivery costs. Considering social welfare also changes the
allocation of customers to facilities. In addition, the sensitivity analysis has shown that the value of
parameter Gama, which determines the level of protection against uncertainties, has a negligible effect
on average social welfare in both scenarios. The main finding of this study is that the government must
increase the capacity for responding to demands by establishing new facilities. Also, it should try to
balance delivery costs in different regions by granting different subsidies to regions. Investigating how
these subsidies must be allocated to regions can be considered as a path for future research. Applying
other approaches for dealing with uncertainties is also suggested.
References
Bertsimas, D., & Sim, M. (2004). The price of robustness. Operations research, 52(1), 35-53.
Cui, J., Zhao, M., Li, X., Parsafard, M., & An, S. (2016). Reliable design of an integrated supply chain
with expedited shipments under disruption risks. Transportation Research Part E: Logistics and
Transportation Review, 95, 143-163 .
Dai, Z., Aqlan, F., Zheng, X., & Gao, K. (2018). A location-inventory supply chain network model
using two heuristic algorithms for perishable products with fuzzy constraints. Computers &
Industrial Engineering, 119, 338-352.
Ghavamifar, A. (2015). A reliable competitive supply chain network design under risk of disruption
and uncertainty, Case study: Isaco Company. MS’s Thesis in Industrial Engineering, Industrial
Engineering Department, Iran University of Science and Technology.
Govindan, K., Fattahi, M., & Keyvanshokooh, E. (2017). Supply chain network design under
uncertainty: A comprehensive review and future research directions. European Journal of
Operational Research, 263(1), 108-141.
Harvey, D. (2010). Social justice and the city (Vol. 1). University of Georgia Press.
Hasani, A., Zegordi, S. H., & Nikbakhsh, E. (2012). Robust closed-loop supply chain network design
for perishable goods in agile manufacturing under uncertainty. International Journal of Production
Research, 50(16), 4649-4669.
Heydari, J., Govindan, K., & Jafari, A. (2017). Reverse and closed loop supply chain coordination by
considering government role. Transportation Research Part D: Transport and Environment, 52,
379-398.
Kamalahmadi, M., & Parast, M. M. (2017). An assessment of supply chain disruption mitigation
strategies. International Journal of Production Economics, 184, 210-230.
Klibi, W., Martel, A., & Guitouni, A. (2010). The design of robust value-creating supply chain
networks: a critical review. European Journal of Operational Research, 203(2), 283-293 .
Luo, C., Leng, M., Huang, J., & Liang, L. (2014). Supply chain analysis under a price-discount
incentive scheme for electric vehicles. European Journal of Operational Research, 235(1), 329333 .
Mahmoudi, R., & Rasti-Barzoki, M. (2018). Sustainable supply chains under government intervention
with a real-world case study: An evolutionary game theoretic approach. Computers & Industrial
Engineering, 116, 130-143.
Mula, J., Poler, R., & Garcia, J. P. (2006). MRP with flexible constraints: A fuzzy mathematical
programming approach. Fuzzy Sets and Systems, 157(1), 74-97.
Ovchinnikov, A., & Raz, G. (2011). A News-Vendor Model with Pricing for Public Interest Goods.
Available at SSRN 1763803 .
402
Piraee, Kh., Seif, S. B. (2010). Impact of subsidizing targeting on social welfare in Iran. Tax Research,
9(1), 61–82.
Rafeei, M. and Sayadi, M. (2018). Investigating the relation between government fiscal policy and
social welfare with emphasis on Amartya Sen Index (Bound ARDL Testing Approach). Quarterly
Journal of Economic Growth and Development Research, 8(32), 151–168.
Rezaei, M.H. (2012). Study of social justice in development plans from a new perspective. Journal of
Islamic Management, 20(2), 33–54.
Rostami, B., Kämmerling, N., Buchheim, C., & Clausen, U. (2018). Reliable single allocation hub
location problem under hub breakdowns. Computers & Operations Research, 96, 15-29.
Salimifar, M., Davodi, A., & Arabi, A. (2014). Effect of government budget composition on welfare
indicators in Iran.
Un.Millennium. Project (2005). Investing in development, a practical plan to achieve the millennium
development goals. New York.
Wood, G., & Gough, I. (2006). A comparative welfare regime approach to global social policy. World
development, 34(10), 1696-1712.
Xie, L., & Ma, J. (2016). Study the complexity and control of the recycling-supply chain of China's
color TVs market based on the government subsidy. Communications in Nonlinear Science and
Numerical Simulation, 38, 102-116 .
Yahyaei, M., & Bozorgi-Amiri, A. (2018). Robust reliable humanitarian relief network design: an
integration of shelter and supply facility location. Annals of Operations Research, 1-20.
Zarrinpoor, N., Fallahnezhad, M. S., & Pishvaee, M. S. (2018). The design of a reliable and robust
hierarchical health service network using an accelerated Benders decomposition algorithm.
European Journal of Operational Research, 265(3), 1013-1032.
© 2020 by the authors; licensee Growing Science, Canada. This is an open access article
distributed under the terms and conditions of the Creative Commons Attribution (CC-BY)
license ( />