Exploiting transcriptome data for the development and characterization of gene-based SSR markers related to cold tolerance in oil palm (Elaeis guineensis)
Bạn đang xem bản rút gọn của tài liệu. Xem và tải ngay bản đầy đủ của tài liệu tại đây (1.44 MB, 13 trang )
Xiao et al. BMC Plant Biology 2014, 14:384
/>
RESEARCH ARTICLE
Open Access
Exploiting transcriptome data for the
development and characterization of gene-based
SSR markers related to cold tolerance in oil palm
(Elaeis guineensis)
Yong Xiao1*†, Lixia Zhou1†, Wei Xia1, Annaliese S Mason3, Yaodong Yang1, Zilong Ma2 and Ming Peng2
Abstract
Background: The oil palm (Elaeis guineensis, 2n = 32) has the highest oil yield of any crop species, as well as
comprising the richest dietary source of provitamin A. For the tropical species, the best mean growth temperature
is about 27°C, with a minimal growth temperature of 15°C. Hence, the plantation area is limited into the geographical
ranges of 10°N to 10°S. Enhancing cold tolerance capability will increase the total cultivation area and subsequently oil
productivity of this tropical species. Developing molecular markers related to cold tolerance would be helpful for
molecular breeding of cold tolerant Elaeis guineensis.
Results: In total, 5791 gene-based SSRs were identified in 51,452 expressed sequences from Elaeis guineensis
transcriptome data: approximately one SSR was detected per 10 expressed sequences. Of these 5791 gene-based
SSRs, 916 were derived from expressed sequences up- or down-regulated at least two-fold in response to cold stress.
A total of 182 polymorphic markers were developed and characterized from 442 primer pairs flanking these
cold-responsive SSR repeats. The polymorphic information content (PIC) of these polymorphic SSR markers across 24
lines of Elaeis guineensis varied from 0.08 to 0.65 (mean = 0.31 ± 0.12). Using in-silico mapping, 137 (75.3%) of the 182
polymorphic SSR markers were located onto the 16 Elaeis guineensis chromosomes. Total coverage of 473 Mbp was
achieved, with an average physical distance of 3.4 Mbp between adjacent markers (range 96 bp - 20.8 Mbp).
Meanwhile, Comparative analysis of transcriptome under cold stress revealed that one ICE1 putative ortholog, five CBF
putative orthologs, 19 NAC transcription factors and four cold-induced orhologs were up-regulated at least two fold in
response to cold stress. Interestingly, 5′ untranslated region of both Unigene21287 (ICE1) and CL2628.Contig1 (NAC)
both contained an SSR markers.
Conclusions: In the present study, a series of SSR markers were developed based on sequences differentially expressed
in response to cold stress. These EST-SSR markers would be particularly useful for gene mapping and population structure
analysis in Elaeis guineensis. Meanwhile, the EST-SSR loci were inducible expressed in response to low temperature, which
may have potential application in identifying trait-associated markers in oil palm in the future.
* Correspondence:
†
Equal contributors
1
Hainan Key Laboratory of Tropical Oil Crops Biology/Coconut Research
Institute, Chinese Academy of Tropical Agricultural Sciences, Wenchang,
Hainan 571339, P.R. China
Full list of author information is available at the end of the article
© 2014 Xiao et al.; licensee BioMed Central. This is an Open Access article distributed under the terms of the Creative
Commons Attribution License ( which permits unrestricted use, distribution, and
reproduction in any medium, provided the original work is properly credited. The Creative Commons Public Domain
Dedication waiver ( applies to the data made available in this article,
unless otherwise stated.
Xiao et al. BMC Plant Biology 2014, 14:384
/>
Background
Oil palm (Elaeis guineensis Jacq., 2n = 32), belonging to the
genus Elaeis in the monocotyledonous family Arecaceae
(Palmaceae), is an important tropical oil crop. The genus
Elaeis consists of two different species, Elaeis guineensis
(African oil palm) and Elaeis oleifera (American oil palm) [1].
Elaeis guineensis is currently commercially cultivated for
palm oil production in the tropics, particularly in Indonesia
and Malaysia. Some efforts have been made to introduce
African oil palm into subtropical regions in regional trial
plantation, including in the Hainan province located in the
southern China. However, winter temperatures in these
regions are generally lower than 20°C (and can even
low than 10°C), which resulted in slowing of flower
bud differentiation and fruit development, subsequently
severely affecting the oil palm fruit productivity. Hence,
enhancing cold tolerance in this tropical species is a
primary breeding goal for producing African oil palm
genotypes suitable for these subtropical regions.
Microsatellites (simple sequence repeats, SSRs) are
tandem DNA repeats of 1–6 nucleotides per unit, and
are mostly found in non-coding regions of eukaryotic
genomes. Due to low selection pressure in non-coding
regions, non-coding SSRs are often highly polymorphic as
well as co-dominant and simple to detect. Non-coding
SSRs have been widely used for the analysis of genetic
diversity and population structure, construction of linkage
maps, and detection of quantitative trait loci [2-5].
However, SSRs located in coding and untranslated regions
(transcribed SSRs) can be efficient functional markers in
genic regions [6]. SSR variation in coding regions can
lead directly to functional protein changes, while SSRs
occurring in 5′ untranslated regions (5′-UTRs) can affect
transcription and translation, and SSRs in 3′-UTRs can
affect splicing [7]. Thus, SSRs from transcribed sequences
may be directly related to phenotypic variation, and hence
functional trait markers.
Molecular markers as AFLPs, RAPDs and AFLPs have
been widely used for analyzing genetic diversity and
population structure, identification of trait-associated
markers and genotype characterization in Elaeis guineensis
[8-11]. Recently, there is increasing interest in the use of
transcriptome sequencing to understand the molecular
mechanisms which govern important agronomic traits in
Elaeis guineensis [12]. Thus, a large number of expressed
sequence tags (ESTs) were released. Obviously, this sequence
information comprises a valuable resource for identifying
gene-associated SSR markers in Elaeis guineensis. Previously,
EST-SSRs in Elaeis guineensis based on this released data
have been provided by three studies. Of these three studies,
Low et al. [13] reported identification of 648 EST-SSRs
associated with tissue culture, while two other studies
reported EST-SSRs which were not associated with
particular agronomic traits [14,15].
Page 2 of 13
Here, we reported our work on development and
characterization of EST-SSR derived from expressed
sequences up- or down-regulated at least two-fold in
response to cold stress. Our study comprises five
parts: (1) Characterization of the frequency and distribution
of putative SSRs obtained from Elaeis guineensis transcriptome data, (2) analysis of polymorphism in the EST-SSR
markers derived from expressed sequences up- or
down-regulated at least two-fold in response to cold
stress, (3) in-silico mapping of these polymorphic markers,
(4) assessment of physical distance between these
polymorphic markers and candidate genes associated
with cold stress, and (5) exploring the population
structure of the 192 oil palm lines using the SSR
markers linked to candidate genes associated with cold
stress. These SSR markers developed in the study will be
useful for establishment of genetic mapping as well as
population genetic studies, and will provide candidate
markers for genetic improvement of cold stress in Elaeis
guineensis.
Methods
Plant materials
The oil palm varieties, dura (the thick-shelled African
oil palm) and pisifera (the thin-shelled African oil palm),
were introduced from Malaysia to China in the 1990s
and subsequently mutual crossed to produce a large
number of F1 hybrids. The plantation trial showed that a
few F1 hybrids can adapt to winter low temperature of
Hainan province located on Southern China. The
selected F1 hybrid seedlings were treated as follows: F1
hybrid seedlings were grown in nurseries. Twenty one
one-year-old F1 hybrid plants germinated in the same
week and grown in the same nursery were selected for
subsequently cold treatment. Prior to cold treatment, the
hybrid seedling were placed in a growth chamber at 26°C
for one day. Subsequently, spear leaf samples were
collected from three individual replicates (as controls) for
RNA extraction. The remaining six groups of three
seedling replicates were kept at 8°C for 0.5 hours, 1 hour,
4 hours, 8 hours, 1 day and 7 days respectively before
sampling. Spear leaves were sampled from control and
cold-treated seedlings and immediately frozen in liquid
nitrogen. Total RNA was extracted from the control and
cold treatment samples based on the MRIP method
described by Xiao et al. [16]. mRNA mixtures from the
control sample and the cold-treatment sample were
prepared in equal proportions for Illumina sequencing.
Moreover, 192 oil palm lines were collected from
Hainan province located in Southern China (44) and
from Malaysia (148). Among these oil palm individuals
collected from Malaysia, 34 were produced by selfpollination of the selected F1 plants, showing adaptation
to the low winter temperatures in the Hainan province.
Xiao et al. BMC Plant Biology 2014, 14:384
/>
The other 114 oil palm individuals were recently introduced into China, of which 29 were also produced from
the self-pollination of F1 plants between dura and pisifera
and for which the pedigrees of the remaining lines
were unknown. DNA samples were prepared from young
leaves of the 192 oil palm trees using the mini-CTAB
methold [17].
Illumina sequencing and de novo assembly
Purified mRNA isolated from the control sample and
from the cold-treatment mixture were separately
fragmented with divalent cations under increased
temperature. These short fragments were taken as
templates to synthesize the first-strand cDNA using
hexamer primers and superscript™III (Invitrogen™,
Carlsbad, CA, USA). Second-strand cDNA was then
synthesized in a solution containing buffer, dNTP,
RNaseH and DNA polymerase I and subsequently
purified using a QiaQuick PCR extraction kit (Qiagen). EB
buffer was used to resolve these short fragments for end
reparation and poly (A) addition. The sequence adaptors
were linked to two ends of short cDNA sequences and
suitably sized cDNA fragments were selected out for PCR
amplification based on the agrose gel electrophoresis
results. Finally, the library established was sequenced
using an Illumina Hiseq™ 2000. The paired-end library
was developed according to the paired-End sample
Preparation Kit protocol (Illumina, USA). The transcriptome
short reads were de novo assembled software following
the protocol documented by Grabherr et al. [18].
Functional annotation of transcriptome data
The transcript sequences were aligned with the NR database at a E-value threshold of 10−5 (E-value < 0.00001).
Subsequently, the transcript sequences were aligned by
BLASTX to protein database, including Swiss-Prot, KEGG
and COG. If alignment results of different databases
conflicted, BLAST results from NR rather than Swiss-prot
were given precedence. The WEGO software was applied
to perform GO functional classification of the transcriptome [19]. The result of the GO annotation were also used
for KEGG and COG analysis.
Calculation of gene differential expression
RPKM (Reads per kb per Million reads) was used to
calculate gene expression level. The statistical significance
of the differential expression was determined according to
the method documented by Audic and Claverie [20].
When thousands of hypothesis tests are performed, the
p-value suitable for a single test is not sufficient to
guarantee a low rate of false discovery. Thus, an FDR
(False Discovery Rate) control method was applied
using multiple hypothesis testing to correct the p-value
results [21]. Subsequently, the RPKM ratio was used to
Page 3 of 13
compute the fold change of gene expression for each pair
of samples simultaneously. The differentially expressed
genes were selected using a threshold of FDR ≤ 0.001 and
an absolute value of log2 ratio ≥ 1 [22].
Identification of putative SSRs and primer design
The software Msatfinder was used to identify putative
SSRs based on the cut-off criteria of 12, 8, 5, 5, 5 and 5
repeats for mono-, di-, tri-, tetra-, penta- and hexaucleotide motifs, respectively (informatics.
org/ftp/pub/msatfinder/). Subsequently, primers flanking
SSRs were designed using Primer 3 software [23]. Using
the software, a total of 3952 primer pairs were designed for
these SSR sequences (information listed in Additional file 1).
In order to evaluate polymorphisms in SSRs associated
with response to cold stress, primers flanking SSRs in
expressed sequences that were induced or repressed by low
temperatures were used to amplify DNA isolated from the
24 F2 oil palm plants.
PCR amplification and electrophoresis
PCR amplification were performed in 10-μl reaction
mixtures containing 100 ng genomic DNA, 10 × PCR
buffer, 25 mMMgCl2, 1 U TaqDNA polymerase (TaKaRa,
China), 0.5 μM of each primer and 0.2 mM dNTP mix,
with the following program: denaturation for 5 minutes
at 94°C, 35 cycles of 94°C for 30 seconds, 30 seconds at
54.7°C and 30 seconds at 72°C for elongation, with a
final extension of 7 minutes at 72°C. PCR products
were electrophoretically separated on 1% polyacrylamide
denaturing gels and visualized by silver staining. Product
sizes were determined by comparison to a 100 bp DNA
ladder.
The diversity analysis of the designed markers and
chromosome location
The polymorphic information content (PIC value) was
calculated using a PIC calculator (.
uk/~kempsj/pic.html) [24]. Using the BLAST algorithm,
the chromosomal locations of the polymorphic markers
were determined as follows: firstly, the expressed sequences,
used to design primers for the polymorphic marker,
were BLASTed against the oil palm contig sequences
(BioprojectID: 192219: PRJNA192219 Elaeis guineensis);
secondly, the chromosomal location of the matched
contigs was further determined according to the released
genome information of Singh et al. [25].
Population structure
Bayesian clustering was applied to analyze the population
structure of 192 oil palm lines using the software
STRUCTURE [26]. Ten independent calculations were
performed for K value (K set from 1 to 11). The length of
burn-in time and replication number were both set to
Xiao et al. BMC Plant Biology 2014, 14:384
/>
100,000 in each run. The maximum likelihood method
was applied to assign every oil palm line to a cluster, and
the cut-off probability was set to 0.6. The most probable
number of true populations (K) was identified by plotting
△K values of K from 1 to 10 in replicate runs for each K
and corresponded to the peak of the △K graph.
Results
Frequency and distribution of gene-based SSRs in the oil
palm transcriptomes in response to cold stress
In our research (data unpublished), a total of 51,452
transcripts with an average length of 703 bp were
obtained from oil palm transcriptomes in response to
cold stress. These transcriptome data is available in
TSA (Transcriptome Shotgun Assembly) database of
NCBI website (Submission Number: GBSV00000000).
Msatfinder identified 5,791 SSR loci located in 5034
transcript sequences (Additional file 1). Nearly one
transcript sequence in 10 (5034/51452) contained at least
one SSR locus (Table 1). Among these microsatellites
identified based on our cut-off criteria, tri-nucleotide
motif types were the most abundant (2821, 48.71%).
Mono-nucleotide motifs comprised the next largest
proportion (1741, 30.06%), followed by di-nucleotide
motifs (1124, 19.41%), with a minority of tetra-nucleotide
(73, 1.26%), penta-nucleotide (21, 0.36%) and hexa-nucleotide
motifs (11, 0.2%).
Of the 51,452 transcripts, 10,973 were up-regulated or
down-regulated at least two-fold in response to cold
stress. The 10,973 transcripts contained 916 identified
SSR loci. Identical distribution with respect to microsatellite
motif type was observed between all SSR loci identified in
the 51,452 transcripts and the 916 SSR loci associated with
response to cold stress (Figure 1). Of the SSR loci associated
with response to cold stress, tri-nucleotide motif types were
the most abundant (42.58%), followed by mono-nucleotide
(34.61%) and di-nucleotide (20.52%) motif types.
Comparative analysis was performed to ascertain the
position within the transcript sequences of both the total
SSRs and the cold-response SSRs (Figure 2). Total SSRs
and cold-response SSRs both occurred mainly in UTR
regions. Of the total SSRs, 1570 mono- repeats (accounting
for 90. 02% of the total mono-nucleotides), 1020 di-repeats
(accounting for 90.75% of the total di-nucleotides), 2033 trirepeats (accounting for 79.26% of the total tri-nucleotides),
63 tetra-repeats (accounting for 91.3% of the total
tri-nucleotides), 21 penta-repeats (accounting for 100% of
the total penta-nucleotides), and 11 hexa- repeats
(accounting for 100% of the total hexa-nucleotides)
occurred in un-translated regions (UTRs) of expressed
transcripts. It should be noted that a largest portion of
tri-nucleotide repeats (532, 20.74%) occurred in coding
sequences (CDSs) of expressed transcripts. Compared to
the total SSRs, the cold-response SSRs showed basically
Page 4 of 13
identical distribution within expressed transcripts. However,
in cold-response SSRs, a comparative larger proportion of
tetra-nucleotide (2, 25%) motif SSRs were located in coding
sequences (CDSs) of expressed transcripts.
Kyoto Encyclopedia of Genes and Genomes (KEGG)
pathways of SSR-containing transcripts in response to
cold stress
Annotation of SSR-containing transcripts differentially
regulated in response to cold stress showed that these
transcripts were unevenly distributed between the different
KEGG pathways (Figure 3). Of the 159 SSR-containing
transcripts differentially regulated in response to cold stress
which could be assigned at least one KEGG pathway,
the largest proportion of SSR-containing transcripts
(58, 36.48%) were classified into the Metabolic pathways
(Pathway ID: ko01100). Plant hormone signal transduction
(Pathway ID: ko04075) comprised the next largest proportion (9, 5.66%), followed by plant-pathogen interactions (8,
5.03%; Pathway ID: ko03013), oxidative phosphorylation
(6, 3.77%; Pathway ID: ko00190), cutin, suberine and wax
biosynthesis (6, 3.77%;Pathway ID: ko00073), and ABC
transporters (6, 3.77%;Pathway: ko02010), with single
transcripts related to botin metabolism, fatty acid
metabolism, inositol phosphate metabolism, peroxisome,
proteasome and RNA polymerase.
Polymorphism in cold-response-associated SSR markers
and chromosome positions in Elaeis guineensis
A total of 442 primer pairs were successfully designed
from the flanking sequences of cold-response-associated
mono- to hexanucleotide SSR repeats. Primer pairs could
not be designed for the remaining SSRs, mainly due to
difficulties in obtaining sufficient flanking sequences from
either side of the identified microsatellites. Subsequently, the
442 pairs of primer sequences flanking 132 mono-nucleotide
repeats, 74 di-nucleotide repeats, 219 tri-nucleotide repeats,
7 tetra-nucleotide repeats, 7 penta-nucleotide repeats and 3
hexa-nucleotide repeats were synthesized to test the extent
of polymorphism in the cold-response SSRs across the 24 oil
palm lines. In 278 (62.9%) of cases, PCR products could be
amplified from genomic DNA. The remaining 164 primer
pairs were excluded from further analysis due to lack of PCR
products or due to weak amplification. Ninety-one primer
pairs amplified monomorphic bands in all lines. In total, 182
(41.2%) polymorphic microsatellite markers were identified
(Figure 4), including 50 mono-nucleotide repeats, 22
di-nucleotide repeats, 102 tri-nucleotide repeats, 4
tetra-nucleotide repeats, 2 penta-nucleotide repeats, and 1
hexa-nucleotide repeat. The percentage of polymorphic
mono-, di-, tri- and tetra-nucleotide repeats was 38%,
30%, 47% and 57%, respectively. From the 182 loci, 402
microsatellite alleles were identified with an average
of 2.2 alleles per locus. Of the 402 alleles, 105 were from
Xiao et al. BMC Plant Biology 2014, 14:384
/>
Page 5 of 13
Table 1 Characteristics of 5791 SSRs identified based on transcriptome data of Elaeis guineensis
Motifs
Repeat number
Total
Average repeat
number
Average repeat
length(bp)
310
1700
15.19
15.19
0
12
41
15.85
15.85
0
0
460
9.26
18.52
5
6
7
8
9
10
11
12
13
14
15
16
17
18
>18
a/t
-
-
-
-
-
-
-
398
272
232
193
147
83
65
c/g
-
-
-
-
-
-
-
10
8
5
0
2
4
tc/ga
-
-
-
137
131
128
61
3
0
0
0
0
0
ct/ag
-
-
-
205
152
127
59
1
0
0
0
0
0
0
1
545
12.79
25.58
at
-
-
-
14
10
5
5
0
0
0
0
0
0
0
0
34
9.03
18.06
ta
-
-
-
7
3
8
1
0
0
0
0
0
0
0
0
19
9.16
18.32
ac/gt
-
-
-
3
5
4
2
2
0
0
0
0
0
0
0
16
9.69
19.38
ca/tg
-
-
-
15
16
6
7
3
0
0
0
0
0
0
0
47
9.21
18.42
cg
-
-
-
0
2
0
0
0
0
0
0
0
0
0
0
2
9
18
gc
-
-
-
0
1
0
0
0
0
0
0
0
0
0
0
1
9
18
gag/ctc
191
95
42
2
0
0
1
0
0
0
0
0
0
0
0
331
5.58
16.74
tgc/gca
73
38
34
0
0
0
0
0
0
0
0
0
0
0
0
145
5.73
17.19
cag/ctg
63
44
39
2
0
0
0
0
0
0
0
0
0
0
0
148
5.86
17.58
cgg/ccg
127
66
34
7
0
0
0
0
0
0
0
0
0
0
0
234
9.22
27.66
aag/ctt
74
36
22
1
0
0
0
0
0
0
0
0
0
0
0
133
5.62
16.86
ggt/acc
36
21
7
1
0
0
0
0
0
0
0
0
0
0
0
65
5.58
16.74
ggc/gcc
120
59
35
3
0
0
0
0
0
0
0
0
0
0
0
217
5.66
16.98
gat/atc
25
17
3
0
0
0
0
0
0
0
0
0
0
0
0
45
5.51
16.53
tct/aga
73
43
34
2
1
0
0
0
0
0
0
0
0
0
1
154
5.91
17.73
tga/tca
58
18
9
2
0
0
0
0
0
0
0
0
0
0
0
87
5.48
16.44
gac/gtc
19
6
4
1
0
0
0
0
1
0
0
0
0
0
0
31
5.81
17.43
tcc/gga
151
69
39
3
0
0
0
1
1
0
0
0
0
0
0
264
5.62
16.86
gaa/ttc
86
27
19
4
0
0
0
0
0
0
0
0
0
0
0
136
5.57
16.71
cct/agg
122
69
38
5
0
0
0
0
0
0
0
0
0
0
0
234
5.69
17.07
att/aat
10
10
2
1
0
0
0
0
0
0
0
0
0
0
0
23
5.74
17.22
aac/gtt
7
4
0
2
0
0
0
0
0
0
0
0
0
0
0
13
5.77
17.31
cgc/gcg
61
39
22
3
0
1
0
0
0
0
0
0
0
0
0
126
5.77
17.31
ttg/caa
12
11
2
0
0
0
0
0
0
0
0
0
0
0
0
25
5.6
16.8
agc/gct
40
23
31
2
0
0
0
0
0
0
0
0
0
0
0
96
5.95
17.85
atg/cat
24
10
10
1
0
0
0
0
0
0
0
0
0
0
0
45
5.73
17.19
tta/taa
13
5
2
0
0
0
0
0
0
0
0
0
0
0
0
20
5.45
16.35
cac/gtg
52
9
15
3
0
0
0
0
0
0
0
0
0
0
0
79
5.61
16.83
tgg/cca
61
25
13
3
0
0
0
0
0
0
0
0
0
0
0
102
5.59
16.77
ata/tat
8
1
3
0
0
0
0
0
0
0
0
0
0
0
0
12
5.58
16.74
aca/tgt
7
3
2
1
0
0
0
0
0
0
0
0
0
0
0
13
5.77
17.31
cga/tcg
13
7
3
2
0
0
0
0
0
0
0
0
0
0
0
25
5.76
17.28
cgt/acg
7
4
0
0
1
0
0
0
0
0
0
0
0
0
0
12
5.67
17.01
tag
1
0
0
0
0
0
0
0
0
0
0
0
0
0
0
1
5
15
gta/tac
2
1
0
1
0
0
0
0
0
0
0
0
0
0
0
4
6
18
agt
1
0
0
0
0
0
0
0
0
0
0
0
0
0
0
1
5
15
tetra-
60
12
0
0
0
1
0
0
0
0
0
0
0
0
0
73
5.23
20.92
Xiao et al. BMC Plant Biology 2014, 14:384
/>
Page 6 of 13
Table 1 Characteristics of 5791 SSRs identified based on transcriptome data of Elaeis guineensis (Continued)
penta
20
1
0
0
0
0
0
0
0
0
0
0
0
0
0
21
5.05
25.25
Hexa-
8
1
0
0
1
0
1
0
0
0
0
0
0
0
0
11
6
36
Total
1625
774
464
433
323
280
137
418
282
237
193
149
87
65
324
5791
9.21
16.86
mononucleotide motif loci with an average of 2 alleles per
locus; 46 were from dinucleotide motif loci with an
average of 2 alleles per locus, and 227 were from trinucleotide motif loci with an average of 2.2 alleles per locus.
Across the 182 polymorphic markers, PIC values ranged
from 0.08 to 0.65 (mean = 0.31 ± 0.12), suggesting the
cold-response-associated SSR markers developed had
moderate levels of polymorphism (Figure 5). The mean
PICs of the 50 mono-nucleotide, 22 di-nucleotide and
102 tri-nucleotide repeats were 0.30, 0.31 and 0.31,
respectively. Detailed information for the 182 polymorphic
markers is listed in Additional file 1.
Based on in-silico mapping, 137 (75.3%) of the 182 developed gene-based SSR markers could be placed on
Elaeis guineensis chromosomes (Figure 6). The number
of SSR markers per chromosome varied from 3
(chromosome 9) to 20 (chromosome 5), with an average
of 8.52 SSR markers per chromosome across the 16
chromosomes. The physical distance between adjacent
SSR markers ranged from 96 bp to 20.8 Mbp, with a
total coverage length of 473.4 Mbp and an average physical length of 3.5 Mbp. Detailed information for the
physical distance between adjacent markers had been
listed in Additional file 2.
Identificaiton of candidate genes in response to cold
stress and physical distance between these candidate
genes and the SSR markers
The comparative analysis of transcriptomes under cold
stress revealed that 10,973 transcripts were up-regulated
or down-regulated at least two-fold in response to cold
stress. Among these transcripts in response to cold stress,
some were functional annotated as cold-resistance
genes documented in the previous researches. Based
on annotation results, eight CBF orthologs, two ICE1
orthologs, three SIZ1 orthologs, two ZAT10 orthologs,
one HOS1 orthlogs and one MYB15 orthologs were
detected, comprising some crucial transcription factors
involved in the CBF-mediated cold signal transduction.
Of these, six transcripts (35.3%) were up-regulated at
least two fold, including Unigene21287 (ICE1, 4.49 fold),
CL4558.Contig1 (CBF, 6.14 fold), CL4552.Contig2 (CBF,
11.08 fold), CL83.Contig2 (CBF, 5.44 fold), CL83.Contig3 (CBF, 7.1 fold) and Unigene 26961 (CBF, 11.9
fold). Interestingly, 5′ untranslated region of candidate
Unigene21287 (ICE1, 4.49 fold) contained a SSR loci
(Unigene21287_SSR) with comparatively high diversity
extent (PIC value: 0.619) across the 24 lines of Elaeis
guineensis. Meanwhile, based on in-silico mapping,
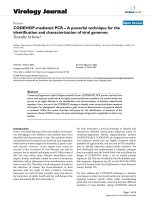
Figure 1 The distribution of the motif repeats of mono to hexa-nucleotide microsatellites based on all transcript sequences and
transcript sequences differentially expressed in response to cold treatment.
Xiao et al. BMC Plant Biology 2014, 14:384
/>
Page 7 of 13
Figure 2 The percentage distribution of mono-, di-, tri-, tetra-, penta- and hexa-nucleotide repeat SSRs between UTRs and exon regions for total and cold-response-associated SSRs in African oil palm.
three of the other five candidate genes involved in
CBF-mediated pathway were located on genome scaffolds
containing SSR markers. The physical distance between
the three candidates and adjacent SSR markers were listed
in Additional file 3.
In addition, some transcripts were classified as NAC
transcription factors according to COG annotation
results, of which some members have been documented
to be related to cold tolerance in some species. In Elaeis
guineensis, 19 (41.3%) of 46 NAC transcription factors
were up-regulated at least two fold under cold stress, with
fold changes varying from 2.16 fold (Unigene7160) to
10.32 fold (Unigene22381). Of them, the 5′ untranslated
region of CL2628.Contig1 (NAC, up-regulated 2.82 fold) also
contained one SSR maker with moderate polymorphism
(PIC value: 0.275) across the 24 lines of Elaeis guineensis.
Fourteen of other 18 candidate NAC transcription
factors were also located on genome scaffolds containing SSR markers. The physical distances between the
15 candidates and the adjacent SSR markers are listed in
Additional file 4.
Meanwhile, 36 transcripts were functionally classified
as putative cold-induced putative orthologs based on
annotation results due to previous documentation of
cold-inducible expression in other species. However,
in Elaeis guineensis, only four (10.8%) of 37 transcripts
were up-regulated at least two fold in response to low
temperature, including CL3095.Contig2 (cold induced
protein, 3.67 fold), CL384.Contig1 (cold induced protein,
2.89 fold), CL2052.Contig2 (cold induced protein, 3.75
Figure 3 KEGG annotation of SSR-containing transcripts differentially regulated in response to cold stress in oil palm.
Xiao et al. BMC Plant Biology 2014, 14:384
/>
Page 8 of 13
Figure 4 PCR products and polymorphic characteristics of four SSR markers across 24 Elaeis guineensis accessions.
fold) and CL559.Contig2 (cold induced protein, 2.54). of
the four candidates, three were located on genome
scaffolds containing SSR markers. The physical distances
between the three candidates and their adjacent SSR
markers are listed in Additional file 5.
Exploring population structure of 192 oil palm lines using
ten SSR markers linked to candidate genes
Ten SSR markers (three closely linked with candidate
genes and seven less closely linked to candidate
genes, including Unigene21287_SSR, Unigene25696_SSR,
Figure 5 The distribution of PIC values for mono-, di-, tri-, tetra, penta- and hexa-nucleotide motif SSR loci identified in African oil palm.
Xiao et al. BMC Plant Biology 2014, 14:384
/>
Page 9 of 13
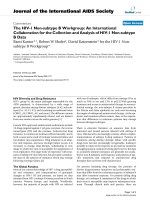
Figure 6 Chromosomal locations of the gene-based SSRs developed based on transcriptome sequences differentially expressed in
response to cold stress. Chromosomes consist of a series of assembled scaffolds. Every scaffold is represented by a column. The length of the
column corresponds to the length of the scaffold: 1 centimeter represents 10000 kb. The left number “KE……” represents the scaffold ID number
from the Elaeis guineensis genome in the NCBI database. The number in brackets indicates the observed heterozygosity of the SSR markers.
CL2628_Contig1_SSR, Unigene19403_SSR, Unigene30741_
SSR, CL14_Contig1_SSR, Unigene3598_SSR, CL2490_Contig3_SSR, Unigene32985_SSR, and CL4880_Contig2_SSR)
were used to genotype 192 individuals of oil palm collected
from Malaysia and China. Of these, 34 lines of oil
palm were selected from the F2 population derived
from self-pollination of the selected F1 hybrid that
showed adaptation to the low winter temperatures in
the Hainan province and 44 were collected from the
Hainan province located in Southern China. Other oil
palm individuals were recently collected from Malaysia,
which did not undergo selection for cold tolerance. The
method of Evanno et al. [27] was applied to identify the
most likely number of ‘true populations’ in the 192 lines
of oil palm, two genetic groups were inferred (Figure 7).
Structure analysis showed that there is partial separation
between these oil palm lines with some cold adaptation
and those without. Almost all F2 individuals resulting from
self-pollination of the selected F1 plant were exclusively
clustered into the red subgroup (Figure 7). However, oil
Xiao et al. BMC Plant Biology 2014, 14:384
/>
Page 10 of 13
Figure 7 Population structure of 192 oil palm lines collected from the Hainan province located in Southern China and from Malaysia.
palm lines collected from Hainan province were found in
both subpopulaitons: approximately half (26) were grouped
into the red subpopulation. These oil palm lines may be
also derived from Southeast Asia and introduced into china
in the early twentieth century. Due to lack of adaptation to
the climate environment in Hainan province, almost all of
the oil palm lines introduced showed low productivity.
Subsequently, most of these oil palm lines were cut
down and the remaining oil palm lines were used
only as aforestation trees. Therefore, there was not
extensive artificial selection on the oil palm lines collected
from Hainan province, and hence only half can been
clustered together with the F2 individuals. The majority of
the oil palm lines collected from Malaysia were grouped
into the yellow subgroup (Figure 7). The oil palm lines
were recently introduced into China from Malaysia,
and did not undergo the selection for adaptation to
the Hainan climatic environment. Therefore, these oil
palm lines could grouped into another subpopulation
relative to the F2 individuals. In brief, these markers
linked to candidate genes can partial distinguish between
oil palm adapted or non-adapted to winter low temperatures in the Hainan province, suggesting that these markers
may be related to cold stress.
Discussions
Elaeis guineensis has the highest oil yield of any crop
species, as well as comprising the richest dietary source
of provitamin A [28]. Currently, this crop can only be
cultivated in tropical countries. Some effort has been
made to introduce Elaeis guineensis into subtropical
regions worldwide, for example the Yunnan and Hainan
provinces in China. However, low winter temperature in
these subtropical regions has a serious effect on the flesh
fruit productivity of Elaeis guineensis. In order to facilitate
improvement of cold tolerance in this important crop
species, we aimed to develop molecular markers associated
with cold tolerance in Elaeis guineensis. In this study, we
developed 182 polymorphic EST-SSR markers based on
sequences differentially expressed in response to cold
stress. PIC values of these EST-SSR markers ranged
from 0.08 to 0.65 (mean = 0.31 ± 0.12). Meanwhile,
based on in-silico mapping, the EST-SSR markers were
located on each of the 16 Elaeis guineensis chromosomes.
Subsequently, the physical distances between the developed EST-SSR markers and putative genes related to
cold stress were also calculated. Therefore, the EST-SSR
markers developed based on sequences differentially
expressed in response to cold stress have potential
application for association analysis for molecular breeding
of cold tolerance in Elaeis guineensis.
In previous studies, EST-SSRs were generally identified
based on sequencing of Elaeis guineensis cDNA libraries.
Compared to Illumina sequencing, sequencing of cDNA
libraries produces very limited expressed sequence data.
Tranbarger et al. [14] identified 465 EST-SSRs from 6,103
non-redundant ESTs derived from cDNA libraries of
developing vegetative and reproductive tissues in Elaeis
guineensis. Of these, only 289 primer pairs flanking the
EST-SSRs could be designed. Low et al. [13] identified 648
non-redundant EST-SSRs from 9584 expressed sequence
tags in a total of 12 standard cDNA libraries, representing
three main developmental stages in oil palm tissue culture.
Ting et al. [15] identified 722 SSRs from 10258 unique
sequences. In this study, we identified a total of 5,791
SSRs, a considerably greater number than identified in
previous studies. Meanwhile, 3952 primer pairs were
designed for these SSR sequences, which is far more
than the number of SSR pairs developed in the previous
studies in Elaeis guineensis [13-15]. Of these primer pairs,
we focused on 442 primer pairs corresponding to the
expressed sequences which were induced or repressed at
least two-fold under cold stress.
Based on cut-off criteria of 12, 8, 5, 5, and 5 repeats
for mono-, di-, tri-, tetra-, penta- and hexa-nucleotide
SSRs, tri-nucleotides were the most abundant EST-SSR
markers. This result is identical to previous findings of
tri-nucleotide motifs as the most frequent EST-SSR
motif in Cocos nucifera [29]. However, the most abundant
motifs are dinucleotides in some other species [30], which
may be a result of loose cut-off criteria to identify SSRs. In
order to compare the overall density of SSRs in the Elaeis
guineensis transcriptome with that reported in other plant
species, we re-computed SSRs using the same cut-off
criteria as Cardle et al. [31], with 7, 5, 4 and 4 repeats for
di-, tri-, tetra- and penta-, respectively. A total of 4794
SSRs were identified with one SSR per 7.53 kb. The SSR
density in Elaeis guineensis is similar to that in coconut
Xiao et al. BMC Plant Biology 2014, 14:384
/>
palm (one SSR per 7.59 kb) and soybean (one SSR per
7.4 kb) [29,32], but higher than in maize (one per 8.1 kb),
tomato (one per 11.1 kb), Arabidopsis (one per 13.83 kb),
poplar (one per 14 kb) and cotton (one per 20 kb).
Moreover, higher SSR density than oil palm was found in
castor bean (one SSR per 1.77 kb) [33,34].
Some studies have showed that SSRs are mainly located
in the UTR regions of expressed sequences, especially in
the case of mono-, di-, tetra-, penta-, and hexa-nucleotide
motif SSRs [35]. Obviously, if the SSR (for mono-, di-,
tetra-, penta-, and hexa-nucleotide motifs) is located in the
coding region, mutation in the SSR sequence will cause
variation in the coding frame and lead to detrimental mutations. However, a high proportion of tri-nucleotide motifs
were found within the coding regions of coconut and castor
bean, which may be due to the fact that copy number
mutations in tri-nucleotide motifs cannot lead to frame
shift mutation. We also observed a high proportion of
mono- (97.09%), di- (97.05%), tetra- (91.3%), penta- (100%)
and hexa-nucleotide (100%) SSRs in UTR regions in this
study. However, for tri-nucleotide motif SSRs, only 20.7%
were located in coding regions, much less than in coconut
palm (53.6%) [29] and castor bean (76.1%) [35]. The low
frequency of SSRs occurring in coding regions may indicate
that coding regions are less variable and prone to mutation
in Elaeis guineensis.
Identification of putative SSRs based on available
expressed sequences from the NCBI databases has
previously been carried out. However, the extent of
polymorphism in these putative SSRs was not described in
previous research [13-15]. In our study, 3952 primer pairs
flanking the corresponding expressed sequences were
designed based on cold-responsive transcripts of Elaeis
guineensis. Of the 3952 primer pairs, 442 primer pairs
flanking the expressed sequences differentially regulated
in response to cold stress were used to genotype 24
lines of Elaeis guineensis. A total of 182 SSR loci
were polymorphic and their PIC value ranged from
0.08 to 0.65, with an average of 0.31. The cold-responsive
SSR markers developed in our study seem to have
relatively similar levels of diversity to EST-SSRs reported
in other species [35,36]. However, the diversity of these
SSR markers was lower than previously documented
genomic SSRs in other palm species [37]. This can be
explained by the fact that SSRs obtained from expressed
sequences undergo selection pressure against mutation
due to their presence in functional genes.
Although a large number of studies have reported the
development of EST-SSR markers in various plant
species, chromosomal locations of these developed
SSR markers is generally lacking, which is disadvantageous
for subsequent studies of linkage disequilibrium, association
analysis and molecular breeding. In our study, 137 (75.3%)
of the 182 markers developed were located onto the 16
Page 11 of 13
chromosomes of Elaeis guineensis based on in-silico
mapping, which will provide basic information for
subsequent genetics and breeding studies. Moreover,
plant response to low temperature is a very complex
biological process, which requires integration of a
large number of genes functioning together to defend
against cold stress. The CBF cascade has been documented
to have an important role in cold acclimation in diverse
plant species. The CBF cascade involves a series of
transcription factors, including ICE1, HOS1, MYB15,
SIZ1 and ZAT10, transmitting cold signals and subsequently
initiating immediate responses to cold stress [38]. In the
present study, eight CBF orthologs, two ICE1 orthologs,
three SIZ1 orthologs, two ZAT10 orthologs, one HOS1
orthlogs and one MYB15 orthologs were also detected in
Elaeis guineensis transcriptomes in response to low
temperatures. Just like in other species, putative ICE1 and
CBF orthologs were also strongly induced when Elaeis
guineensis suffered cold stress. Two SSR makers were
closely linked separately with an ICE1 candidate
(Unigene21287, up-regulated 4.49 fold) and an CBF
candidate (CL83.Contig3, 7.1 fold) respectively: one
SSR marker was located in 5′ untranslated region of
the ICE1 candidate and another SSR markers was only
12.6 kb from the CBF candidate. The two candidate SSR
makers should have immediate application for molecular
breeding of cold tolerance in Elaeis guineensis. Meanwhile,
much evidence had also revealed that NAC genes also play
important roles in abiotic and biotic stress responses [39].
In the study, 46 putative NAC orthologs were predicted,
of which 19 were up-regulated at least two fold.
Among NAC candidates induced by low temperature,
one SSR markers seemed to be closely linked to two
NAC candidates (CL4107.Contig2 and CL2628.Contig1):
located in the 5′ untranslated region of the NAC candidate
(CL4107.Contig2) and only have 79.8 kb physical distance
away from CBF candidate. This SSR marker closely linked
to candidate genes induced by cold stress can be further
validated for subsequently association analysis in Elaeis
guineensis.
In addition, ten SSR markers (three closely linked with
candidate genes and seven less closely linked to candidate
genes) were used to analyze the population structure of
192 oil palm lines. Interesting, these markers could partial
distinguish between oil palm lines that had historically
undergone adaptation to climatic environment of Hainan
province and those that had not. However, the structure
results did not conclusively confirm the relationship
between these markers and cold stress. In future, phenotypic data for the cold tolerance of the 192 oil palm lines
will be investigated. Association analysis between phenotypic variations for cold stress and the SSR markers linked
to candidate genes could further validate if these markers
are predictive of cold tolerance in oil palm.
Xiao et al. BMC Plant Biology 2014, 14:384
/>
Conclusions
Gene-based SSRs can directly influence phenotype and
also be in close proximity to genetic variation in coding
or regulatory regions corresponding to traits of interest.
In the study, a total of 5,791 SSR loci were identified
based transcriptome data of Elaeis guineensis separately
from a control (control growth condition) RNA sample
and a mixed RNA sample with cold treatment. Of these
5791 gene-based SSRs, 916 were derived from expressed
sequences up- or down-regulated at least two-fold in
response to cold stress. Based on the flanking sequence
of the cold-reponsive SSRs, 442 primer pairs were
designed and subsequently used to genotype 24 lines of
Elaeis guineensis. The PCR amplification products of
182 primer pairs showed polymorphism between the 24
lines. These polymorphic markers were subsequently
used for analysis of genetic diversity and population
structure, identification of trait-associated markers and
genotype characterization in Elaeis guineensis. Meanwhile,
137 of these SSR markers were mapped onto the 16 different chromosomes of Elaeis guineensis using in-silico
mapping, which will provide basic information for location
of important agronomic traits and the analysis of linkage
disequibrium in Elaeis guineensis. Moreover, differential
expression analysis showed that one ICE1 putative
ortholog, five CBF putative orthologs, 19 NAC transcription
factors and four cold-induced orhologs were up-regulated
at least two fold in response to cold stress. Among
these, 22 candidates could be in-silico mapped on to
genome scaffold containing SSR markers, of which
three SSR markers were closely linked with an ICE1
candidate, a CBF candidate and two NAC candidates.
These three candidate SSR makers would have immediate
application for molecular breeding of cold tolerance in
Elaeis guineensis.
Additional files
Additional file 1: The information of 3952 SSR primers, including
primer sequence, Tm value, fragment size, motif, repeat number,
Tm (annealing temperature), fold change, na*(Observed allele
number), PIC (Polymorphic Information content) and genebank
accessions.
Additional file 2: Physical distance between adjacent markers
located on the same chromosome.
Additional file 3: Physical distance between markers and candidate
genes involving in CBF-mediated pathway.
Additional file 4: Physical distance between SSR markers and
candidate genes of NAC family.
Additional file 5: Physical distance between SSR markers and
candidate genes involving in cold inducible and cold shock.
Competing interests
The authors declare they have no competing interests.
Page 12 of 13
Authors’ contributions
YX did the DNA extraction and subsequently PCR amplification, participated
in the design of the study, performed the statistical analysis and drafted the
manuscript. LZ did the major experimental work including the extraction of
DNA, PCR amplification and electrophoresis experiments, participated in the
statistical analysis and drafted the manuscript. WX participated in data
analysis and drafted the manuscript. ASM critically revised the manuscript. YY
contributed to and adivised on DNA amplification experiments with some
advices and participated in the design of the study. MP contributed to and
adivised on DNA amplification experiments with some advices and ZM
participated in the design of the study. All authors read and approved the
final manuscript.
Acknowledgements
This work was supported by the Natural Science Foundation of China
(No. 31101179), The Major Technology Project of Hainan (ZDZX2013023-1), an
Australia Research Council Discovery Early Career Researcher Award
(DE120100668), and the Natural Science Foundation of Hainan Province (313059).
Author details
1
Hainan Key Laboratory of Tropical Oil Crops Biology/Coconut Research
Institute, Chinese Academy of Tropical Agricultural Sciences, Wenchang,
Hainan 571339, P.R. China. 2Institute of Tropical Bioscience and
Biotechnology, Chinese Academy of Tropical Agricultural Science, Haikou,
Hainan 571101, P. R. China. 3School of Agriculture and Food Sciences and
Centre for Integrative Legume Research, the University of Queensland, 4072
Brisbane, Australia.
Received: 8 August 2014 Accepted: 12 December 2014
Published: 19 December 2014
References
1. Corley RHV, Tinker PB: The Oil Palm. 4th edition. Oxford: UK Blackwell
Science; 2003.
2. Qiu D, Morgan C, Shi J, Long Y, Liu J, Li R, Zhuang X, Wang Y, Tan X,
Dietrich E, Weihmann T, Everett C, Vanstraelen S, Beckett P, Fraser F, Trick M,
Barnes S, Wilmer J, Schmidt R, Li J, Li D, Meng J, Bancroft I: A comparative
linkage map of oilseed rape and its use for QTL analysis of seed oil and
erucic acid content. Theor Appl Genet 2006, 114:67–80.
3. Xia W, Xiao Y, Liu Z, Luo Y, Mason AS, Fan H, Yang Y, Zhao S, Peng M:
Development of gene-based simple sequence repeat markers for
association analysis in Cocos nucifera. Mol Breeding 2014, 34:525–535.
4. Xiao Y, Chen L, Zou J, Tian E, Xia W, Meng J: Development of a population
for substantial new type Brassica napus diversified at both A/C genomes.
Theor Appl Genet 2010, 121:1141–1150.
5. Xiao Y, Luo Y, Yang Y, Fan H, Xia W, Mason AS, Zhao S, Sager R, Fei Q:
Development of microsatellite markers in Cocos nucifera and their
application in evaluating the level of genetic diversity of Cocos nucifera.
Plant Omics 2013, 6:193–200.
6. Li Y-C, Korol AB, Fahima T, Nevo E: Microsatellites within genes: structure,
function, and evolution. Mol Biol Evol 2004, 21:991–1007.
7. Lawson MJ, Zhang L: Housekeeping and tissue-specific genes differ in
simple sequence repeats in the 5′-UTR region. Gene 2008, 407:54–62.
8. Billotte N, Marseillac N, Risterucci AM, Adon B, Brottier P, Baurens FC,
Singh R, Herran A, Asmady H, Billot C: Microsatellite-based high density
linkage map in oil palm (Elaeis guineensis Jacq.). Theor Appl Genet 2005,
110:754–765.
9. Cochard B, Adon B, Rekima S, Billotte N, de Desmier CR, Koutou A, Nouy B,
Omore A, Purba AR, Glazsmann JC: Geographic and genetic structure of
African oil palm diversity suggests new approaches to breeding.
Tree Genet Genomes 2009, 5:493–504.
10. Moretzsohn MC, Nunes CDM, Ferreira ME, Grattapaglia D: RAPD linkage
mapping of the shell thickness locus in oil palm (Eleais guineensis Jacq.).
Theor Appl Genet 2000, 100:63–70.
11. Rance KA, Mayes S, Price Z, Jack PL, Corley RHV: Quantitiative trait loci for
yield components in oil palm (Elaeis guineensis Jacq.). Theor Appl Genet
2001, 103:1302–1310.
12. Tranbarger TJ, Dussert S, Joët T, Argout X, Summo M, Champion A, Cros D,
Omore A, Nouy B, Morcillo F: Regulatory mechanisms underlying oil palm
fruit mesocarp maturation, ripening, and functional specialization in lipid
and carotenoil metabolism. Plant Physiol 2011, 156:564–584.
Xiao et al. BMC Plant Biology 2014, 14:384
/>
13. Low ET, Alias H, Boon SH, Shariff EM, Tan CA, Ooi LC, Cheah SC, Raha AR,
Wan KL, Singh R: Oil palm (Elaeis guineensis Jacq.) tissue culture ESTs:
identifying genes associated with callogenesis and embryogenesis.
BMC Plant Biol 2008, 8:62.
14. Tranbarger TJ, Kluabmongkol W, Sangsrakru D, Morcillo F, Tregear JW,
Tragoonrung S, Billotte N: SSR markers in transcripts of genes linked to
post-transcriptional and transcriptional regulatory function during
vegetative and reproductive development of Elaeis guineensis. BMC Plant
Biol 2012, 12:1.
15. Ting NC, Zaki NM, Rosli R, Low ETL, Ithnin M, Cheah SC, Tan SG, Singh R:
SSR mining in oil palm EST database: application in oil palm germplasm
diversity studies. J Genet 2010, 89:135–145.
16. Xiao Y, Yang Y, Cao H, Fan H, Ma Z, Lei X, Mason AS, Xia Z, Huang X:
Efficient isolation of high quality RNA from tropical palms for RNA-seq
analysis. Plant Omics 2012, 5:584–589.
17. Stewart C, Via LE: A rapid CTAB DNA isolation technique useful for RAPD
fingerprinting and other PCR applications. Biotechniques 1993, 14:748–750.
18. Grabherr MG, Haas BJ, Yassour M, Levin JZ, Thompson DA, Amit I, Adiconis X,
Fan L, Raychowdhury R, Zeng Q, Chen Z, Mauceli E, Hacohen N, Gnirke A,
Rhind N, Palma F, Birren BW, Nusbaum C, Lindblad-Toh K, Friedman N,
Regev A: Full-length transcriptome assembly from RNA-seq data without
a reference genome. Nat Biotechnol 2010, 29:644–652.
19. Mortazavi A, Williams BA, McCue K, Schaeffer L, Wold B: Mapping and
quantifying mammalian transcriptomes by RNA-seq. Nat Methods 2008,
5:621–628.
20. Audic S, Claverie JM: The significance of digital gene expression profiles.
Genome Res 1997, 7:986–995.
21. Peiner A, Yekutieli D, Benjamini Y: Identifying differentially expressed
genes using false discovery rate controlling procedures. B
ioinformatics 2003, 19:368–375.
22. Wu J, Zhang Y, Zhang H, Huang H, Folta KM, Lu J: Whole genome wide
expression profiles of vitis amurensis grape responding to downy
mildew by using solex sequencing technology. BMC Plant Biol 2010,
10:234.
23. Rozen S, Skaletsky H: Primer3 on the WWW for General Users and for
Biologist Programmers. In Bioinformatics Method and Protocols. New York:
Springer; 1999:365–386.
24. Cordeiro GM, Taylor GO, Henry RJ: Characterisation of microsatellite
markers from sugarcane (Saccharum sp.), a highly polyploidy species.
Plant Sci 2000, 155:161–168.
25. Singh R, Ong-Abdullah M, Low ET, Manaf MA, Rosli R, Nookiah R, Ooi LC,
Ooi SE, Chan KL, Halim MA, Azizi N, Nagappan J, Bacher B, Lakey N,
Smith SW, He D, Hogan M, Budiman MA, Lee EK, DeSalle R, Kudrna D,
Goicoechea JL, Wing RA, Wilson RK, Fulton RS, Ordway JM, Martienssen RA,
Sambanthamurthi R: Oil palm genome sequence reveals divergence of
interfertile species in Old and New worlds. Nature 2013, 500:335–339.
26. Pritchard JK, Stephens M, Donnelly P: Inference of population structure
using multilocus genotype data. Genetics 2000, 155:945–959.
27. Evanno G, Regnaut S, Goudet J: Detecting the number of clusters of
individuals using the software STRUCTURE: a simulation study. Mol Ecol
2005, 14:2611–2620.
28. Murphy DJ: Oil palm: future prospects for yield and quality
improvements. Lipid Technol 2009, 21:257–260.
29. Xia W, Xiao Y, Liu Z, Luo Y, Mason AS, Fan H, Yang Y, Zhao S, Peng M:
Development of gene-based simple sequence repeat markers for
association analysis in Cocos nucifera. Mol Breeding 2014, 34:525–535.
30. Du Q, Gong C, Pan W, Zhang D: Development and Application of
Microsatellites in candidate genes related to wood properties in the
Chinese white poplar (Populus tomentosa Carr.). DNA Res 2012, 20:31–44.
31. Cardle L, Ramsay L, Milbourne D, Macaulay M, Marshall D, Waugh R:
Computational and experimental characterization of physically clustered
simple sequence repeats in plants. Genetics 2000, 156:847–854.
32. Ellis JR, Burke JM: EST-SSRs as a resource for population genetic analysis.
Heredity 2007, 99:125–132.
33. Varshney RK, Thiel T, Stein N, Langridge P, Graner A: In silico analysis on
frequency and distribution of microsatellites in ESTs of some cereal
species. Cell Mol Biol Lett 2002, 7:537–546.
34. Varshney RK, Graner A, Sorrells ME: Genic microsatellite markers in plants:
features and applications. Trends Biotechnol 2005, 23:48–55.
Page 13 of 13
35. Qiu L, Yang C, Tian B, Yang J-B, Liu A: Exploiting EST databases for the
development and characterization of EST-SSR markers in castor bean
(Ricinus communis L.). BMC Plant Biol 2010, 10:278.
36. Ramu P, Billot C, Rami JF, Senthilvel S, Upadhyaya HD, Reddy LA, Hash CT:
Assessment of genetic diversity in the sorphum reference set using
EST-SSR markers. Theor Appl Genet 2013, 126:2051–2064.
37. Rivera R, Edwards KJ, Barker JHA, Arnold GM, Ayad G, Hodgkin T, Karp A:
Isolation and characterization of polymorphic microsatellites in Cocos
nucifera L. Genome 1999, 42:668–675.
38. Chinnusamy V, Zhu J, Zhu JK: Cold stress regulation of gene expression in
plants. Trends Plant Sci 2007, 12:444–451.
39. Wang X, Basnayake BM, Zhang H, Li G, Li W, Virk N, Mengiste T, Song F: The
Arabidopsis ATAF1, a NAC transcription factor, is a negative regulator of
defense responses against necrotrophic fungal and bacterial pathogens.
Mol Plant Microbe Interact 2009, 22:1227–1238.
doi:10.1186/s12870-014-0384-2
Cite this article as: Xiao et al.: Exploiting transcriptome data for the
development and characterization of gene-based SSR markers related
to cold tolerance in oil palm (Elaeis guineensis). BMC Plant Biology
2014 14:384.
Submit your next manuscript to BioMed Central
and take full advantage of:
• Convenient online submission
• Thorough peer review
• No space constraints or color figure charges
• Immediate publication on acceptance
• Inclusion in PubMed, CAS, Scopus and Google Scholar
• Research which is freely available for redistribution
Submit your manuscript at
www.biomedcentral.com/submit