Genome-wide identification and comparative analysis of the heat shock transcription factor family in Chinese white pear (Pyrus bretschneideri) and five other Rosaceae species
Bạn đang xem bản rút gọn của tài liệu. Xem và tải ngay bản đầy đủ của tài liệu tại đây (2.34 MB, 16 trang )
Qiao et al. BMC Plant Biology (2015) 15:12
DOI 10.1186/s12870-014-0401-5
RESEARCH ARTICLE
Open Access
Genome-wide identification and comparative
analysis of the heat shock transcription factor
family in Chinese white pear (Pyrus bretschneideri)
and five other Rosaceae species
Xin Qiao, Meng Li, Leiting Li, Hao Yin, Juyou Wu and Shaoling Zhang*
Abstract
Background: Heat shock transcription factors (Hsfs), which act as important transcriptional regulatory proteins in
eukaryotes, play a central role in controlling the expression of heat-responsive genes. At present, the genomes
of Chinese white pear (‘Dangshansuli’) and five other Rosaceae fruit crops have been fully sequenced. However,
information about the Hsfs gene family in these Rosaceae species is limited, and the evolutionary history of the Hsfs
gene family also remains unresolved.
Results: In this study, 137 Hsf genes were identified from six Rosaceae species (Pyrus bretschneideri, Malus ×
domestica, Prunus persica, Fragaria vesca, Prunus mume, and Pyrus communis), 29 of which came from Chinese white
pear, designated as PbHsf. Based on the structural characteristics and phylogenetic analysis of these sequences, the
Hsf family genes could be classified into three main groups (classes A, B, and C). Segmental and dispersed
duplications were the primary forces underlying Hsf gene family expansion in the Rosaceae. Most of the PbHsf
duplicated gene pairs were dated back to the recent whole-genome duplication (WGD, 30–45 million years ago
(MYA)). Purifying selection also played a critical role in the evolution of Hsf genes. Transcriptome data demonstrated
that the expression levels of the PbHsf genes were widely different. Six PbHsf genes were upregulated in fruit under
naturally increased temperature.
Conclusion: A comprehensive analysis of Hsf genes was performed in six Rosaceae species, and 137 full length Hsf
genes were identified. The results presented here will undoubtedly be useful for better understanding the
complexity of the Hsf gene family and will facilitate functional characterization in future studies.
Keywords: Hsf, Stress-response, Evolution, Transcriptome sequencing, Pear, Rosaceae
Background
Plant development and agricultural production are seriously disturbed by adverse environmental conditions such
as cold, drought, and excess heat. Heat stress due to increases in temperature beyond a threshold level cause significant damage to plant morphology, physiology, and
biochemistry and may drastically reduce plant biomass
production and economic yield in many areas worldwide
[1,2]. In response, plants have developed numerous
* Correspondence:
College of Horticulture, State Key Laboratory of Crop Genetics and
Germplasm Enhancement, Nanjing Agricultural University, Nanjing 210095,
China
sophisticated adaptations over the long course of evolution [3]. Plant survival is dependent upon a network of interconnected cellular stress response systems that involve
the activation of a wide range of transcriptional factors;
this network is challenged by global climate changes such
as global warming, which makes heat stress a significant
concern [4-7]. As important gene regulators, transcription
factors are involved in an array of plant protective mechanisms and cellular stress-response pathways and play an
essential role in enhancing the stress tolerance of crop
plants [8-13]. Hsfs are particularly involved in the heat
stress response, and these products are important regulators in the sensing and signaling of heat stress [13]. Recent
© 2015 Qiao et al.; licensee BioMed Central. This is an Open Access article distributed under the terms of the Creative
Commons Attribution License ( which permits unrestricted use, distribution, and
reproduction in any medium, provided the original work is properly credited. The Creative Commons Public Domain
Dedication waiver ( applies to the data made available in this article,
unless otherwise stated.
Qiao et al. BMC Plant Biology (2015) 15:12
studies have also shown that Hsfs are involved in plant
growth and development, as well as in responses to other
abiotic stresses such as cold, salt, and drought [12-21]. For
example, HsfA1a acts as the master regulator of the heat
stress response in tomato (Solanum lycopersicum) [22];
HsfA2 is the dominant Hsf in tomato and Arabidopsis and
is also associated with oxidative and drought stress responses [12,19,23]; HsfA4a is related to cadmium tolerance in rice (Oryza sativa) [21]; and HsfA9 is involved in
embryogenesis and seed maturation in sunflowers and
Arabidopsis [16-18].
As do many other transcription factors, Hsfs possess a
modular structure composed of several structurally and
functionally conserved domains. Hsfs share a common
core structure composed of an N-terminal DNA binding
domain (DBD) and an adjacent bipartite oligomerization
domain (HR-A/B) [24,25]. Some Hsfs also include other
well-defined domains: a nuclear localization signal (NLS)
domain essential for nuclear import, nuclear export signal
(NES) domain rich in leucine, and C-terminal activator
domain (CTAD) characterized by aromatic (W, F, Y), large
hydrophobic (L, I, V), and acidic (E, D) amino acid residues, known as AHA motifs [13,24,26]. Close to the
N-terminus, the DBD is the most conserved region of
the Hsfs and is composed of an antiparallel fourstranded β-sheet (β1-β2-β3-β4) and a three-helical bundle (H1, H2, and H3). A central helix-turn-helix motif
(H2-T-H3) located in the hydrophobic core of this domain specifically binds to the heat shock promoter elements [27]. The HR-A/B domain is characterized by
hydrophobic heptad repeats that form a helical coiledcoil structure, which is a prerequisite for high affinity
DNA binding and, subsequently, for transcriptional activity. Furthermore, a flexible linker exists between the
DBD domain and HR-A/B domain [28].
Differences in the numbers of Hsf genes have been widely
determined in angiosperms. In contrast to those of other
eukaryotes, which possess one to three heat stress Hsf
genes, the plant Hsf gene family contains a striking number
of genes, with more than 20 and up to 52 members in any
given species [12,29,30]. According to the structural characteristics of their HR-A/B domain and phylogenetic comparisons, plant Hsf genes may be divided into three classes: A,
B, and C [24,25]. Hsf genes of class B are comparatively
compact, not containing any insertions, while those of classes A and C have insertions of 21 (class A) and seven (class
C) amino acid residues between the A and B components
of the HR-A/B domain. This classification is also supported
by the flexible linker between the DBD domain and HR-A/
B domain (9 to 39, 50 to 78, and 14 to 49 amino acid residues for class A, B, and C Hsf genes, respectively) [13,24].
In addition, many plant class A Hsf genes have a particular
signature domain comprising a combination of an AHA
motif with an adjacent NES [13,25].
Page 2 of 16
Because of the vital regulatory functions of Hsf genes
in plant responses to different stresses and developmental processes [18-20], Hsf gene family have been extensively studied in the model plant Arabidopsis thaliana,
as well as in nonmodel plants such as rice (Oryza sativa),
poplar (Populus trichocarpa), maize (Zea mays), apple
(Malus domestica), etc. [9,13,24,31-33]. In comparison
with that in other species, the Hsf gene family in the Rosaceae has not been widely examined. Pear is a member of
the Rosaceae family and is also the third-most important
temperate fruit species [34]. Recently, the genome of the
domesticated Chinese white pear (Pyrus bretschneideri
Rehd. cv. ‘Dangshansuli’) [34] has been fully sequenced.
Genome sequences are also available for five other Rosaceae species (apple, peach, strawberry, Chinese plum, and
European pear). This information provides an opportunity
to further analyze the Hsf gene family in Rosaceae species.
Therefore, our present study aims to annotate the fulllength Hsf genes in Chinese white pear and other Rosaceae fruit species, infer their expansion and evolutionary
history, explore their heat stress responses as elicited by
naturally increased temperature, and provide a relatively
complete profile of the Hsf gene family in Rosaceae. The
results of this work will be useful for revealing the mechanisms of thermotolerance in fruit trees and for improving
the tolerance of fruit trees to high-temperature stress,
which is becoming more prevalent due to global warming.
Results
Identification and classification of Hsf genes in the Rosaceae
Two strategies were used to search for members of the
Hsfs family in Pyrus bretschneideri and five other Rosaceae
species: Hidden Markov Model search (HMMsearch) with
the Hsf domain HMM profile (PF00447) and BLASTP
using Hsf protein sequences from Arabidopsis thaliana
and Populus trichocarpa as queries. A total of 185 candidate Hsf genes were identified. We removed six and one
Hsf genes located in unanchored scaffolds of Chinese
white pear and Chinese plum, respectively. A further 40
candidates were removed due to an incomplete DBD
domain and loss of the functional HR–A/B domain.
One abnormal pear Hsf (Pbr013854.1) containing a
Really Interesting New Gene (RING) finger domain and
a tryptophan-aspartic acid 40 (WD40) domain was also
removed. The selection of apple Hsf genes was based on
recent research results [32]. Consequently, 137 nonredundant and complete Hsf genes were surveyed in our
study. A total of 29 Hsf genes were identified in Chinese
white pear(PbHsf ), 33 in European pear (PcHsf ), 25 in
apple (MdHsf ), 17 in peach (PpHsf ), 16 in strawberry
(FvHsf ), and 17 in Chinese plum (PmHsf ) (Table 1).
The phylogenetic tree of the six Rosaceae species was
reconstructed, and the WGD events over the course of
genome evolution were inferred from recent studies [34]
Qiao et al. BMC Plant Biology (2015) 15:12
Page 3 of 16
Table 1 Genome information and Hsf genes number identified in Rosaceae species
Common name
Scientific name
Chromosome
number
Release
version
Genome gene
number
Identified
42341
29 (38)
Hsf genes
Gene name
prefix
Chinese white pear
Pyrus bretschneideri
34
NJAU, v1.0
Pbr
Apple
Malus domestica
34
GDR, v1.0
63541
25 (49)
MDP
Peach
Prunus persica
16
JGI, v1.0
27864
17 (21)
ppa
Strawberry
Fragaria vesca
14
GDR, v1.0
32831
16(16)
gene
Chinese plum
Prunus mume
16
BFU, v1.0
31390
17 (20)
Pm
European pear
Pyrus communis
34
GDR, v1.0
43419
33 (41)
PCP
In this study we totally investigated six Rosaceae species genomes. NJAU, Nanjing Agricultural Univerisity ( GDR, Genome
Database for Rosaceae ( JGI, Joint Genome Institude ( BFU, Beijing Forestry University (http://
prunusmumegenome.bjfu.edu.cn/index.jsp). The numbers in parenthesis show gene count before filtering the unanchored and incomplete genes.
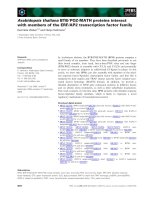
(Figure 1). Chinese white pear, European pear, and apple
belong to the Maloideae, strawberry belongs to Rosoideae,
and peach and Chinese plum belong to the Prunoideae
[35]. Nearly twice as many Hsf genes were present in pear
and apple than in peach, strawberry, and Chinese plum. A
recent WGD event occurred in the Maloideae but not in
the Rosoideae and Prunoideae. We can therefore infer that
the recent WGD led to the specific expansion of the Hsf
gene family in the Maloideae.
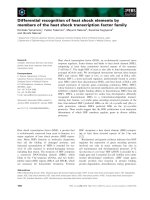
The PbHsf genes are distributed on 14 of the 17 pear
chromosomes, with five Hsf genes detected on chromosome 15 (Figure 2). Similarly to that in PbHsf genes, the
distribution of the Hsf genes in the other five Rosaceae
genomes is random (Figure 2 and Additional file 1).
According to the multiple sequence alignment of the
functional domains and the phylogenetic analysis, the
members of the Rosaceae Hsf family genes were divided
into three subfamilies (A, B, and C) (Table 2 and Additional
file 2). These results were consistent with the classification
of the genes in other plants [24,33]. In contrast with class
B, classes A and C possess insertions of amino acid residues
in the HR-A/B region. The protein sequences of class A
contain more specific domains than do those of class C.
Furthermore, a phylogenetic tree was generated using the
protein sequences of Pyrus bretschneideri (PbHsf), Populus trichocarpa (PtHsf), and Arabidopsis thaliana (AtHsf)
(Figure 3). The tree was constructed using the neighbor
joining (NJ) method, and a maximum likelihood (ML) tree
confirmed the result. The Hsf genes from the three species
were clearly grouped into three different clades corresponding to the main Hsf classes A, B, and C. In the PbHsf
genes family, 19, 8, and 2 genes were assigned to Classes
A, B, and C, respectively. Within the A clade, nine distinct
subclades (A1, A2, A3, A4, A5, A6, A7, A8, and A9)
were resolved and contained all of the PbHsf genes. The
C-type Hsf genes from the three plant species also constituted one distinct clade, which appeared to be more
closely related to the Hsf A-group. Correspondingly, the
B-type Hsf genes were grouped into a separate clade
subdivided into five groups (B1, B2, B3, B4, and B5);
notably, the B5 sub-clade was obviously distinct from
the other four subclades.
Gene features of Hsf genes
Gene features such as structural complexity and GC3
content have intense impacts on gene retention and evolution after WGD [36]. Hence, we investigated the features of Hsf genes in the Rosaceae, including gene length,
intron length, GC content, and GC3 content (Additional
file 3). The average GC and GC3 contents of the Hsf gene
family were higher than the average levels for the whole
genome in most of the six Rosaceae species. Additionally,
the average intron lengths of these genes in each of the
Rosaceae genomes, except that of European pear, were
shorter than those at the whole genome level. Especially
in peach and Chinese plum, the average gene lengths and
Figure 1 Species tree of six Rosaceae species. Solid oval indicates the occurrence of WGD. Numbers in the figure indicate species divergence
time. Unit: MYA. The data were downloaded from NCBI Taxonomy common tree ( />and the tree was constructed by MEGA6.
Qiao et al. BMC Plant Biology (2015) 15:12
Page 4 of 16
Figure 2 Localization and synteny of the Hsf genes in Rosaceae genomes. Hsf genes in Chinese white pear (PbHsf), apple (MdHsf) and peach
(PpHsf) were mapped on the different chromosomes, while in European pear (PcHsf) were anchored to the scaffolds. Chromosome or scaffold
number is indicated on the inner side and highlighted red short lines in the inner circle correspond to different Hsf genes. Gene pair with a
syntenic relationship was joined by the line.
intron lengths of Hsf genes were significantly shorter than
the whole genome averages. These results may be related
to the intron losses that occurred during the expansion
and divergence of the Hsf gene family [37].
Furthermore, the exon–intron structures of the Hsf
genes in Chinese white pear and the other Rosaceae
species were resolved (Additional files 4 and 5). The
structures of the genes in the different subfamilies were
extremely similar; this observation further verified the
precision of the classification. However, the location and
number of introns and exons varied among the Hsf genes.
Most members of the Hsf gene family in the Rosaceae
contained one intron. Strikingly, Hsf genes comprised of
multiple introns were found in all six Rosaceae species
and were especially prevalent in apple, strawberry, and
European pear (Additional file 5). Notably, PcHsfA6b contained 13 introns; this gene was extremely different from
the other Hsf genes because of its large size (16595 bp)
and the presence of TIFY and CCT_2 domains.
Conserved protein domains in PbHsfs
Prediction of the typical signature domains of the PbHsfs
protein sequences was conducted by comparing the identified PbHsfs with their well-characterized homologs from
tomato, Arabidopsis, and apple [13,24,25,32]. Five conserved domains were identified by sequence alignment,
and their positions in the protein sequences were determined (Table 3). All of the PbHsfs protein sequences contained the highly conserved DBD domain, consisting of a
three helical bundle (H1, H2, and H3) and a four-stranded
antiparallel β-sheet, in the N-terminal region. However,
the length of the DBD domain was quite variable within
the Hsf family. The presence of the coiled-coil structure
characteristic of leucine zipper–type protein interaction
domains, which is a property of the HR-A/B region, was
instead predicted in all PbHsfs protein sequences using
the MARCOIL tool. Furthermore, the majority of the
PbHsfs protein sequences contained NES and NLS domains, which are essential for shuttling Hsfs between the
Qiao et al. BMC Plant Biology (2015) 15:12
Page 5 of 16
Table 2 Classification of Hsf genes in six Rosaceae species
Hsfs
Chinese white pear(29)
Apple(25)
Peach(17)
Strawberry(16)
Chinese plum(17)
European pear(33)
HsfA1a
Pbr025227.1
MDP0000517644
ppa004782m
gene13904
Pm023178
PCP005520.1
b
Pbr041026.1
MDP0000156337
ppa004559m
gene10474
Pm011227
c
Pbr031411.1
MDP0000232623
d
HsfA2a
MDP0000259645
Pbr019856.1
b
MDP0000489886
PCP011761.1
ppa007300m
gene02705
Pm005519
MDP0000243895
PCP044449.1
PCP016141.1
c
PCP034937.1
HsfA3a
Pbr005496.1
MDP0000131346
b
Pbr016805.1
MDP0000606400
c
ppa015602m
gene30146
Pm026236
PCP016675.1
PCP026047.1
MDP0000174161
HsfA4a
Pbr000538.1
b
Pbr016090.1
c
Pbr022463.1
d
Pbr005379.1
HsfA5a
Pbr016487.1
b
MDP0000155849
ppa006534m
gene23802
Pm010169
ppa015468m
gene15872
Pm013905
PCP025026.1
PCP026169.1
PCP024177.1
PCP015400.1
MDP0000301101
gene06570
Pm007815
PCP002437.1
gene29004
Pm009237
PCP030606.1
MDP0000613011
HsfA6a
Pbr036788.1
b
Pbr014670.1
c
Pbr018847.1
HsfA7a
Pbr009953.1
b
Pbr012908.1
HsfA8a
Pbr012136.1
b
ppa1027143m
PCP018714.1
ppa010224m
gene20347
Pm020253
PCP019575.1
PCP022776.1
MDP0000191541
ppa006514m
Pm005887
MDP0000172376
HsfA9a
Pbr041474.1
MDP0000194672
b
Pbr015630.1
MDP0000319456
HsfB1a
Pbr025141.1
MDP0000527802
b
Pbr030422.1
MDP0000578396
HsfB2a
Pbr013953.1
MDP0000155667
b
PCP006787.1
PCP031284.1
ppa016533m
gene12667
Pm027197
PCP005035.1
PCP027517.1
ppa009274m
gene24036
Pm026366
PCP024136.1
PCP030007.1
ppa009180m
gene13301
Pm019357
PCP030684.1
ppa008441m
gene32416
Pm023788
PCP033244.1
ppa014675m
gene02464
c
PCP007662.1
HsfB3a
Pbr002020.1
MDP0000622590
b
Pbr030436.1
MDP0000202716
c
Pbr002038.1
HsfB4a
Pbr019653.1
b
HsfB5a
PCP027354.1
PCP027124.1
MDP0000209135
PCP029678.1
PCP024839.1
ppa026635m
Pm005297
MDP0000129357
Pbr016270.1
ppa011804m
gene02408
Pm010031
b
PCP044895.1
PCP016888.1
HsfC1a
Pbr014107.1
MDP0000230456
b
Pbr016948.1
MDP0000320827
ppa008830m
nucleus and cytoplasm [13]. Additional sequence comparison identified AHA domains in the center of the
C-terminal activation domains, as was expected in the
A-type PbHsfs. By contrast, these domains were not
identified in the B- and C-type PbHsfs.
gene30881
Pm027421
PCP000545.1
PCP022060.1
The Multiple EM for Motif Elicitation (MEME) motif
search tool was used to predict and verify domains in
the PbHsf protein sequences. Thirty corresponding consensus motifs were detected (Figure 4; Additional file 6).
The number of motifs contained in the PbHsf protein
Qiao et al. BMC Plant Biology (2015) 15:12
Page 6 of 16
Figure 3 Neighbor-joining phylogeny of Hsfs from P.
bretschneideri, P. trichocarpa and A. thaliana. The phylogenetic
tree was obtained using the MEGA 6.0 software on the basis of
amino-acid sequences of the N-terminal domains of Hsfs including
the DNA-binding domain, the HR-A/B domain and the linker between
these two domains. Bootstrap analysis was conducted with 1000
replicates. The abbreviations of species names are as follows: Pb, Pyrus
bretschneideri; Pt, Populus trichocarpa; At, Arabidopsis thaliana.
sequences was quite variable. The members of class A
contained the most conserved motifs, with the largest
number (12) detected in PbHsfA1a and PbHsfA1b. Class
C members possessed the fewest motifs, while class B
PbHsfs contained an intermediate number. Regarding
the DBD domain, motifs 1, 2, and 4 were found in 29
members of the PbHsfs family. The coiled-coil structure
motifs 3, 5, 6 were detected in all members of the PbHsfs
family. All class B proteins exhibited the coiled-coil region
motifs 5 or 6, whereas motifs 3 and 6 were detected in
classes A and C. The conserved motifs 3, 5, 6, 12, 16, 18,
and 20 were identified as NLS. Motifs 3, 5, 16, and 20
were representative NLS domains in class A, while NLS
domains were represented by motifs 6, 12, and 18 in class
B. Furthermore, motifs 9, 12, 17, 18, and 23 represented
NES domains; motifs 9, 17, and 23 were only observed in
class A, while motifs 12 and 18 were seen only in class B.
Motifs 7, 8, 10, 15, 17, and 27 was identified as characteristic AHA domains. Despite the variability in size and sequence, predicted DBD domain, HR-A/B domain and
NLS domain were observed in each PbHsfs through the
combination of the two methods.
Synteny analyses reveal the origin and expansion of the
Hsf gene family
Several gene duplication modes drive the evolution of
protein-coding gene families, including WGD or segmental duplication, tandem duplication, and rearrangements
at the gene and chromosomal level [38]. We detected the
origins of duplicate genes for the Hsf genes family in five
Rosaceae genomes using the MCScanX package. Each
member of Hsf gene family was assigned to one of five different categories: singleton, WGD, tandem, proximal or
dispersed. Different patterns of gene duplication contributed differentially to the expansion of the Hsf gene family
in the investigated taxa (Table 4). Remarkably, 75.9% (22)
of the Hsf genes in Chinese white pear and 68% (17) of
those in apple were duplicated and retained from WGD
events, compared to only 35.3% (6) in peach, 25% (4) in
strawberry, and 23.5% (4) in Chinese plum. The recent
lineage-specific WGD events (30–45 MYA) in pear and
apple likely resulted in the higher proportions of WGDtype Hsf gene duplications observed in these species.
However, the proportions of dispersed Hsf gene duplication in peach (64.7%), strawberry (75%), and Chinese
Qiao et al. BMC Plant Biology (2015) 15:12
Page 7 of 16
Table 3 Functional domains of PbHsfs
Gene name
DBD
HR-A/B
NLS
NES
AHA
PbHsfA1a
16-109
126-196
(222) NKKRRLPR
(486) MNYITEQMQ
AHA(439) DIFWEQFLTAS
PbHsfA1b
16-109
126-196
(222) NKKRRLPR
(486) MNYITEQMQ
AHA(439) DIFWEQFLTAS
PbHsfA1c
39-132
153-220
(243) NKKRRLKQ
(499) MDNLTEKMG
AHA(452) DIEAFLKDWDD
PbHsfA2a
38-131
145-212
(227) KNR-X6-RKRR
(365) LVDQMGYL
AHA1(315) ETIWEELWSD
AHA2(355) DWGEDLQD
PbHsfA3a
99-216
237-296
(308) KT-X10-RRKFVK
nd
AHA1(472) EDIWSMGFGV
AHA2(491) ELWGNPVNY
AHA3(511) LDVWDIGPLQ
AHA4(527) IDKSPAHDS
AHA1(471) EDIWSMDFDI
PbHsfA3b
103-215
237-295
(311) KDRGSSRVRRKFVK
nd
AHA2(489) NELLGNPVNY
AHA3(510) LDVWDIDPLQ
AHA4(526) INKWPAHES
PbHsfA4a
11-94
113-190
(208) RKRRLPR
(407) LTEQMGHL
AHA1(252) LTFWEDTIHD
AHA2(356) DGFWEQFLTE
PbHsfA4b
11-94
113-188
(206) RKRRLPR
(410) LTEQMGHL
AHA1(250) LTFWEDTIHD
AHA2(359) DVFWEQFLTE
PbHsfA4c
12-106
137-186
(204) KKRR
(429) FTNQIGRL
AHA1(252) LNFWEDFVHGI
AHA2(378) DVFWEQCLTE
PbHsfA4d
12-106
137-187
(205) KKRR
(425) FRNQIGRP
AHA1(247) LNFWEDFLHGV
AHA2(372) DVFWEQCLTE
PbHsfA5a
12-105
116-183
(194) RK-X10-KKRR
(477) AETLTL
AHA (431) DVFWEQFLTE
PbHsfA6a
31-125
154-204
(229) KKRRR
(344) LIEELGFL
AHA(312) DKGFWQDLFNE
PbHsfA6b
21-115
144-194
(210) RKELEKAVTKKRRR
(334) LIEELGFL
AHA(302) DKGYWQELFNE
PbHsfA6c
21-115
144-194
(210) RKELEKAVTKKRRR
(334) LIEELGFL
AHA(302) DKGYWQDLFNE
PbHsfA7a
44-138
167-217
(232) KKKELEEAMTKKRRR
(351) LADRLGYV
AHA(319) DEGFWEELFSE
PbHsfA7b
44-138
167-217
(232) KKKELEEAMTKKRRR
(344) LADRLGYF
AHA(312) DEGFWEELLSE
PbHsfA8a
18-111
129-198
(177) RNRLR
(389) TEQMGHL
AHA (308) DGAWEQFLLA
PbHsfA9a
95-182
247-315
(268) KR-X12-KRRR
(401) FYQELEDL
AHA(467) PCDWSAYVSHS
PbHsfA9b
139-239
241-308
(324) KR-X8-KRRR
(258) LKKDQD
AHA(460) PCDWSAYVSNS
PbHsfB1a
6-99
142-191
(246) KGDEKMKGKK
nd
nd
PbHsfB1b
66-99
42-191
(246) KGEEKMKGKK
(223) LDMEGG
nd
PbHsfB2a
42-135
174-217
(187) RLRK
nd
nd
PbHsfB3a
19-112
149-194
(223) RKRKR
(208) PKLFGVRLE
nd
PbHsfB3b
19-112
149-194
(223) RKRKR
(208) PKLFGVRLE
nd
PbHsfB3c
22-116
149-194
(180) KRKCK (223) RKRKR
(208) LKLFGVRLE
nd
(271) EVSELNQFAM
PbHsfB4a
21-114
179-239
(326) KNTK-X9-KKR
(367) LEKDDLGLHLM
nd
PbHsfB5a
11-111
151-188
nd
(151) LRKQKLELQV
nd
PbHsfC1a
9-102
121-173
(197) KKRR
nd
nd
PbHsfC1b
9-102
126-178
(225) KKRR
nd
nd
nd: no motifs detectable by sequence similarity search.
Qiao et al. BMC Plant Biology (2015) 15:12
Page 8 of 16
Figure 4 Motifs identified by MEME tools in Chinese white pear Hsfs. Thirty motifs (1 to 30) were identified and indicated by different
colors. Motif location and combined p-value were showed.
plum (76.5%) were considerably higher than in pear
(17.2%) and apple (20%). Peach, strawberry, and Chinese
plum have not experienced a WGD since their divergence
from apple and pear. Therefore, genome rearrangements,
gene losses, and RNA- and DNA-based transposed gene
duplications may account for the larger proportions of dispersed duplicates in these species. These results showed
that WGD or segmental duplication and dispersed gene
duplication played critical roles in the expansion of the
Hsf gene family in the Rosaceae.
Collinearity and synteny are traditionally identified by
looking for both intra- and intergenomic pairwise conservation blocks. To further investigate the potential evolutionary mechanisms of the PbHsf gene family, we performed
all-vs.-all local BLASTP to identify synteny blocks, using a
method similar to that used for the Plant Genome
Duplication Database (PGDD), across the entire Chinese
white pear genome. The dates of segmental duplications
can be inferred through this method; if two or more syntenic regions exist in one species, these regions are considered to be segmental duplications.
Conserved synteny was observed in 22 regions containing Hsf genes across the Chinese white pear genome
(Figure 5), and these syntenic blocks included most of
the Hsf genes (Table 5). We observed strongly conserved
synteny in some of these blocks, several of which contained
over 100 syntenic gene pairs (data not shown). These results support the occurrence of chromosome segment duplication or WGD in Chinese white pear [34]. A total of 13
segmentally duplicated gene pairs were found in the PbHsf
gene family. Chromosomes 4 and 7 were not involved in
any duplication events.
Table 4 Numbers of Hsf genes from different origins in five Roseceae genomes
Species
No. of
Hsf genes
No. of Hsf genes from different origins (percentage)
Proximal
Dispersed
Chinese white pear
29
Singleton
0
22(75.9)
WGD
Tandem
0
2(6.9)
5(17.2)
Apple
25
0
17(68.0)
0
3(12.0)
Peach
17
0
6(35.3)
0
0
11(64.7)
Strawberry
16
0
4(25)
0
0
12(75)
Chinese plum
17
0
4(23.5)
0
0
13(76.5)
5(20.0)
Qiao et al. BMC Plant Biology (2015) 15:12
Page 9 of 16
Figure 5 Segmental duplication between members of the Hsf family in Chinese white pear. (a) PbHsfA3a(Pbr005496) and PbHsfA3b
(Pbr016805), (b) PbHsfA4a(Pbr000538) and PbHsfA4b(Pbr016090), (c) PbHsfA6a(Pbr036788) and PbHsfA6b(Pbr014670) and PbHsfA6a(Pbr036788) and
PbHsfA6c(Pbr018847), (d) PbHsfA7a(Pbr009953) and PbHsfA7b(Pbr012908), (e) PbHsfB1a(Pbr025141) and PbHsfB1c(Pbr030422), (f) PbHsfC1a
(Pbr014107) and PbHsfC1b(Pbr016948). The figure shows a region of 100 kb on each side flanking the Hsf genes. Homologous gene pairs are
connected with bands. The chromosome segment is indicated by black horizontal line, and the broad line with arrowhead represents gene and
its transcriptional orientation. The text besides the gene is the gene locus identifier suffix. The Hsf genes are shown in red, homologous genes are
shown in yellow, and other genes shown in green.
Ks value and Ka/Ks ratio reveal dates and driving forces
of evolution
The Ks value (synonymous substitutions per site) is widely
used to estimate the evolutionary dates of WGD or
segmental duplication events. Based on Ks values, two
genome-wide duplication events were observed in the apple
genome: the paleoduplication event corresponding to the γ
triplication (Ks ~1.6) and a recent WGD (Ks ~0.2) [39].
Similarly to that in apple, the ancient WGD (Ks ~1.5–1.8)
in pear resulted from a paleohexaploidization (γ) event
that took place ~140 MYA [40], while the recent WGD
(Ks ~0.15–0.3) in pear was inferred to have occurred at
30–45 MYA [34,39]. All members of the rosid clade have
Table 5 Synteny analysis of Hsf gene regions in Chinese
white pear genome
Duplicated
Hsf gene 1
Duplicated
Hsf gene 2
Mean
Ks
Homologous
gene pairs in
200 kb
Genes in
200 kb
PbHsfA2a
PbHsfA9a
2.13
6
30
PbHsfA2a
PbHsfA9b
1.60
2
30
PbHsfA3a
PbHsfA3b
0.25
14
21
PbHsfA4a
PbHsfA4b
0.25
17
25
PbHsfA4a
PbHsfA4d
2.35
1
12
PbHsfA4c
PbHsfA4d
0.31
5
12
PbHsfA6a
PbHsfA6b
0.21
7
17
PbHsfA6a
PbHsfA6c
0.20
8
14
PbHsfA7a
PbHsfA7b
0.24
6
20
PbHsfA7b
PbHsfA6b
1.51
2
17
PbHsfA7b
PbHsfA6c
1.79
2
14
PbHsfB1a
PbHsfB1b
0.32
8
12
PbHsfC1a
PbHsfC1b
0.24
17
28
We chose six consecutive homologous gene pairs on each side flanking the
Hsf genes to calculate the mean Ks, and calculated the number of genes in
200 kb according to the segment with less genes in 200 kb.
undergone paleohexaploidization (γ) [39,41-43]. Therefore, we used Ks values to estimate the evolutionary dates
of the segmental duplication events among the PbHsf gene
family. The mean Ks of the Hsf duplicated gene pairs in
the syntenic region are shown in Table 5. The Ks values
for the PbHsf gene pairs ranged from 0.20 to 2.35. We
further inferred that the segmental duplications PbHsfA2a
and PbHsfA9b (Ks ~1.60), PbHsfA7b and PbHsfA6b
(Ks ~1.51), and PbHsfA7b and PbHsfA6c (Ks ~1.79) may
have arisen from the γ triplication (~140 MYA). Furthermore, many duplicated gene pairs had similar Ks
values (0.21–0.32), suggesting that these duplications may
have been derived from the same recent WGD (30~45
MYA). Surprisingly, two duplicated gene pairs (PbHsfA2a
and PbHsfA9a, PbHsfA4a and PbHsfA4d) possessed higher
Ks values (2.13-2.15), suggesting that they might have
stemmed from a more ancient duplication event.
The determination of orthology is an essential part of
comparative genomics. Identification of orthology using
synteny analysis has been employed in many studies
[44-46]. According to the identified synteny relationships,
we identified orthologous pairs of Hsf genes among five
Rosaceae species (Table 6 and Additional file 7). A total of
29 PbHsf genes were found in orthologous blocks within
five Rosaceae species, while 18 in apple, 17 in peach, 15 in
strawberry, and 16 in Chinese plum. The numbers of
orthologous pairs between Chinese white pear and other
four Rosaceae species (apple, peach, strawberry and
Chinese plum) are 30, 32, 26 and 29, respectively. The
average Ks values of the Hsf orthologs between Chinese
white pear and apple, peach, strawberry, or Chinese
plum ranged from 0.21 to 0.75 (Additional file 8). The Hsf
orthologs between Chinese white pear and apple possessed the lowest average Ks value (0.21), suggesting that
the evolutionary distance was closest between these species. The average Ks values of the Hsf orthologs between
Qiao et al. BMC Plant Biology (2015) 15:12
Page 10 of 16
Table 6 The orthology of Hsf genes in five Rosaceae species
HsfA1
Chinese pear
Apple
Peach
Strawberry
Chinese plum
PbHsfA1a
MdHsfA1b
PpHsfA1b
FvHsfA1b
PmHsfA1b
PbHsfA1b
MdHsfA1b
PpHsfA1b
FvHsfA1b
PbHsfA1c
PpHsfA1a
PmHsfA1b
PmHsfA1a
HsfA2
PbHsfA2a
MdHsfA2a,2b,9b
PpHsfA2a,9a
FvHsfA2a,9a
PmHsfA2a,9a
HsfA3
PbHsfA3a
MdHsfA3a,b
PpHsfA3a
FvHsfA3a
PmHsfA3a
PbHsfA3b
MdHsfA3a,b
HsfA4
PpHsfA3a
FvHsfA3a
PmHsfA3a
PbHsfA4a
PpHsfA4a
FvHsfA4a,b
PmHsfA4a
PbHsfA4b
PpHsfA4a
FvHsfA4a,b
PmHsfA4a
PbHsfA4c
PpHsfA4b
FvHsfA4b
PmHsfA4b
PpHsfA4a,4b
FvHsfA4b
PmHsfA4b
FvHsfA5a
PmHsfA5a
PbHsfA4d
HsfA5
HsfA6
HsfA7
PbHsfA5a
MdHsfA5a
PbHsfA6a
PpHsfA6a
FvHsfA6a
PmHsfA6a
PbHsfA6b
PpHsfA6a,7a
FvHsfA6a,7a
PmHsfA6a,7a
PbHsfA6c
PpHsfA6a,7a
FvHsfA6a,7a
PbHsfA7a
PpHsfA7a
PbHsfA7b
HsfA8
HsfA9
HsfB1
PbHsfA8a
PpHsfA6a,7a
MdHsfA8a,8b
FvHsfA7a
PpHsfA8a
PmHsfA6a,7a
PmHsfA8a
PbHsfA9a
MdHsfA9a,9b
PpHsfA9a
FvHsfA9a
PmHsfA9a
PbHsfA9b
MdHsfA9a,9b
PpHsfA9a
FvHsfA9a
PmHsfA9a
PmHsfB1a
PbHsfB1a
MdHsfB1a
PpHsfB1a
FvHsfB1a
PbHsfB1b
MdHsfB1a
PpHsfB1a
FvHsfB1a
HsfB2
PbHsfB2a
MdHsfB2a
PpHsfB2a,2b
FvHsfB2a,2b
HsfB3
PbHsfB3a
MdHsfB3a
PpHsfB3a
PbHsfB3b
MdHsfB3a,3b
PpHsfB3a
PbHsfB3c
MdHsfB3a,3b
PpHsfB3a
HsfB4
PbHsfB4a
MdHsfB4a,4b
HsfB5
PbHsfB5a
HsfC1
PmHsfA6a,7a
PmHsfA7a
PpHsfB4a
PpHsfB5a
PmHsfB2a
PmHsfB4a
FvHsfB5a
PmHsfB5a
PbHsfC1a
MdHsfC1a,1b
PpHsfC1a
FvHsfC1a
PmHsfC1a
PbHsfC1b
MdHsfC1a,1b
PpHsfC1a
FvHsfC1a
PmHsfC1a
Genes in the same row are putative orthologs within five species. Note that one PbHsf gene may anchor to multiple Hsf genes in another Rosaceae species, each
of those Hsf genes was identified as the ortholog for this PbHsf gene.
Chinese white pear and peach, Chinese plum, and strawberry were 0.55, 0.53, and 0.75, respectively.
Negative selection (purifying selection) is the process
by which deleterious mutations are removed. Conversely,
positive selection (Darwinian selection) accumulates new
advantageous mutations and spreads them through the
population [47]. To further detect which selection process
drove the evolution of the Hsf gene family, we also analyzed the Ka value (nonsynonymous substitutions per site),
Ka/Ks ratio of paralogs in the Rosaceae Hsf gene family
using coding sequences (CDS) (Additional file 9). The Ka/
Ks ratio measures the direction and magnitude of selection: a value greater than one indicates positive selection,
a value of one indicates neutral evolution, and a value less
than one indicates purifying selection [48]. All Ka/Ks
ratios of the paralogous genes were less than one, implying
that purifying selection was the primary influence on the
Hsf family genes.
Expression of Hsf family genes in pear fruit
The expression of PbHsf genes was investigated at the transcriptional level. At first, the Chinese white pear expressed
sequence tags (ESTs) database was searched for the Hsf
genes to verify the accuracy of the previous genomic predictions. These results provided reliable transcriptional evidence for most of these PbHsf genes (Additional file 10).
Of the 29 predicted PbHsf genes, 22 were found to have
EST hits with highest score. A total of 44 EST hits were
found for all PbHsf genes, with the greatest number
(four each) for PbHsfA1a and PbHsfB2a. These results
Qiao et al. BMC Plant Biology (2015) 15:12
provide credible support for the identification of PbHsf
family genes. However, no EST hits were identified for
PbHsfA6a, PbHsfA6b, PbHsfA6c, PbHsfA9b, PbHsfB3a,
PbHsfB3b, and PbHsfB5a against the EST database. The
functional roles of these genes will require further
investigation.
To further explore the expression patterns of Hsf family
genes in Chinese white pear, transcriptome sequencing
analysis was conducted using fruit samples harvested from
pear trees under field conditions and naturally increased
temperatures. We took fruit samples from spring to summer 2012 at four different developmental stages (S1-S4)
corresponding to different temperature ranges. The first
sampling, used as a reference, was conducted on April 22
(S1) at 26°C/15°C (day/night; max/min), corresponding to
15 days after flowering (DAF). Subsequent samples were
taken on May 13 at 26°C/19°C (S2, 36 DAF), June 27 at
27°C/21°C (S3, 80 DAF), and July 28 at of 36°C/28°C (S4,
110 DAF).
The results of transcriptome sequencing analysis are
shown in Figure 6 (Additional file 11), and the PbHsf
genes were responsive to the increased temperatures.
RPKM (reads per kilobase per million) values were used
to measure the expression level of the PbHsf genes. The
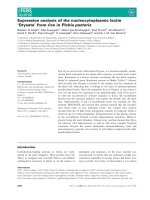
expression patterns of the 29 PbHsf genes were very diverse, and most PbHsf genes exhibited some degree of
Page 11 of 16
stage specificity. Only PbHsfA6c exhibited no expression.
Twenty-four genes were detected across the four fruit developmental stages. Five genes (PbHsfA4a, PbHsfA5a,
PbHsfA8a, PbHsfB1a, and PbHsfB3c) presented high expression in all four stages. Moreover, six PbHsf genes
(PbHsfA3a, PbHsfA4b, PbHsfA4d, PbHsfA6a, PbHsfB1b,
and PbHsfC1a) showed increasing transcript expression
with rising temperature, while PbHsfA9a, PbHsfA9b, and
PbHsfB4a expression decreased with the increased temperatures. However, PbHsfB3a and PbHsfB3b showed only
relatively little expression in stage S4, and PbHsfA6b
was expressed only in S3. Additionally, the transcriptional changes of PbHsfA1a, PbHsfA1b, and PbHsfA1c
were not obviously associated with temperature.
Discussion
Members of the Hsf gene family have been identified and
analyzed in different land plant species [13]. The number
and composition of Hsf family members differ in various
plants. Ancient polyploidy events (also known as WGDs)
and additional recent lineage-specific WGDs have presumably resulted in varying numbers of Hsf genes within
flowering plants. In this study, the sizes of the Hsf gene
families identified from the six Rosaceae genomes are diverse. The number of Hsf genes in Chinese white pear
(29), European pear (33), and apple (25) are greater than
Figure 6 Heatmap of expression level of Hsf genes in Chinese white pear fruit. Transcriptome data were used to measure the expression
level of Hsf genes. The groups A1-C1 on the left correspond to different subfamilies. S1-S4 correspond to four different developmental stages: on
22nd April (S1), 13rd May (S2), 27th June (S3), and 28th July (S4). Color scale at the top represents log2 transformed RPKM (reads per kilobase per
million) values. Light green indicates low expression and red indicates high expression. Heatmap was generated using R.
Qiao et al. BMC Plant Biology (2015) 15:12
those in peach (17), strawberry (16), and Chinese plum
(17). Pear and apple were inferred to have undergone a recent lineage-specific WGD, while peach, strawberry, and
Chinese plum did not experience this event [49]. Therefore, this recent WGD event likely led to the different
numbers of Hsf genes in the investigated Rosaceae species.
Different patterns of gene duplication, such as genomewide, tandem, and dispersed duplications, contribute differentially to the expansion of specific gene families in
plant genomes [50-52]. Some large gene families, including the APETALA 2/ethylene-responsive element binding
factor (AP2/ERF) and WRKY, are more likely to expand
by segmental and tandem duplications [53,54]. Conversely, gene families such as MADS (MINICHROMOSOME MAINTENANCE1, AGAMOUS, DEFICIENS
and SERUM RESPONSE FACTOR)-box, and NBS-LRR
(nucleotide-binding site-leucine-rich repeat) expand primarily through transposed duplications [50]. It has been
estimated that more than 90% of the increase in regulatory
genes in the Arabidopsis lineage has been caused by genome duplications [55]. Recent genome-wide studies have
revealed that the pear and apple genomes experienced at
least two genome duplications, one ancient and one before the pear-apple divergence [34]. Indeed, in this study,
the results of the synteny analysis verified that the expansion of the Hsf gene family in Chinese white pear and
apple was derived primarily from WGD or segmental duplications. This situation, in which segmental Hsf gene duplications were more frequent than tandem duplications,
also occurred in Arabidopsis, maize, and poplar [32,33,56].
However, dispersed duplications were the major drivers of
Hsf gene family expansion in peach, strawberry, and
Chinese plum. The genomes of these three species have
not experienced recent WGD. The genome rearrangements, gene losses, and gene transposition and retrotransposition after the ancient polyploidy event may have had
a comparatively stronger impact on the evolution of the
Hsf gene family in peach, strawberry, and Chinese plum.
Polyploidy through WGD is often followed by rapid
gene loss, and genome rearrangements have been widely
recognized as important in the evolution of plant genomes
[57]. The retention of genes duplicated through WGD is
biased in plant genomes and has been shown to be nonrandom across gene families [36,50]. For example, in
Arabidopsis, genes encoding transcription factors, protein
kinases, and ribosomal proteins have been preferentially
retained after WGD [55,58,59]. In recent years, several
models have been applied to elucidate the evolutionary
fates and biased retention of duplicated genes, such as subfunctionalization, neofunctionalization, and dosage balance
[60]. Recent studies have strongly supported the hypothesis
that the overretention of duplicated genes derived from
WGD is intensely correlated with greater structural complexity, highly conserved domains, lower evolutionary
Page 12 of 16
rates, and higher GC3 content in the plant genome,
suggesting that multiple models may together drive the
evolution of genes duplicated after WGDs [36]. Our
present study showed that the Hsf gene family has undergone specific expansion and been preferentially retained.
Rosaceae Hsf family genes possess shorter intron lengths
and higher GC and GC3 contents than the genome average, contain several highly conserved functional domain,
and present lower ka/ks ratios, corresponding to a slower
evolutionary rate. These results were consistent with previously obtained results [36], implying that Hsf genes have
been functionally stable over recent years and may serve as
good targets for dosage balance selection [50].
Pear and apple belong to the Maloideae, peach and
Chinese plum belong to the Prunoideae, and strawberry
belongs to the Rosoideae. The divergence of the Rosoideae
occurred prior to that of the Maloideae and Prunoideae.
Therefore, the Maloideae and Prunoideae have a closer
evolutionary relationship. Phylogenetic analysis of the Hsf
genes in the six Rosaceae species showed that PbHsfs,
MdHsfs, and PcHsfs were clustered together in the
phylogenetic tree, while PpHsfs and PmHsfs had a closer
relationship, as was consistent with the evolutionary
history among the three subfamilies. These observations
suggest that the expansion of these Hsf genes occurred
before the divergence of the Rosaceae species. Furthermore, the majority of the PbHsf genes were related
more closely to PtHsfs than to AtHsfs. This result may
be explained by the fact that both Pyrus and Populus
belong to the Fabids clade [61] and are both trees subjected to prolonged environmental stress. All three Hsf
classes (A, B, and C) identified in Populus, Arabidopsis,
and pear imply that the Hsf genes originated prior to
the divergence of the three species. Additionally, Hsf
members of the three classes have been detected in different lineages of monocots and dicots. In light of the
present results, we inferred that the expansion of the
Hsf gene family may have occurred in the common ancestor of angiosperms.
The functional diversification of Hsf genes has been
observed in several plant species. HsfA1a has been reported as a single master regulator gene in tomato [22].
AtHsfA1a and AtHsfA1b are known to be involved in the
early response to heat stress (HS) in Arabidopsis [62,63].
AtHsfA2 enhances and maintains the HS response when
plants are subjected to long-term or repeated cycles of
HS [64,65]. Previous data regarding Hsf expression in
apple trees exposed to naturally increased temperatures
are also available. For example, the A1-type MdHsf genes
are expressed at the same level regardless of temperature
in apple leaves, while MdHsfA2a-b, MdHsfA3b-c are
strongly induced by high temperature [32]. Similarly to
those of MdHsf genes, the transcriptional expression levels
of A1-type PbHsf genes showed no significant changes as
Qiao et al. BMC Plant Biology (2015) 15:12
plants were exposed to naturally increasing temperatures.
PbHsfA4a, PbHsfA5a, and PbHsfA8a were all strongly induced across the four stages of fruit development, indicating that the subclasses PbHsfA4, PbHsfA5, and PbHsfA8
were closely related with maintaining the heat shock response of pear trees subjected to high-temperature conditions. PbHsfA3a, PbHsfA4b, PbHsfA4d, and PbHsfA6a
were upregulated under naturally increased temperatures, implying that these genes play a critical role during heat stress response.
The members of the B class Hsf genes may act as transcription repressors or coactivators regulating acquired
thermotolerance during HS regimes [66-68]. The function
of class C Hsf genes has not yet been fully identified. Notably, PbHsfB1a and PbHsfB3c were highly expressed in all
four of the studied stages (S1, S2, S3, S4). PbHsfB1b and
PbHsfC1a were upregulated under rising temperature, suggesting that these genes may play important roles in the response to high temperatures in pear. However, further
investigations will be required to determine the functions
of class B and C Hsf genes in pear. Some PbHsf genes
showed unaltered or downregulated expression under increased temperatures, suggesting that these genes may operate at other signal transduction pathways in the complex
regulatory network of plant stress response [69,70]. We
also compared the expression levels of 13 duplicated gene
pairs in pear Hsf gene family; differences were detected
between the two members of each gene pair. This result
suggested that the duplicated genes exhibited significant
functional divergence regarding the response to heat stress.
Page 13 of 16
Conclusions
A total of 137 full-length Hsf genes were identified in
the six Rosaceae genomes, and the Chinese white pear
genome contained 29 Hsf genes. According to the structural characteristics of the proteins, phylogenetic analysis, and comparison with homologues from Populus
and Arabidopsis, the Hsf genes were grouped into three
classes (A, B, and C). Collinearity analysis suggested that
the recent WGD (30–45 MYA) may have driven the large
scale expansion of the Hsf gene family in Chinese white
pear and apple. Purifying selection is the major force acting upon Hsf family genes. EST and transcriptome sequencing analysis provided evidence of the identified PbHsf
genes and revealed that they play an important role in
heat stress response and fruit development. Considered
together, these results constitute a foundation for further
studies examining the functioning and complexity of the
Hsf gene family in the Rosaceae.
( [34]. The genome sequences of apple, peach, and strawberry were downloaded
from Phytozome ( />html#), and the European pear genome sequence was
download from the Genome Database for Rosaceae (GDR)
( The Chinese plum genome sequence was downloaded from the Prunus mume Genome
Project ( />Initially, the Arabidopsis Hsf protein sequences At4g17750
(class A), At4g36990 (class B), and AT3g24520 (class C)
downloaded from The Arabidopsis Information Resource
(TAIR) [71] ( were used as
queries to perform BLAST against the six Rosaceae genome databases. Additionally, the seed alignment file for
the Hsf domain (PF00447) obtained from the Pfam database [72] was used to build a HMM file using the
HMMER3 software package [73]. HMM searches were
then performed against the local protein databases of
the six Rosaceae species using HMMER3. A total of 185
candidate Hsf genes were identified from the six Rosaceae
species. Moreover, we checked the physical localizations
of all candidate Hsf genes and rejected redundant sequences with the same chromosome location. Furthermore, all obtained Hsf protein sequences were again
analyzed in the Pfam database to verify the presence of
DBD domains. DBD domains and coiled-coil structures
were also detected by the SMART and MARCOIL programs (SMART: MARCOIL: Those
protein sequences lacking the DBD domain or a coiledcoil structure were removed.
To identify signature domains, the PbHsf protein sequences were compared to the Hsf proteins of Arabidopsis
thaliana, Solanum lycopersicum, Populus trichocarpa, and
Malus domestica by amino acid sequence alignment using
ClustalW2 ( />The protein sequences of those four species were downloaded from Heatster ( />PredictNLS [74] and NetNES 1.1 [75] were also used to
predict NLS and NES domains, respectively. All fulllength amino acid sequences of the PbHsfs were also used
by the MEME tool [76] to identify conserved domain
motifs. The parameters were set as follows: maximum
numbers of different motifs, 30; minimum motif width,
6; maximum motif width, 50. Hsf names were assigned
based on the original nomenclature established for the
Arabidopsis thaliana Hsf family [13,24]. Classification
of the three different groups A, B, and C was based on
observations of the oligomerization domains [24].
Methods
Chromosomal location and gene structure of Hsfs
Identification and classification of Hsfs
The chromosomal location information of the Hsf genes
was obtained from genome annotation documents. The
data were then plotted using Circos software [77]. The
The Chinese white pear (Pyrus bretschneideri) genome
sequence was downloaded from the pear genome project
Qiao et al. BMC Plant Biology (2015) 15:12
gene structures of the Hsf genes were drawn using Gene
Structure Display Server [78].
Phylogenetic analysis
First, a neighbor joining phylogenetic tree was created
using the full-length protein sequences of Hsf from six
Rosaceae species. Second, another phylogenetic tree was
constructed using the N-terminal Hsf protein sequences
containing the DBD and HR-A/B regions and parts of
the linker between these two regions from Pyrus bretschneideri, Arabidopsis thaliana, and Populus trichocarpa
[24,33] using the NJ method in MEGA (version 6.0) [79].
NJ analysis was performed with the Poisson model. Bootstrap analysis was conducted with 1000 replicates to assess
the statistical support for each node.
Synteny analysis
The analysis of synteny among the six Rosaceae genomes was conducted locally using a method similar to
that developed for the PGDD (.
edu/duplication/) [80]. First, BLASTP was performed to
search for potential homologous gene pairs (E < 1 e−5,
top 5 matches) across multiple genomes. Then, these
homologous pairs were used as the input for MCScanX
to identify syntenic chains [81,82]. MCScanX was further
used to identify WGD/segmental, tandem, proximal and
dispersed duplications in the Hsf gene family.
Calculating Ka and Ks of the Hsf gene family
MCScanX downstream analysis tools were used to annotate the Ka and Ks substitution rates of syntenic gene
pairs. The mean Ks values of orthologous Hsf gene pairs
between Chinese white pear and the other Rosaceae
species were calculated using all homologous gene pairs
located in the same synteny block. KaKs_Calculator 2.0
was used to determine Ka and Ks [83]. To date segmental duplication events, six consecutive homologous gene
pairs on each side flanking the Hsf genes were chosen to
calculate the mean Ks. For those segments with fewer
than 12 homologous genes, all available anchor pairs were
used [46].
Expression analysis by ESTs
We conducted a local BLASTN against Chinese white
pear EST libraries to find the corresponding record for
each putative PbHsf genes using the following parameters: maximum identity > 95%, length > 200 bp, and Evalue <10−10.
Plant material and transcriptome sequencing
We conducted this experiment in 2012 on pear trees
(cultivar ‘Dangshansuli’) planted in the experimental orchard of the College of Horticulture at Nanjing Agricultural
University. Fruit samples were taken from homogeneous
Page 14 of 16
trees, and three biological replicates were collected. Pear
fruit were harvested between April and July 2012 from trees
grown under the natural variability of weather and climate.
Total RNA was extracted for RNA sequencing, and RNA
sequencing libraries were constructed using an Illumina
standard mRNASeq Prep Kit (TruSeq RNA and DNA
Sample Preparation Kits version 2). Transcriptome sequencing and assembly were performed on an Illumina
Hi-seq 2000 Sequencer.
Availability of supporting data
The data sets supporting the results of this article are included within the article and its additional files. The
phylogenetic data including data matrices, phylogenetic
trees, and analysis steps have been submitted to TreeBASE database under accession number 16806 (http://
purl.org/phylo/treebase/phylows/study/TB2:S16806). The
raw RNA-seq reads are available from the National Center
for Biotechnology Information repository under accession
PRJNA185970 ( />PRJNA185970). The EST datasets are available from the
pear genome project ( />
Additional files
Additional file 1: Location of Hsf genes in strawberry and Chinese
plum. Hsf genes in strawberry(FvHsf), and Chinese plum (PmHsf) were
mapped on the different chromosomes. Chromosome number is
indicated on the inner side and highlighted red short lines in the inner
circle correspond to different Hsf genes. Two genes with a syntenic
relationship were joined by the lines.
Additional file 2: Phylogenetic tree for Hsf genes of six Roseceae
species. 137 Hsf protein sequences were used, including 29 PbHsfs, 25
MdHsfs, 33 PcHsfs, 17 PpHsfs, 16 FvHsfs, 17 PmHsfs. A, B and C stands for
the three major groups of Hsf genes. Hsf genes were further classified
into 15 subgroups (A1, A2, A3, A4, A5, A6, A7, A8, A9, B1, B2, B3, B4,
B5, C). The abbreviations of species names are as follows: Pb, Chinese
white pear; Md, apple; Pp, peach; Fv, strawberry; Pm, Chinese plum; Pc,
European pear.
Additional file 3: Gene features of Hsf genes in five Rosaceae
species.
Additional file 4: Exon-intron structure of Hsfs genes in Chinese
white pear, peach, Chinese plum. Exons are indicated by the yellow
boxes. Introns are represented by black lines, and blue boxes represent
Untranslated Regions (UTR). Intron phase was showed by 0, 1, 2. The
capital letter (A, B, and C) and number after each gene name indicate the
subfamily to which it belongs.
Additional file 5: Exon-intron structures of Hsf genes in strawberry,
apple and European pear. Exons are indicated by the yellow boxes.
Introns are represented by black lines, and blue boxes represent
Untranslated Regions (UTR). Intron phase was showed by 0, 1, 2.
Additional file 6: Motif sequences identified by MEME tools in pear
Hsfs.
Additional file 7: Orthologous pairs of Hsf genes between any two
Rosaceae species.
Additional file 8: Synteny analysis of Hsf genes regions between
Chinese white pear and other Roseceae species.
Additional file 9: Ka/Ks ratios of paralogous genes among Hsf gene
family in Roseceae.
Qiao et al. BMC Plant Biology (2015) 15:12
Additional file 10: The ESTs for putative PbHsf genes.
Additional file 11: The RPKM (reads per kilobase per million) value
of Hsf genes expression in Chinese white pear.
Abbreviations
WGD: Whole-genome duplication; MYA: Million years ago; DBD: N-terminal
DNA binding domain; HR-A/B: Bipartite oligomerization domain; NLS: Nuclear
localization signal; NES: Nuclear export signal; CTAD: C-terminal activator
domain; HMM: Hidden Markov Model; NJ: Neighbor-joining; ML: Maximum
likelihood; RING: Really Interesting New Gene; WD40: Tryptophan-aspartic
acid 40; MEME: Multiple EM for Motif Elicitation; PGDD: Plant genome
duplication database; ESTs: Expressed sequence tags; GDR: Genome database
for Rosaceae; AP2/ERF: APETALA 2/ethylene-responsive element binding factor;
MADS: MINICHROMOSOME MAINTENANCE1, AGAMOUS, DEFICIENS and SERUM
RESPONSE FACTOR; NBS-LRR: Nucleotide-binding site-leucine-rich repeat.
Competing interests
The authors declare that they have no competing interests.
Authors’ contributions
QX carried out the experimental design and data analysis. LM designed the
experiment and revising the manuscript. LLT contributed to collinearity
analysis, perl script and some figures configuration. WJY and YH participated
in revising the final manuscript. ZSL managed the experiments. All authors
have read and approved the final manuscript.
Acknowledgements
The Project was supported by the Independent Innovation of Agricultural
Sciences in Jiangsu Province (CX(14)2020, CX(12)5079, CX(13)3010), the
National Natural Science Foundation of China (31301748), the National
High-tech R&D Program of China (2013AA102606-02), the National Key
Technology R&D Program of the Ministry of Science and Technology of
China (2014BAD16B03-4), the National Natural Science Foundation of China
(31301748), the Fundamental Research Funds for the Central Universities:
Science and Young scholar Technology Innovation Fund of Nanjing
Agricultural University (KJ2013014), and the China Postdoctoral Science
Foundation (2014M551607).
Received: 6 September 2014 Accepted: 22 December 2014
References
1. Wahid A, Gelani S, Ashraf M, Foolad M. Heat tolerance in plants: an
overview. Environ Exp Bot. 2007;61(3):199–223.
2. Allakhverdiev SI, Kreslavski VD, Klimov VV, Los DA, Carpentier R, Mohanty P.
Heat stress: an overview of molecular responses in photosynthesis.
Photosynth Res. 2008;98(1–3):541–50.
3. Boyer JS. Plant productivity and environment. Science. 1982;218(4571):443–8.
4. Mittler R. Abiotic stress, the field environment and stress combination.
Trends Plant Sci. 2006;11(1):15–9.
5. Hua J. From freezing to scorching, transcriptional responses to temperature
variations in plants. Curr Opin Plant Biol. 2009;12(5):568–73.
6. Ahuja I, de Vos RC, Bones AM, Hall RD. Plant molecular stress responses face
climate change. Trends Plant Sci. 2010;15(12):664–74.
7. Huang GT, Ma SL, Bai LP, Zhang L, Ma H, Jia P, et al. Signal transduction
during cold, salt, and drought stresses in plants. Mol Biol Rep. 2012;39
(2):969–87.
8. Century K, Reuber TL, Ratcliffe OJ. Regulating the regulators: the future
prospects for transcription-factor-based agricultural biotechnology products.
Plant Physiol. 2008;147(1):20–9.
9. Chauhan H, Khurana N, Agarwal P, Khurana P. Heat shock factors in rice
(Oryza sativa L.): genome-wide expression analysis during reproductive
development and abiotic stress. Mol Genet Genomics. 2011;286(2):171–87.
10. Chung E, Kim KM, Lee JH. Genome-wide analysis and molecular
characterization of heat shock transcription factor family in Glycine max.
J Genet Genomics. 2013;40(3):127–35.
11. Jin GH, Gho HJ, Jung KH. A systematic view of rice heat shock transcription
factor family using phylogenomic analysis. J Plant Physiol. 2013;170(3):321–9.
12. von Koskull-Döring P, Scharf K-D, Nover L. The diversity of plant heat stress
transcription factors. Trends Plant Sci. 2007;12(10):452–7.
Page 15 of 16
13. Scharf K-D, Berberich T, Ebersberger I, Nover L. The plant heat stress
transcription factor (Hsf) family: structure, function and evolution. Biochim
Biophys Acta. 2012;1819(2):104–19.
14. Kotak S, Larkindale J, Lee U, von Koskull-Döring P, Vierling E, Scharf K-D.
Complexity of the heat stress response in plants. Curr Opin Plant Biol.
2007;10(3):310–6.
15. Swindell WR, Huebner M, Weber AP. Transcriptional profiling of Arabidopsis heat
shock proteins and transcription factors reveals extensive overlap between heat
and non-heat stress response pathways. BMC Genomics. 2007;8(1):125.
16. Almoguera C, Rojas A, Diaz-Martin J, Prieto-Dapena P, Carranco R, Jordano J.
A seed-specific heat-shock transcription factor involved in developmental
regulation during embryogenesis in sunflower. J Biol Chem.
2002;277(46):43866–72.
17. Díaz-Martín J, Almoguera C, Prieto-Dapena P, Espinosa JM, Jordano J.
Functional interaction between two transcription factors involved in the
developmental regulation of a small heat stress protein gene promoter.
Plant Physiol. 2005;139(3):1483–94.
18. Kotak S, Vierling E, Bäumlein H, von Koskull-Döring P. A novel transcriptional
cascade regulating expression of heat stress proteins during seed
development of Arabidopsis. Plant Cell. 2007;19(1):182–95.
19. Nishizawa A, Yabuta Y, Yoshida E, Maruta T, Yoshimura K, Shigeoka S.
Arabidopsis heat shock transcription factor A2 as a key regulator in
response to several types of environmental stress. Plant J. 2006;48(4):535–47.
20. Miller G, Mittler R. Could heat shock transcription factors function as
hydrogen peroxide sensors in plants? Ann Bot. 2006;98(2):279–88.
21. Shim D, Hwang J-U, Lee J, Lee S, Choi Y, An G, et al. Orthologs of the class
A4 heat shock transcription factor HsfA4a confer cadmium tolerance in
wheat and rice. Plant Cell. 2009;21(12):4031–43.
22. Mishra SK, Tripp J, Winkelhaus S, Tschiersch B, Theres K, Nover L, et al. In the
complex family of heat stress transcription factors, HsfA1 has a unique
role as master regulator of thermotolerance in tomato. Genes Dev.
2002;16(12):1555–67.
23. Qin F, Kakimoto M, Sakuma Y, Maruyama K, Osakabe Y, Tran LS, et al.
Regulation and functional analysis of ZmDREB2A in response to drought
and heat stresses in Zea mays L. Plant J. 2007;50(1):54–69.
24. Nover L, Bharti K, Döring P, Mishra SK, Ganguli A, Scharf K-D. Arabidopsis
and the heat stress transcription factor world: how many heat stress
transcription factors do we need? Cell Stress Chaperones. 2001;6(3):177.
25. Baniwal SK, Bharti K, Chan KY, Fauth M, Ganguli A, Kotak S, et al. Heat stress
response in plants: a complex game with chaperones and more than
twenty heat stress transcription factors. J Biosci. 2004;29(4):471–87.
26. Döring P, Treuter E, Kistner C, Lyck R, Chen A, Nover L. The role of AHA
motifs in the activator function of tomato heat stress transcription factors
HsfA1 and HsfA2. Plant Cell. 2000;12(2):265–78.
27. Harrison CJ, Bohm AA, Nelson H. Crystal structure of the DNA binding
domain of the heat shock transcription factor. Science. 1994;263(5144):224–7.
28. Peteranderl R, Rabenstein M, Shin Y-K, Liu CW, Wemmer DE, King DS, et al.
Biochemical and biophysical characterization of the trimerization domain
from the heat shock transcription factor. Biochemistry. 1999;38(12):3559–69.
29. Morimoto RI. Regulation of the heat shock transcriptional response: cross
talk between a family of heat shock factors, molecular chaperones, and
negative regulators. Genes Dev. 1998;12(24):3788–96.
30. Pirkkala L, Nykänen P, Sistonen L. Roles of the heat shock transcription
factors in regulation of the heat shock response and beyond. FASEB J.
2001;15(7):1118–31.
31. Guo J, Wu J, Ji Q, Wang C, Luo L, Yuan Y, et al. Genome-wide analysis of
heat shock transcription factor families in rice and Arabidopsis. J Genet
Genomics. 2008;35(2):105.
32. Giorno F, Guerriero G, Baric S, Mariani C. Heat shock transcriptional factors in
Malus domestica: identification, classification and expression analysis. BMC
Genomics. 2012;13(1):1–13.
33. Wang F, Dong Q, Jiang H, Zhu S, Chen B, Xiang Y. Genome-wide analysis of
the heat shock transcription factors in Populus trichocarpa and Medicago
truncatula. Mol Biol Rep. 2012;39(2):1877–86.
34. Wu J, Wang Z, Shi Z, Zhang S, Ming R, Zhu S, et al. The genome of the pear
(Pyrus bretschneideri Rehd.). Genome Res. 2013;23(2):396–408.
35. Potter D, Eriksson T, Evans RC, Oh S, Smedmark J, Morgan DR, et al.
Phylogeny and classification of Rosaceae. Plant Syst Evol. 2007;266(1):5–43.
36. Wk J, Yl L, Xia E, Lz G. Prevalent role of gene features in determining
evolutionary fates of whole-genome duplication duplicated genes in
flowering plants. Plant Physiol. 2013;161(4):1844–61.
Qiao et al. BMC Plant Biology (2015) 15:12
37. Wang Y, You FM, Lazo GR, Luo M-C, Thilmony R, Gordon S, et al. PIECE: a
database for plant gene structure comparison and evolution. Nucleic Acids
Res. 2013;41(D1):D1159–66.
38. Maher C, Stein L, Ware D. Evolution of Arabidopsis microRNA families
through duplication events. Genome Res. 2006;16(4):510–9.
39. Velasco R, Zharkikh A, Affourtit J, Dhingra A, Cestaro A, Kalyanaraman A,
et al. The genome of the domesticated apple (Malus x domestica Borkh.).
Nat Genet. 2010;42(10):833–9.
40. Fawcett JA, Maere S, Van de Peer Y. Plants with double genomes might
have had a better chance to survive the Cretaceous–Tertiary extinction
event. Proc Natl Acad Sci. 2009;106(14):5737–42.
41. Jaillon O, Aury JM, Noel B, Policriti A, Clepet C, Casagrande A, et al. The
grapevine genome sequence suggests ancestral hexaploidization in major
angiosperm phyla. Nature. 2007;449(7161):463–7.
42. Shulaev V, Sargent DJ, Crowhurst RN, Mockler TC, Folkerts O, Delcher AL,
et al. The genome of woodland strawberry (Fragaria vesca). Nat Genet.
2010;43(2):109–16.
43. Verde I, Abbott AG, Scalabrin S, Jung S, Shu SQ, Marroni F, et al. The
high-quality draft genome of peach (Prunus persica) identifies unique
patterns of genetic diversity, domestication and genome evolution. Nat
Genet. 2013;45(5):487–U447.
44. Lemoine F, Lespinet O, Labedan B. Assessing the evolutionary rate of
positional orthologous genes in prokaryotes using synteny data. BMC Evol
Biol. 2007;7(1):237.
45. Jun J, Mandoiu II, Nelson CE. Identification of mammalian orthologs using
local synteny. BMC Genomics. 2009;10(1):630.
46. Du D, Cheng T, Pan H, Yang W, Wang J, Zhang Q. Genome-wide identification,
molecular evolution and expression analyses of the phospholipase D gene
family in three Rosaceae species. Sci Hortic. 2013;153:13–21.
47. Starr TK, Jameson SC, Hogquist KA. Positive and negative selection of T
cells. Annu Rev Immunol. 2003;21(1):139–76.
48. Yang Z. PAML 4: phylogenetic analysis by maximum likelihood. Mol Biol
Evol. 2007;24(8):1586–91.
49. Zhang Q, Chen W, Sun L, Zhao F, Huang B, Yang W, et al. The genome of
Prunus mume. Nat Commun. 2012;3:1318.
50. Freeling M. Bias in plant gene content following different sorts of
duplication: tandem, whole-genome, segmental, or by transposition. Annu
Rev Plant Biol. 2009;60:433–53.
51. Wang YP, Wang XY, Tang HB, Tan X, Ficklin SP, Feltus FA, et al. Modes of
gene duplication contribute differently to genetic novelty and redundancy,
but show parallels across divergent angiosperms. PLoS One. 2011;6(12):e28150.
52. Wang N, Xiang Y, Fang L, Wang Y, Xin H, Li S. Patterns of gene duplication
and their contribution to expansion of gene families in grapevine. Mol Biol
Rep. 2013;31(4):852–61.
53. Guo C, Guo R, Xu X, Gao M, Li X, Song J, et al. Evolution and expression
analysis of the grape (Vitis vinifera L.) WRKY gene family. J Exp Bot.
2014;65(6):1513–28.
54. Du D, Hao R, Cheng T, Pan H, Yang W, Wang J, et al. Genome-wide analysis
of the AP2/ERF gene family in Prunus mume. Plant Mol Biol Rep.
2012;31(3):741–50.
55. Maere S, De Bodt S, Raes J, Casneuf T, Van Montagu M, Kuiper M, et al.
Modeling gene and genome duplications in eukaryotes. Proc Natl Acad Sci
U S A. 2005;102(15):5454–9.
56. Lin Y-X, Jiang H-Y, Chu Z-X, Tang X-L, Zhu S-W, Cheng B-J. Genome-wide
identification, classification and analysis of heat shock transcription factor
family in maize. BMC Genomics. 2011;12(1):76.
57. Sémon M, Wolfe KH. Consequences of genome duplication. Curr Opin
Genet Dev. 2007;17(6):505–12.
58. Blanc G, Wolfe KH. Functional divergence of duplicated genes formed by
polyploidy during Arabidopsis evolution. Plant Cell. 2004;16(7):1679–91.
59. Seoighe C, Gehring C. Genome duplication led to highly selective
expansion of the Arabidopsis thaliana proteome. Trends Genet.
2004;20(10):461–4.
60. Innan H, Kondrashov F. The evolution of gene duplications: classifying and
distinguishing between models. Nat Rev Genet. 2010;11(2):97–108.
61. Judd WS, Olmstead RG. A survey of tricolpate (eudicot) phylogenetic
relationships. Am J Bot. 2004;91(10):1627–44.
62. Busch W, Wunderlich M, Schöffl F. Identification of novel heat shock
factor‐dependent genes and biochemical pathways in Arabidopsis thaliana.
Plant J. 2005;41(1):1–14.
Page 16 of 16
63. Lohmann C, Eggers-Schumacher G, Wunderlich M, Schöffl F. Two different
heat shock transcription factors regulate immediate early expression of
stress genes in Arabidopsis. Mol Gen Genomics. 2004;271(1):11–21.
64. Y-y C, H-c L, N-y L, W-t C, C-n W, S-h C, et al. A heat-inducible transcription
factor, HsfA2, is required for extension of acquired thermotolerance in
Arabidopsis. Plant Physiol. 2007;143(1):251–62.
65. Meiri D, Breiman A. Arabidopsis ROF1 (FKBP62) modulates thermotolerance
by interacting with HSP90. 1 and affecting the accumulation of HsfA2‐
regulated sHSPs. Plant J. 2009;59(3):387–99.
66. Czarnecka-Verner E, Yuan C-X, Scharf K-D, Englich G, Gurley WB. Plants
contain a novel multi-member class of heat shock factors without
transcriptional activator potential. Plant Mol Biol. 2000;43(4):459–71.
67. Ikeda M, Mitsuda N, Ohme-Takagi M. Arabidopsis HsfB1 and HsfB2b act as
repressors of the expression of heat-inducible Hsfs but positively regulate
the acquired thermotolerance. Plant Physiol. 2011;157(3):1243–54.
68. Bharti K, von Koskull-Döring P, Bharti S, Kumar P, Tintschl-Körbitzer A, Treuter
E, et al. Tomato heat stress transcription factor HsfB1 represents a novel
type of general transcription coactivator with a histone-like motif
interacting with the plant CREB binding protein ortholog HAC1. Plant Cell.
2004;16(6):1521–35.
69. Mittal D, Chakrabarti S, Sarkar A, Singh A, Grover A. Heat shock factor gene
family in rice: genomic organization and transcript expression profiling in
response to high temperature, low temperature and oxidative stresses.
Plant Physiol Biochem. 2009;47(9):785–95.
70. Victor M, Benecke B-J. Expression levels of heat shock factors are not
functionally coupled to the rate of expression of heat shock genes. Mol Biol
Rep. 1998;25(3):135–41.
71. Swarbreck D, Wilks C, Lamesch P, Berardini TZ, Garcia-Hernandez M, Foerster H,
et al. The Arabidopsis Information Resource (TAIR): gene structure and function
annotation. Nucleic Acids Res. 2008;36 suppl 1:D1009–14.
72. Finn RD, Mistry J, Tate J, Coggill P, Heger A, Pollington JE, et al. The Pfam
protein families database. Nucleic Acids Res. 2010;38 suppl 1:D211–22.
73. Eddy SR. Accelerated Profile HMM Searches. PLoS Comput Biol.
2011;7(10):e1002195.
74. Cokol M, Nair R, Rost B. Finding nuclear localization signals. EMBO Rep.
2000;1(5):411–5.
75. La Cour T, Kiemer L, Mølgaard A, Gupta R, Skriver K, Brunak S. Analysis and
prediction of leucine-rich nuclear export signals. Protein Eng Des Sel.
2004;17(6):527–36.
76. Bailey TL, Williams N, Misleh C, Li WW. MEME: discovering and analyzing DNA
and protein sequence motifs. Nucleic Acids Res. 2006;34 suppl 2:W369–73.
77. Krzywinski M, Schein J, Birol İ, Connors J, Gascoyne R, Horsman D, et al.
Circos: an information aesthetic for comparative genomics. Genome Res.
2009;19(9):1639–45.
78. Guo A-Y, Zhu Q-H, Chen X, Luo J-C. GSDS: a gene structure display server.
Yi Chuan. 2007;29(8):1023.
79. Tamura K, Stecher G, Peterson D, Filipski A, Kumar S. MEGA6: Molecular
Evolutionary Genetics Analysis version 6.0. Mol Biol Evol. 2013;30(12):2725–9.
80. Lee TH, Tang HB, Wang XY, Paterson AH. PGDD: a database of gene and
genome duplication in plants. Nucleic Acids Res. 2013;41(D1):D1152–8.
81. Tang HB, Wang XY, Bowers JE, Ming R, Alam M, Paterson AH. Unraveling
ancient hexaploidy through multiply-aligned angiosperm gene maps.
Genome Res. 2008;18(12):1944–54.
82. Wang YP, Tang HB, DeBarry JD, Tan X, Li JP, Wang XY, et al. MCScanX: a
toolkit for detection and evolutionary analysis of gene synteny and
collinearity. Nucleic Acids Res. 2012;40(7):e49.
83. Wang D, Zhang Y, Zhang Z, Zhu J, Yu J. KaKs_Calculator 2.0: a toolkit
incorporating gamma-series methods and sliding window strategies.
Genomics Proteomics Bioinformatics. 2010;8(1):77–80.