Transcriptomic analysis of differentially expressed genes in an orange-pericarp mutant and wild type in pummelo (Citrus grandis)
Bạn đang xem bản rút gọn của tài liệu. Xem và tải ngay bản đầy đủ của tài liệu tại đây (3.05 MB, 12 trang )
Guo et al. BMC Plant Biology (2015) 15:44
DOI 10.1186/s12870-015-0435-3
RESEARCH ARTICLE
Open Access
Transcriptomic analysis of differentially expressed
genes in an orange-pericarp mutant and wild type
in pummelo (Citrus grandis)
Fei Guo, Huiwen Yu, Qiang Xu and Xiuxin Deng*
Abstract
Background: The external colour of fruit is a crucial quality feature, and the external coloration of most citrus fruits
is due to the accumulation of carotenoids. The molecular regulation of carotenoid biosynthesis and accumulation
in pericarp is limited due to the lack of mutant. In this work, an orange-pericarp mutant (MT) which showed altered
pigmentation in the pericarp was used to identify genes potentially related to the regulation of carotenoid
accumulation in the pericarp.
Results: High Performance Liquid Chromatography (HPLC) analysis revealed that the pericarp from MT fruits had
a 10.5-fold increase of β-carotene content over that of the Wild Type (WT). Quantitative real-time PCR (qRT-PCR)
analysis showed that the expression of all downstream carotenogenic genes was lower in MT than in WT, suggesting
that down-regulation is critical for the β-carotene increase in the MT pericarp. RNA-seq analysis of the transcriptome
revealed extensive changes in the MT gene expression level, with 168 genes down-regulated and 135 genes
up-regulated. Gene ontology (GO) and KEGG pathway analyses indicated seven reliable metabolic pathways are
altered in the mutant, including carbon metabolism, starch and sucrose metabolism and biosynthesis of amino
acids. The transcription factors and genes corresponding to effected metabolic pathways may involved in the
carotenoid regulation was confirmed by the qRT-PCR analysis in the MT pericarp.
Conclusions: This study has provided a global picture of the gene expression changes in a novel mutant with
distinct color in the fruit pericarp of pummelo. Interpretation of differentially expressed genes (DEGs) revealed new
insight into the molecular regulation of β-carotene accumulation in the MT pericarp.
Keywords: Citrus, RNA-seq, Transcriptome profile, Carotenoid, qRT-PCR
Background
Citrus is one of the most important fruit crops with
great economic significance and value for humans in the
world [1]. As a crucial quality feature, the external colour
of citrus fruit first attracts the attention of consumers, and
uniform bright coloration will enhance the fruit attractiveness and consumers’ acceptance. The external and internal
coloration of most citrus fruits is due to the accumulation
of carotenoids [2].
Carotenoids play indispensable roles in plants as components for all photosynthetic organisms and protectors
against oxidation by quenching triplet chlorophyll, singlet
* Correspondence:
Key Laboratory of Horticultural Plant Biology (Ministry of Education),
Huazhong Agricultural University, Wuhan 430070, China
oxygen, and superoxide anion radicals [3]. In higher plants,
carotenoids provide flowers and fruits with distinct colors,
ranging from yellow to orange or red, to attract insects and
animals for pollination as well as seed dispersal [4,5].
Carotenoids also serve as precursors of the phytohormones
abscisic acid (ABA), strigolactones, and other signalling
molecules [6-8]. Some carotenoids are the precursors of
vitamin A that cannot be artificially synthesized and therefore are essential nutritional components for animals and
humans [9]. Moreover, they also have beneficial effects on
human health, including enhancement of the immune
system and reduction of the risk for degenerative diseases such as cancer, cardiovascular diseases and cataract [10-12]. Today, carotenoids are extensively used in
health and nutritional products as important micronutrients [10].
© 2015 Guo et al.; licensee BioMed Central. This is an Open Access article distributed under the terms of the Creative
Commons Attribution License ( which permits unrestricted use, distribution, and
reproduction in any medium, provided the original work is properly credited. The Creative Commons Public Domain
Dedication waiver ( applies to the data made available in this article,
unless otherwise stated.
Guo et al. BMC Plant Biology (2015) 15:44
Carotenoids are naturally synthesized in chloroplasts
and chromoplasts by enzymes that are nuclear encoded
[13]. In higher plants, structural genes of the carotenoid
biosynthesis pathway have been isolated and characterized
[14-18]. The first committed step of carotenoid biosynthesis is a head-to-head condensation of two molecules of
a C20 precursor, geranylgeranyl pyrophosphate (GGPP),
to form colourless phytoene catalyzed by the phytoene
synthase (PSY). Next, the colourless phytoene is converted
into the red lycopene by four desaturation reactions
(catalyzed by phytoene desaturase, PDS, and ζ-carotene
desaturase, ZDS) and (or) by two isomerization reactions mediated by carotene isomerase (CRTISO) and 15cis-ζ-carotene isomerase (ZISO). Then, the lycopene
flux branches into two pathways via cyclization reaction.
Lycopene β-cyclase (LCYB) adds two β-rings to the ends
of lycopene molecule to form β-carotene, while the coaction of LCYb and lycopene ε-cyclase (LCYe) generates
α-carotene with one β-ring and one ε-ring. Subsequently,
α-carotene is converted into lutein by hydroxylations catalyzed by ε-ring hydroxylase and β-ring hydroxylase (BCH).
Then, zeaxanthin and violaxanthin are generated from βcarotene with hydroxylation reactions catalyzed by HYb
and epoxydation catalyzed by zeaxanthin epoxidase (ZEP).
The plant hormone ABA is an end product of the carotenoid biosynthetic pathway generated by the enzymatic
cleavage of 9-cis-epoxycarotenoid dioxygenase (NCEDs).
Carotenoid cleavage dioxygenases (CCDs) cleave carotenoids into apocarotenoids at different double-bond positions.
In the last decade, due to the importance of carotenoids,
many efforts have been made to understand the molecular basis of the regulation of carotenoid biosynthesis
and accumulation.
Citrus is a complex source of carotenoids, with the
largest number of carotenoid species found in any one
fruit [19]. More than 115 different carotenoids have been
identified in the pericarp and pulp of citrus, including
lycopene, β-carotene, β-cryptoxanthin, zeaxanthin, and
violaxanthin [20]. Because of the large diversity of carotenoid patterns, citrus has become an important model species for studies on plant carotenoid metabolism [19,21],
such as the analyses of carotenoid composition and content, and expression of the main carotenoid biosynthetic
genes [22-26]. Mutants with alteration in the carotenoid
biosynthetic pathway have proven to be useful experimental materials for identifying molecular mechanisms regulating the process [27]. In the past few years, many pulp
mutants have been identified in grapefruit (Citrus paradisi) and orange (Citrus sinensis), such as Red marsh,
Shara, Cara Cara, and Hong Anliu [28-32], and these
mutants have been used to study the complex regulatory
mechanism of carotenoid biosynthesis at the gene and/or
protein expression level [33-37], facilitating the understanding of the carotenoid regulation mechanism in the
Page 2 of 12
pulp of citrus [38-41]. Due to the lack of mutants affected in the pericarp, the carotenoid regulation mechanism was less studied in pericarp compared with the
pulp of citrus. Recently, an orange-pericarp mutant (MT)
originating from Guanxi pummelo has been discovered in
China and provided us a potential material for studying
this regulation mechanism.
In this study, we investigated the composition and level
of carotenoids and the expression of carotenoid biosynthetic genes in the pericarps of MT and wild type (WT) in
the ripe stage. From the whole genome perspective, the
differentially expressed genes (DEGs) in MT and WT were
identified using the RNA-seq technology. The identified
genes provide useful information for studying the molecular
mechanism of carotenoid biosynthesis in citrus pericarp.
Results
β-carotene is significantly accumulated in the MT
The pummelo MT was originally found in an orchard in
Zhangzhou (Fujian, China) in the 2010s as a spontaneous
bud mutation from the commercial variety of ‘guanxi’
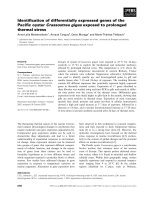
pummelo. An obvious phenotypic change of the MT is
the orange colour of the pericarp, showing a sharp contrast with the slight yellow colour of the mature pericarp
in the WT fruit (Figure 1A, B). The orange-pericarp mutant was propagated by grafting onto different rootstocks
and retained the stable phenotype of the orange-colour
pericarp under field conditions, and no reversion to the
parental phenotype has been observed so far. Moreover,
73 pairs of Simple Sequence Repeat (SSR) markers were
used to evaluate the genetic background of the mutant.
All the SSR patterns were the same between MT and
WT (Additional file 1), indicating that the two genotypes shared an identical genetic background.
To characterize the phenotype differences between MT
and WT, the carotenoid composition and content of mature fruits were analysed by High Performance Liquid
Chromatography (HPLC). The most obvious difference in
carotenoid between MT and WT pericarps was β-carotene
content (Figure 1C, D). The β-carotene content of MT
was about 10.5-fold that of the WT, accounting for 90.0%
of the total identified carotenoids in MT. Additionally, the
total carotenoid concentration of MT was 7.9-fold that of
WT. Moreover, the concentrations of lutein, violaxanthin,
α-carotene and β-cryptoxanthin were higher in MT
than in WT. However, in the MT and WT pulps, the carotenoid species and content were similar to each other
(Additional file 2).
Three carotenogenic genes involved in β-carotene
degradation are significantly down-regulated in the MT
Firstly, we compared the sequence information of the carotenoid biosynthetic genes in MT and WT and isolated
full-length cDNAs, including ggps, psy, pds, crtiso, lcyb,
Guo et al. BMC Plant Biology (2015) 15:44
Page 3 of 12
Figure 1 The phenotype and carotenoid content in the WT and MT. (A, B) Appearances of MT and WT fruits at maturation. (C, D) Carotenoid
profiles and concentrations in the pericarps of WT and MT at fruit maturation. The bar represents 2 cm.
lcye, lcy2b, ccd4c, bch, nced2 and nced3. The result
showed that the sequences were 100% identical between
MT and WT (Additional file 3). These 11 sequence data
were submitted to the GenBank with accession numbers
from KP462725 to KP462735. Then, the effect of the
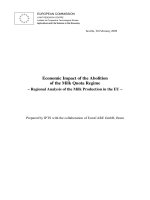
mutation on carotenogenic gene expression was examined by quantitative real-time PCR (qRT-PCR) using the
probes of pummelo cDNAs encoding GGPS, PSY, PDS,
ZDS, CRTISO, LCYb, LCYe, LCY2b, CCD1, CCD4a,
CCD4c, BCH, NCED2, NCED3 and ZEP (Figure 2). The
expression levels of upstream carotenogenic genes (ggps,
zds and crtiso) in MT and WT were almost the same.
However, the gene expression level of psy, pds and lcy2b
was much higher in WT than in MT. The expression level
of all downstream carotenogenic genes was lower in MT
than in WT. Particularly, ccd1, bch and nced2 showed significantly reduced transcript levels in the MT pericarp.
RNA-seq and global detection of DEGs
Solexa/Illumina RNA-Seq analysis was performed to identify the genes involved in the regulation of carotenoid
biosynthesis in pummelo pericarp. Six libraries were
constructed and sequenced, including three biological
replicates for WT (termed as WT1, WT2 and WT3)
and three biological replicates for MT (termed as MT1,
MT2 and MT3). The major characteristics of these
six libraries are summarized in Table 1. A sequencing
depth of over thirteen million raw tags was obtained for
each of the six libraries, with the number of raw tags
ranging from 13,520,581 to 16,301,802. After filtration,
we obtained a total of 13,347,784 (WT1), 14,532,229
(WT2) and 15,027,468 (WT3) clean tags for the WT
RNA-Seq libraries and 16084513 (MT1), 14223118
(MT2) and 14025066 (MT3) clean tags for the MT
RNA-Seq libraries, with the clean tags accounting for
more than 98% of the total, which were then mapped to
the sweet orange genome [42]. These reads were deposited in NCBI GEO database with an accession no.
GSE64764. In the MT and WT samples, 76.0% (MT1),
76.5% (MT2), 76.4% (MT3), 75.9% (MT1), 76.4% (WT2)
and 75.4% (WT3) of the clean tags from RNA-Seq data
were mapped uniquely to the genome, while a small
Guo et al. BMC Plant Biology (2015) 15:44
Page 4 of 12
Figure 2 Expression of carotenogenic genes in the pericarps of WT and MT at fruit maturation.
proportion of them were mapped multiply to the genome (Table 2).
Differentially expressed tags in the samples were identified by calculating the number of unambiguous tags for
each gene and then normalizing this to the number of
reads per kilobase of exon model per million mapped
reads (RPKM). All the uniquely mapped reads were used
for calculating the RPKM values of the genes. Genes
within the RPKM range of 0–3 were considered to be
expressed at low level; genes within the RPKM range of
3–15 were considered to be expressed at medium level;
and genes beyond a RPKM value of 15 were considered
to be expressed at high level [43]. Low-level expressed
genes covered the highest percentage in MT and WT. The
Guo et al. BMC Plant Biology (2015) 15:44
Page 5 of 12
Table 1 Summary of sequence assembly after Illumina sequencing
Sample name
Raw reads
Clean reads
Clean bases
Error rate (%)
Q20 (%)
Q30 (%)
GC content (%)
MT1
16301802
16084513
1.61G
0.03
97.25
91.76
43.5
MT2
14403818
14223118
1.42G
0.03
97.27
91.76
43.44
MT3
14197855
14025066
1.4G
0.03
97.31
91.87
43.53
WT1
13520581
13347784
1.33G
0.03
97.23
91.68
43.6
WT2
14715034
14532229
1.45G
0.03
97.29
91.82
43.49
WT3
15229307
15027468
1.5G
0.03
97.28
91.82
43.42
Q20: The percentage of bases with a Phred value > 20.
Q30: The percentage of bases with a Phred value > 30.
DEGs in the MT samples were identified at padj < 0.05,
obtaining a total of 303 significantly DEGs, with 135 upregulated and 168 down-regulated (Additional file 4). The
details of these genes are listed in Additional file 5.
were assigned to 52 KEGG pathways. Among the pathways, carbon metabolism, starch and sucrose metabolism, biosynthesis of amino acids, and a few others were
highly represented (Table 3).
Annotation of DEGs in MT and WT
Verification of DEGs
These DEGs may be involved in different functions. Gene
ontology (GO) is an international standardized gene functional classification system that describes the properties of
genes and their products in any organism. To understand
the functions of the 303 DEGs, we mapped them to the
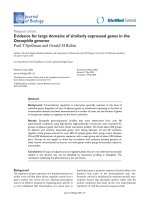
three GO ontologies, including molecular function, cellular component, and biological process (Figure 3). According to cellular component, the most abundant DEGs were
involved in “membrane” (9.2%), “cell” (5.3%) and “cell
part” (5.3%). From the perspective of biological process,
the DEGs were involved in “metabolic process” (28.4%),
“cellular process” (20.8%), “organic substance metabolic
process” (18.5%), “primary metabolic process” (17.8%) and
“cellular metabolic process” (13.9%). In terms of molecular
function, the genes were dominant in “catalytic activity”
(31.4%), “binding” (24.4%), “ion binding” (15.5%), “heterocyclic compound binding” (13.5%) and “organic cyclic
compound binding” (13.5%). In addition, the whole genome background was examined by GO category enrichment analysis (P-value ≤ 0.05). Three cellular component
terms were significantly enriched in the up-regulated
genes, including microtubule cytoskeleton, cytoskeletal
part and cytoskeleton. To further understand the biological functions of these genes, KEGG (http://www.
genome.jp/kegg/) ontology assignments were used to
classify their functional annotations. All the 303 DEGs
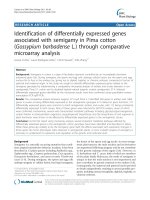
A total of 22 DEGs were selected for qRT-PCR verification. Among them, 10 were referred to as the differentially expressed transcription factors. The other 12 genes
belonged to the affected pathways including sugar metabolism and amino acid metabolism. The results showed
that 19 out of the 22 differentially expressed genes in MT
and WT were in consistency with the RNA-seq data
(Figure 4). Linear regression [(RNA-seq value) = a(qRTPCR value) + b] analysis of these 19 DEGs showed an
overall correlation coefficient of 0.78, indicating a good
correlation between the transcription profile revealed by
RNA-seq data and the transcript abundance assayed by
qRT-PCR (Additional file 6). These results confirmed the
reliability of the RNA-seq data.
Changes in fruit soluble sugar, amino acid, and fatty acid
content
Considering the singificant expression change in a
number of MT genes implicated in starch and sucrose
metabolism as well as the biosynthesis of amino acids
and fatty acids, the content of these metabolites was determined by the GC-MS analysis (Table 4). The results
showed that the content of most sugars in MT was
lower than that in WT, such as sucrose, glucose, fructose and mannose. Additionally, the MT pericarp, when
compared with the WT pericarp, showed a decrease in
Table 2 Summary of clean reads mapped to the reference genome
Sample name
MT1
MT2
MT3
WT1
WT2
WT3
Total reads
16084513
14223118
14025066
13347784
14532229
15027468
Total mapped
12712188 (79.03%)
11321201 (79.6%)
11196989 (79.84%)
10593747 (79.37%)
11554004 (79.51%)
11856432 (78.9%)
Multiple mapped
492073 (3.06%)
437971 (3.08%)
477365 (3.4%)
466493 (3.49%)
455224 (3.13%)
532109 (3.54%)
Uniquely mapped
12220115 (75.97%)
10883230 (76.52%)
10719624 (76.43%)
10127254 (75.87%)
11098780 (76.37%)
11324323 (75.36%)
Non-splice reads
8768392 (54.51%)
7846392 (55.17%)
7591808 (54.13%)
7219051 (54.08%)
7991617 (54.99%)
8176531 (54.41%)
Splice reads
3451723 (21.46%)
3036838 (21.35%)
3127816 (22.3%)
2908203 (21.79%)
3107163 (21.38%)
3147792 (20.95%)
Guo et al. BMC Plant Biology (2015) 15:44
Page 6 of 12
Figure 3 Histogram of gene ontology classification. The results are summarized in three main categories: molecular function, biological
process and cellular component. The right Y-axis indicates the number of genes in a category. The left Y-axis indicates the percentage of a
specific category of genes in that main category.
the levels of four types of amino acids (proline, serine,
threonine and GABA), but an increase in the levels of
another four types of amino acids (lysine, valine, asparagine and aspartic acid). Interestingly, we detected an
amount of asparagine in MT but trace in WT. We also
detected four fatty acids in WT and MT pericarps. The
content of octadecanoic acid and hexadecanoic acid
was significantly lower in the MT pericarp than in the
WT pericarp.
Discussion
The mutant used in this study is derived from a spontaneous mutation in Guanxi pummel, and the mutation
confers a novel phenotype that is regulated in a fruitspecific pattern, with the pericarp exhibiting obvious orange colour. The distinctive orange colour in the mutant
pericarp has clearly been shown to be due to the massive
accumulation of β-carotene. The β-carotene accumulation induced by the mutation also leads to an obvious
increase of total carotenoids in the MT. In the past few
years, many citrus carotenoid mutants have been discovered, but almost all of them show the red-fleshed phenotype and have proved to accumulate abnormal lycopene.
Therefore, the pummelo MT identified in this study is a
special material for the citrus carotenoid regulation study,
particularly for the investigation of pigmentation regulation in pericarp. Previous studies on carotenoid biosynthesis in red-fleshed mutant concluded that the induction
of lycopene accumulation coincided with increased expression of upstream carotenogenic genes and reduced expression of genes downstream of lycopene synthesis [30].
We hypothesized that the mechanism regulating the βcarotene accumulation was coincident with that of lycopene. As expected, the downstream genes of β-carotene
degradation in the carotenoid biosynthetic pathway (ccd1,
ccd4a, ccd4c, bch, nced2, nced3 and zep) exhibited a decreased expression level in MT. Previous studies in potato
tubers found that silencing the bch gene can significantly
Table 3 Important KEGG pathways with more than 3 DEGs
KEGG pathway
Sample number Gene ID
Carbon metabolism
5
Serine hydroxymethyltransferase, Cysteine synthase, L-3-cyanoalanine synthase 2,
Glyceraldehyde-3-phosphate dehydrogenase A, D-3-phosphoglycerate dehydrogenase
Starch and sucrose metabolism
4
Pectinesterase 3, sucrose-phosphate synthase 4, Pectinesterase 2, Alpha-1,4 glucan
phosphorylase L-1 isozyme
Biosynthesis of amino acids
4
Serine hydroxymethyltransferase, Cysteine synthase, L-3-cyanoalanine synthase 2,
D-3-phosphoglycerate dehydrogenase
Cyanoamino acid metabolism
3
Serine hydroxymethyltransferase, L-3-cyanoalanine synthase 2, Gammaglutamyltranspeptidase 3
Pentose and glucuronate interconversions 3
Pectate lyase 5, Pectinesterase 3, Pectinesterase 2
Phagosome
3
Tubulin beta-1 chain, Tubulin alpha chain, Tubulin alpha chain, Tubulin beta-4 chain
Cysteine and methionine metabolism
3
Cysteine synthase, L-3-cyanoalanine synthase 2, 1-aminocyclopropane-1-carboxylate
synthase
Guo et al. BMC Plant Biology (2015) 15:44
Page 7 of 12
Figure 4 RT-PCR analyses of differentially expressed genes corresponding to metabolic pathways and transcription factors in MT and
WT. The transcript abundance from RNA-seq data was added on the top of each gene. RPKM, reads per kilo bases per million reads.
enhance β-carotene levels [44,45]. In maize, the bch alleles
associated with reduced transcript expression also correlate with higher β-carotene concentrations [46]. In our
research, the expression of bch in the WT was 1.58 fold
that of the MT, indicating that the significantly reduced
expression of bch may result in the amount accumulation
of β-carotene in the MT pericarp. However, our analyses
failed to find a dramatic increased expression of upstream
carotenogenic genes in MT when compared with WT.
Three key enzymes (psy, lcy2b and lcyb) for the βcarotene accumulation exhibited an obvious decrease in
MT expression. These results implied that the MT exerted
a major effect on β-carotene accumulation via the downregulation of downstream genes, especially bch.
To understand the potential mechanisms involved in
the regulation of carotenoid biosynthesis in the citrus
pericarp, we used the RNA-seq approach to investigate
the transcriptome profiles in MT and WT. Our analysis
showed that a total of 303 genes altered expression pattern. Similar results have been reported in several studies on mutant–progenitor pairs [33,36,37]. GO analysis
of annotated genes revealed that most of the DEGs were
involved in catalytic activity and metabolic process
(Figure 3). Because carotenoid biosynthesis which belonging to the secondary metabolisms is a dynamic and
complex process catalyzed by a series of enzymes. Functional category analysis revealed that the DEGs are involved in a number of important pathways (Table 3),
such as the metabolic pathways, which is consistent with
the GO results that large numbers of genes are implicated
Table 4 Accumulated sugars, amino acids and fatty acids
in MT and WT pericarps
Sugars
Amino acids
Fatty acids
MT (mg/g)
WT(mg/g)
Sucrose
5.048 ± 0.293
5.489 ± 0.255
Glucose
0.306 ± 0.042
0.662 ± 0.024
Fructose
1.046 ± 0.103
2.006 ± 0.021
Mannose
1.122 ± 0.087
3.186 ± 0.234
Glucopyranose
0.009 ± 0.002
0.009 ± 0.003
Fructofuranose
0.231 ± 0.012
0.721 ± 0.080
Talofuranose
0.476 ± 0.173
1.266 ± 0.149
Xylose
0.013 ± 0.0004
0.024 ± 0.001
4-Keto-glucose
0.009 ± 0.001
0.014 ± 0.0004
Valine
0.018 ± 0.004
0.016 ± 0.004
Proline
0.111 ± 0.013
0.143 ± 0.061
Serine
0.035 ± 0.011
0.046 ± 0.010
Threonine
Trace
0.010 ± 0.006
Lysine
0.027 ± 0.012
0.024 ± 0.006
Aspartic acid
0.006 ± 0.001
Trace
GABA
0.014 ± 0.006
0.016 ± 0.007
Asparagine
0.760 ± 0.247
Trace
Octadecanoic acid
0.255 ± 0.132
0.441 ± 0.073
Hexadecanoic acid
0.504 ± 0.130
0.767 ± 0.073
Octadecanoic acid,
2,3-bisoxypropylester
0.035 ± 0.004
0.043 ± 0.006
Hexadecanoic acid,
2,3-bisoxypropylester
0.089 ± 0.019
0.098 ± 0.004
Guo et al. BMC Plant Biology (2015) 15:44
in catalytic activity and metabolic process. The most
noticeable pathways are carbon metabolism, starch and
sucrose metabolism and biosynthesis of amino acids. Expressions of key genes in sucrose and starch metabolism,
including alpha-1, 4 glucan phosphorylase (Cs6g22020),
pectinesterase 3 (Cs1g16550), sucrose-phosphate synthase
4 (Cs5g19060) and pectinesterase 2 (orange1.1 t00214),
were differentially expressed in WT and MT pericarpes, indicating that the sucrose and starch metabolism was significantly affected in MT. For example, Alpha-1, 4 glucan
phosphorylase involved in sucrose degradation was upregulated and sucrose-phosphate synthase 4 involved in
sucrose accumulation was down-regulated in MT, indicating the acceleration of the sucrose degradation. Our
gas chromatography–mass spectrometry (GC-MS) analysis also proved that the sucrose degradation in pericarp is higher in MT than in WT (Table 4). Moreover,
the content of most sugars was significantly decreased
in MT, indicating that the precursors for the glycolysis
were increased by the accelerated degradation of sugars.
Previous reports have also proved that the β-carotene synthesis was tightly linked to carbon metabolism [47,48].
Five genes involved in carbon metabolism were differentially expressed in MT and WT in our results. One
gene encoding glyceraldehyde-3-phosphate dehydrogenase (Cs2g14940) was significantly increased (2.9-fold) in
MT. This gene, catalyzing the conversion of glycerate 3phosphate to glyceraldehyde 3-phosphate, was important for glycolysis, which was consistent with a previous
speculation that glycolysis was increased in MT. The
present research also found that five genes involved in
amino acid biosynthesis were significantly changed in
MT, which was in line with our GC-MS analysis that the
content of amino acid differed significantly between MT
and WT. A similar result was also observed in carotenoidenhanced transgenic tomato fruits [49]. Interestingly,
our research found that the asparagine was the most
affected amino acid. Compared to WT, the content of
asparagine increased 8.85-fold in the carotenoid-enhanced
transgenic tomato fruits. These data indicated that the
content of asparagine was strongly correlated with carotenoid accmulation.
In order to identify potential candidate genes involved
in the regulation of carotenoid biosynthesis, we also analysed the top 10 most DEGs in MT and WT (Additional
file 7). Among them, two genes were involved in fatty acid
metabolism. One gene encoding Fatty acyl-CoA reductase
3 (Cs8g15220) was significantly reduced in the MT, which
was important for the fatty acid biosynthesis. The other
gene encoding GDSL esterase/lipase (Cs2g04220) was
significantly increased in the MT, and the GDSL esterase/
lipase was involved in fatty acid degradation. The altered
expression of these two genes indicated a decrease of the
fatty acid content in MT, which was consistent with our
Page 8 of 12
GC-MS analysis result that the contents of octadecanoic
acid and hexadecanoic acid were lower in MT than in
WT (Table 4). The biosynthesis of carotenoids and fatty
acids required common precursors from pyruvate [50].
We concluded that these two genes may play important
role in the carotenoid metabolism regulation. We also
found that the expression of one gene belonging to cytochrome P450 (Cs6g20050) was significantly increased in
MT. Cytochrome P450 catalyzes various reactions in plant
biosynthesis of second metabolites, including carotenoids [51,52]. Cytochrome P450 hemoproteins, which
catalyze NADPH- and O2-dependent hydroxylation reactions, were postulated to also be able to use hydrocarbon carotenes as substrates [53].
Transcription factors are the key switches for secondary
metabolite gene regulation [54]. In the present study,
twelve genes encoding transcription factors were identified
by RNA-Seq analysis (Additional file 8). Among the group
of transcription factors, we identified three genes belonging
to the MYB family of transcription factors (Cs3g02020,
Cs3g23070 and orange1.1 t01787). Previous studies on the
carotenoid mutants also identified a number of MYB transcription factors [34,35]. The superfamily of MYB transcription factors was proved to control many biological
processes, primarily in anthocyanin biosynthesis [55,56].
Overexpression of a Vitis vinifera R2R3-MYB transcription factor (MYB5b) in tomato resulted in an increased
content of β-carotene [57]. These results indicated that
the MYB genes may be involved in regulating carotenoid
biosynthesis. We also detected two significantly differentially expressed NAC transcription factors. NAC proteins
constitute one of the largest families of plant-specific transcription factors [58]. Genes from this family participate
in various biological processes including developmental
programs, defence, and biotic and abiotic stress responses
[59,60]. Recently, a NAC transcription factor (SlNAC4)
has been proved to a positive regulator of carotenoid accumulation [61]. In this study, both of the two identified
NAC transcription factors showed a down-regulated expression in MT samples, indicating that both of them may
play a feedback regulating role in the carotenoid biosynthesis. Ethylene plays a key regulatory role in fruit ripening
and carotenoid accumulation [62]. Our results showed
that the ethylene-responsive transcription factor (RAP2-7)
was highly expressed in MT. In this study, we also identified several other significantly differentially expressed
transcription factors, such as WRKY (Cs2g25560), BHLH
(Cs8g03200) and MUTE (Cs9g06130).
Conclusions
This is the first investigation of the biochemical and molecular alterations associated with an orange-pericarp
fruit mutation in pummelo. In this study, the content of
carotenoids and the expression patterns of carotenoid
Guo et al. BMC Plant Biology (2015) 15:44
biosynthetic genes in the pericarps were comparatively
analysed for the pummelo MT and its WT. We used
RNA-seq to identify the differential expression genes in
the MT by comparing with the WT. GO analysis and
pathway mapping of the DEGs provide significant insight
into the underlying molecular mechanisms governing the
β-carotene accumulation. Critical genes and pathways involved in carbon metabolism, starch and sucrose metabolism and biosynthesis of amino acids were associated with
the β-carotene accumulation. The results suggest that the
considerable β-carotene accumulation appears to be due
to a down-regulation of downstream genes for β-carotene
degradation. Moreover, several candidate genes and transcription factors that possibly regulate carotenoid biosynthesis in the pericarp of pummelo were also identified.
However, the functions of these genes remain to be elucidated in the future. The overall findings from this study
facilitate the understanding of the molecular regulation of
β-carotene accumulation in the pummelo mutant strain
and provide useful information for further related studies.
Methods
Plant materials and RNA extraction
The materials used in this study were ‘Guanxi’ pummelo
and its MT cultivated in the city of Zhangzhou, Fujian
province, China. The samples were harvested at ripe
stage with three biological replicates. After separation
from fruits, the pericarps were immediately frozen in liquid nitrogen and kept at −80°C until further use. Total
RNA was extracted from the pericarps of WT and MT
as previously described [30]. The quality of the RNA
was assessed by 1% agarose gel electrophoresis coupled
with NanoPhotometer® spectrophotometer (IMPLEN,
CA, USA). RNA concentration was measured using
Qubit® RNA Assay Kit in Qubit® 2.0 Flurometer (Life
Technologies, USA). RNA integrity was confirmed using a
2100 Bioanalyzer (Agilent Technologies) with a minimum
RNA integrity number (RIN) value of 8.0.
Page 9 of 12
RNA-seq library preparation and sequencing
Sequencing libraries were constructed by using three
biological replicates for WT and MT pericarps, which
were named WT1, WT2, WT3, MT1, MT2 and MT3,
respectively. A total amount of 3 μg RNA per sample was
used as input material for the RNA sample preparation.
Sequencing libraries were generated using NEBNext®
Ultra™ RNA Library Prep Kit for Illumina® (NEB, USA) by
following manufacturer’s recommendations, and index
codes were added to attribute sequences to each sample.
Briefly, mRNA was purified from total RNA using poly-T
oligo-attached magnetic beads. Fragmentation was carried
out using divalent cations under elevated temperature in
NEBNext First Strand Synthesis Reaction Buffer (5×). First
strand cDNA was synthesized using random hexamer primer and MmuLV Reverse Transcriptase (RNase H-). Second strand cDNA synthesis was subsequently performed
using DNA polymerase I and RNase H. Remaining overhangs were converted into blunt ends via exonuclease/
polymerase activities. After adenylation of 3′ ends of DNA
fragments, NEBNext Adaptor with hairpin loop structure
was ligated before hybridization. To preferentially select
cDNA fragments of 150–200 bp in length, the library fragments were purified with AMPure XP system (Beckman
Coulter, Beverly, USA). Then 3 μl USER Enzyme (NEB,
USA) was used with size-selected, adaptor-ligated cDNA
at 37°C for 15 min followed by 5 min at 95°C before PCR.
The PCR was performed with Phusion High-Fidelity DNA
polymerase, Universal PCR primers and Index (X) Primer. Finally, PCR products were purified (AMPure XP
system) and library quality was assessed on the Agilent
Bioanalyzer 2100 system. The clustering of the indexcoded samples was performed on a cBot Cluster Generation System using TruSeq SR Cluster Kit v3-cBot-HS
(Illumia) according to the manufacturer’s instructions.
After cluster generation, the library preparations were
sequenced on an Illumina Hiseq 2000 platform and
100 bp single-end reads were generated.
Data analysis
Carotenoid content measurement
Carotenoid extraction and quantification was performed
as previously described with modification [30]. Carotenoids
were analyzed by reversed phase HPLC. Chromatography
was carried out with a Waters liquid chromatography system equipped with a model 600E solvent delivery system, a
model 2996 photodiode array detection (PAD) system, a
model 717 plus autosampler, and an empower Chromatography Manager. Carotenoids were eluted with MeOHAcetonitrile [75:25 v/v, eluent A] and MTBE [eluent B]
using a C30 carotenoid column (15 × 4.6 mm; YMC,
Japan). Carotenoids were identified by their characteristic absorption spectra, typical retention time, and comparison with authentic standards (Bern, Switzerland).
Raw sequence reads were first processed using an inhouse Perl script. In this step, clean data were obtained
by removing reads containing adaptors only, reads with
more than 10% unknown bases and reads with a quality
score of less than 5.0 for more than half of the bases.
Meanwhile, the Q20, Q30 and GC content of the clean
data were calculated. All the downstream analyses were
based on these clean data with high quality. For annotation, all clean tags were mapped to the reference sequence of the sweet orange genome [42]. Mismatches of
no more than two bases were allowed in the alignment.
The remaining clean tags were designated as unambiguous clean tags. The RPKM method was used to estimate
the unique gene expression levels [63]. Reference
Guo et al. BMC Plant Biology (2015) 15:44
genome and gene model annotation files were downloaded directly from the genome website (http://citrus.
hzau.edu.cn/orange/index.php). Index of the reference
genome was built using Bowtie v2.0.6 (Broad Institute,
Cambridge, MA, USA) and single-end clean reads were
aligned to the reference genome using TopHat v2.0.9
(Broad Institute). TopHat was selected as the mapping
tool because it can generate a database of splice junctions
based on the gene model annotation file and thus give a
better mapping result than other non-splice mapping
tools. Differential expression analysis of two samples (each
three biological replicates) was performed using the
DESeq R package (1.10.1) [64]. DESeq provides statistical routines for determining differential expression in
digital gene expression data using a model based on the
negative binomial distribution. The resulting P-values
were adjusted using the Benjamini and Hochberg’s approach for controlling the false discovery rate. The significance of the gene expression difference was
determined with an adjusted P-value <0.05 found by
DESeq. GO enrichment analysis of DEGs was implemented by the GOseq R package. GO terms with a corrected P-value < 0.05 were considered significantly
enriched by differentially expressed genes. The statistical
enrichment of the differential expression genes in KEGG
pathways was tested using the KO-Based Annotation System (KOBAS) software.
qRT-PCR analysis
To validate the RNA-Seq results and provide more information for the affected metabolic processes, 22 selected
DEGs corresponding to the metabolic pathways and transcription factors were verified by qRT-PCR. Actin was
amplified along with the target gene as an endogenous
control to normalize expression between different samples. Primer sequences used for qRT-PCR are listed in
Additional file 9. The samples collected from another
year and different from the RNA-seq analysis were
used for qRT-PCR validation. One μg of total RNA
from each sample was used to synthesize the first
strand cDNA using the PrimeScript Reverse Transcriptase Kit (TaKaRa) according to the protocol of
the manufacturer. The qRT-PCR was carried out in
an ABI PRISM® 9600 Sequence Detection System
(Applied Biosystems) using SYBR Green Supermix according to the manufacturer’s instructions, under the
thermal cycle conditions of an initial denaturation at
94°C for 10 min, followed by 40 cycles of 94°C for 15 s,
60°C for 31 s for annealing, and a final step of extension
at 72°C for 7 min. The expression level of genes was calculated by the delta-delta-Ct method [65]. Each biological sample was examined in duplicate with two to
three technical replicates.
Page 10 of 12
Determination of the sugar, amino acid and fatty acid
content in the pericarp
The extraction and derivatization of sugars, amino acids
and fatty acids were performed as previously described
with modification [66]. A 200 mg sample was added to
the extracting solution containing 2,700 μl of methanol
and 300 μl of 0.2 mg ml−1 ribitol in water as a quantification internal standard. Each sample (1 μl) was injected
into the GC system through a fused-silica capillary column with a DB-5 MS stationary phase (30 m × 0.25 mm
i.d., 0.25 μm). Total ion current (TIC) spectra were recorded in the mass range of 45–600 atomic mass units
(amu) in scanning mode.
Availability of supporting data
Raw sequencing data is available through the NCBI Gene
Expression Omnibus under Project ID GSE64764. All samples were sequenced as 100 bp single reads on an Illumina
HiSeq2500 sequencer.
Additional files
Additional file 1: SSR marker analysis of MT and WT. For each pair of
SSR markers, the left is WT, and the right is MT.
Additional file 2: Carotenoid content in the pulps of MT and WT at
fruit maturation.
Additional file 3: Sequence information of carotenoid biosynthetic
genes in MT and WT.
Additional file 4: DEGs in MT and WT. The red part represents the
genes up-regulated in MT as compared to WT. The green part shows
the genes downregulated in MT. The blue part shows the genes without
expression difference between the two samples.
Additional file 5: List of significantly DEGs between MT and WT.
Additional file 6: Comparison of gene expression ratios observed
by RNA-seq and qRT-PCR. The RNA-seq log2 (expression ratio) values
(x-axis) are plotted against the log2 (expression ratio) obtained by
qRT-PCR (y-axis).
Additional file 7: Top 10 most DEGs in MT and WT. The transcript
abundance from RNA-seq data was added on the top of each gene.
RPKM, reads per kilo bases per million reads. The gene number refers
to the sweet orange genome.
Additional file 8: Transcription factor with altered expression in MT.
Additional file 9: Primer sequences for amplification by qRT-PCR.
Abbreviations
HPLC: High Performance Liquid Chromatography; MT: Orange-pericarp
mutant; WT: Wild type; qRT-PCR: Quantitative real-time PCR; GO: Gene
ontology; DEGs: Differentially expressed genes; ABA: Abscisic acid;
GGPP: Geranylgeranyl pyrophosphate; PSY: Phytoene synthase; PDS: Phytoene
desaturase; ZDS: ζ-carotene desaturase; CRTISO: Carotene isomerase; ZISO:
15-cis-ζ-carotene isomerase; LCYb: Lycopene β-cyclase; LCYe: Lycopene
ε-cyclase; BCH: β-ring hydroxylase; ZEP: Zeaxanthin epoxidase; NCEDs:
9-cis-epoxycarotenoid dioxygenase; CCDs: Carotenoid cleavage dioxygenases;
SSR: Simple Sequence Repeat; RPKM: Reads per kilobase of exon model per
million mapped reads; GC-MS: Gas chromatography–mass spectrometry;
RIN: RNA integrity number; PAD: Photodiode array detection; TIC: Total
ion current.
Competing interests
The authors declare that they have no competing interests.
Guo et al. BMC Plant Biology (2015) 15:44
Authors’ contributions
FG and QX were responsible for generating the RNA-seq data and for the
interpretation of the data. FG and HWY carried out qRT-PCR experiments and
measured carotenoid, sugar, amino acid and fatty acid content. FG drafted
the manuscript. QX conceived the study, participated in its design and
helped to draft the manuscript. XXD proposed and supervised the research.
All authors read and approved the final manuscript.
Acknowledgements
This work was funded by the Ministry of Science and Technology of China
(2011CB100601), National Natural Science Foundation of China (31330066)
and the Huazhong Agricultural University Scientific &Technological
Self-innovation Foundation (2012YB11). The funders had no role in study
design, data collection and analysis, decision to publish, or preparation of
the manuscript.
Received: 15 September 2014 Accepted: 22 January 2015
References
1. Talon M, Gmitter FG. Citrus genomics. Int J Plant Genomics.
2008;2008:528361.
2. Alquézar B, Rodrigo M, Zacarías L. Carotenoid biosynthesis and their
regulation in citrus fruits. Tree Forestry Sci Biotechnol. 2008;2(1):23–37.
3. Demmig-Adams B, Adams WW. Antioxidants in photosynthesis and human
nutrition. Science. 2002;298(5601):2149–53.
4. Ma J, Li J, Zhao J, Zhou H, Ren F, Wang L, et al. Inactivation of a gene
encoding carotenoid cleavage dioxygenase (CCD4) leads to carotenoid-based
yellow coloration of fruit flesh and leaf midvein in peach. Plant Mol Biol Report.
2014;32(1):246–57.
5. Rubio A, Rambla JL, Santaella M, Gómez MD, Orzaez D, Granell A, et al.
Cytosolic and plastoglobule-targeted carotenoid dioxygenases from
Crocus sativus are both involved in β-ionone release. J Biol Chem.
2008;283(36):24816–25.
6. Cazzonelli CI. Goldacre review: carotenoids in nature: insights from plants
and beyond. Funct Plant Biol. 2011;38(11):833–47.
7. Fester T, Hause B, Schmidt D, Halfmann K, Schmidt J, Wray V, et al.
Occurrence and localization of apocarotenoids in arbuscular mycorrhizal
plant roots. Plant Cell Physiol. 2002;43(3):256–65.
8. Milborrow B. The pathway of biosynthesis of abscisic acid in vascular plants:
a review of the present state of knowledge of ABA biosynthesis. J Exp Bot.
2001;52(359):1145–64.
9. Wolf G. The discovery of the visual function of vitamin A. J Nutr.
2001;131(6):1647–50.
10. Krinsky NI, Johnson EJ. Carotenoid actions and their relation to health and
disease. Mol Asp Med. 2005;26(6):459–516.
11. Rao A, Rao LG. Carotenoids and human health. Pharmacol Res.
2007;55(3):207–16.
12. Von Lintig J. Colors with functions: elucidating the biochemical and
molecular basis of carotenoid metabolism. Annu Rev Nutr. 2010;30:35–56.
13. Sandmann G. Carotenoid biosynthesis and biotechnological application.
Arch Biochem Biophys. 2001;385(1):4–12.
14. Cunningham Jr F, Gantt E. Genes and enzymes of carotenoid biosynthesis
in plants. Annu Rev Plant Biol. 1998;49(1):557–83.
15. Hirschberg J. Carotenoid biosynthesis in flowering plants. Curr Opin Plant
Biol. 2001;4(3):210–8.
16. Park H, Kreunen SS, Cuttriss AJ, DellaPenna D, Pogson BJ. Identification of
the carotenoid isomerase provides insight into carotenoid biosynthesis,
prolamellar body formation, and photomorphogenesis. Plant Cell Online.
2002;14(2):321–32.
17. Ronen G, Cohen M, Zamir D, Hirschberg J. Regulation of carotenoid
biosynthesis during tomato fruit development: expression of the gene for
lycopene epsilon-cyclase is down-regulated during ripening and is elevated
in the mutantDelta. Plant J. 1999;17(4):341–51.
18. Tanaka Y, Sasaki N, Ohmiya A. Biosynthesis of plant pigments: anthocyanins,
betalains and carotenoids. Plant J. 2008;54(4):733–49.
19. Gross J. Pigments in fruits. In: Schweigert BS, editor. Food science and
technology: a series of monographs. London: Academic Press; 1987.
20. Saunt J. Citrus varieties of the world. 2000.
Page 11 of 12
21. Rouseff R, Raley L, Hofsommer H-J. Application of diode array detection with
a C-30 reversed phase column for the separation and identification of
saponified orange juice carotenoids. J Agric Food Chem. 1996;44(8):2176–81.
22. Sun Y, Liu D, Chen J, Ye X, Yu D. Effects of different factors of ultrasound
treatment on the extraction yield of the all-trans-β-carotene from citrus
peels. Ultrason Sonochem. 2011;18(1):243–9.
23. Zhou JY, Sun CD, Zhang LL, Dai X, Xu CJ, Chen KS. Preferential
accumulation of orange-colored carotenoids in Ponkan (Citrus reticulata)
fruit peel following postharvest application of ethylene or ethephon.
Sci Hortic. 2010;126(2):229–35.
24. Rodrigo MJ, Alquézar B, Alós E, Medina V, Carmona L, Bruno M, et al. A
novel carotenoid cleavage activity involved in the biosynthesis of Citrus
fruit-specific apocarotenoid pigments. J Exp Bot. 2013;64(14):4461–78.
25. Ma G, Zhang L, Matsuta A, Matsutani K, Yamawaki K, Yahata M, et al.
Enzymatic formation of β-citraurin from β-cryptoxanthin and zeaxanthin
by carotenoid cleavage Dioxygenase4 in the flavedo of citrus fruit. Plant
Physiol. 2013;163(2):682–95.
26. Rodrigo MJ, Marcos JF, Zacarías L. Biochemical and molecular analysis of
carotenoid biosynthesis in flavedo of orange (Citrus sinensis L.) during fruit
development and maturation. J Agric Food Chem. 2004;52(22):6724–31.
27. Rodrigo MJ, Marcos JF, Alférez F, Mallent MD, Zacarías L. Characterization of
Pinalate, a novel Citrus sinensis mutant with a fruit-specific alteration that
results in yellow pigmentation and decreased ABA content. J Exp Bot.
2003;54(383):727–38.
28. Lee HS. Characterization of carotenoids in juice of red navel orange (Cara
Cara). J Agric Food Chem. 2001;49(5):2563–8.
29. Monselise S, Halevy A. Detection of lycopene in pink orange fruit. Science.
1961;133(3463):1478.
30. Liu Q, Xu J, Liu YZ, Zhao XL, Deng XX, Guo LL, et al. A novel bud mutation
that confers abnormal patterns of lycopene accumulation in sweet orange
fruit (Citrus sinensis L. Osbeck). J Exp Bot. 2007;58(15–16):4161–71.
31. Curl AL, Bailey GF. The carotenoids of Ruby Red grapefruit. J Food Sci.
1957;22(1):63–8.
32. Xu J, Tao NG, Liu Q, Deng XX. Presence of diverse ratios of lycopene/β-carotene
in five pink or red-fleshed citrus cultivars. Sci Hortic. 2006;108(2):181–4.
33. Liu Q, Zhu AD, Chai LJ, Zhou WJ, Yu KQ, Ding J, et al. Transcriptome
analysis of a spontaneous mutant in sweet orange [Citrus sinensis (L.)
Osbeck] during fruit development. J Exp Bot. 2009;60(3):801–13.
34. Pan ZY, Liu Q, Yun Z, Guan R, Zeng WF, Xu Q, et al. Comparative
proteomics of a lycopene-accumulating mutant reveals the important role
of oxidative stress on carotenogenesis in sweet orange (Citrus sinensis [L.]
osbeck). Proteomics. 2009;9(24):5455–70.
35. Xu Q, Yu KQ, Zhu AD, Ye JL, Liu Q, Zhang JC, et al. Comparative transcripts
profiling reveals new insight into molecular processes regulating lycopene
accumulation in a sweet orange (Citrus sinensis) red-flesh mutant. BMC
Genomics. 2009;10(1):540.
36. Alós E, Roca M, Iglesias DJ, Mínguez-Mosquera MI, Damasceno CMB,
Thannhauser TW, et al. An evaluation of the basis and consequences of a
stay-green mutation in the navel negra citrus mutant using transcriptomic
and proteomic profiling and metabolite analysis. Plant Physiol.
2008;147(3):1300–15.
37. Licciardello C, Russo MP, Recupero RG. Identification of differentially
expressed genes in the flesh of blood and common oranges. Tree Genetics
Genomes. 2008;4(2):315–31.
38. Fanciullino AL, Dhuique-Mayer C, Luro F, Morillon R, Ollitrault P. Carotenoid
biosynthetic pathway in the Citrus genus: number of copies and phylogenetic
diversity of seven genes. J Agric Food Chem. 2007;55(18):7405–17.
39. Xu CJ, Fraser PD, Wang WJ, Bramley PM. Differences in the carotenoid
content of ordinary citrus and lycopene-accumulating mutants. J Agric Food
Chem. 2006;54(15):5474–81.
40. Tao NG, Hu ZY, Liu Q, Xu J, Cheng YJ, Guo LL, et al. Expression of phytoene
synthase gene (Psy) is enhanced during fruit ripening of Cara Cara navel
orange (Citrus sinensis Osbeck). Plant Cell Rep. 2007;26(6):837–43.
41. Alquezar B, Rodrigo MJ, Zacarías L. Regulation of carotenoid biosynthesis
during fruit maturation in the red-fleshed orange mutant Cara Cara.
Phytochemistry. 2008;69(10):1997–2007.
42. Xu Q, Chen LL, Ruan XA, Chen DJ, Zhu AD, Chen CL, et al. The draft
genome of sweet orange (Citrus sinensis). Nat Genet. 2013;45(1):59–U92.
43. Zhang N, Zhang HJ, Zhao B, Sun QQ, Cao YY, Li R, et al. The RNA-seq
approach to discriminate gene expression profiles in response to melatonin
on cucumber lateral root formation. J Pineal Res. 2014;56(1):39–50.
Guo et al. BMC Plant Biology (2015) 15:44
44. Van Eck J, Conlin B, Garvin D, Mason H, Navarre D, Brown C. Enhancing
beta-carotene content in potato by RNAi-mediated silencing of the
beta-carotene hydroxylase gene. Am J Potato Res. 2007;84(4):331–42.
45. Diretto G, Welsch R, Tavazza R, Mourgues F, Pizzichini D, Beyer P, et al.
Silencing of beta-carotene hydroxylase increases total carotenoid and
beta-carotene levels in potato tubers. BMC Plant Biol. 2007;7(1):11.
46. Yan JB, Kandianis CB, Harjes CE, Bai L, Kim E-H, Yang X, et al. Rare genetic
variation at Zea mays crtRB1 increases [beta]-carotene in maize grain. Nat
Genet. 2010;42(4):322–7.
47. Schulze-Siebert D, Schultz G. β-carotene synthesis in isolated spinach
chloroplasts its tight linkage to photosynthetic carbon metabolism.
Plant Physiol. 1987;84(4):1233–7.
48. Schultz G, Heintze A, Hoppe P, Hagelstein P, Gorlach J, Meereis K, et al.
Tocopherol and carotenoid synthesis in chloroplasts: tight linkage to
plastidic carbon metabolism in developing chloroplasts. Am Soc Plant
Physiol. 1991;6:156–70.
49. Fraser PD, Enfissi EM, Halket JM, Truesdale MR, Yu D, Gerrish C, et al.
Manipulation of phytoene levels in tomato fruit: effects on isoprenoids,
plastids, and intermediary metabolism. Plant Cell Online. 2007;19(10):3194–211.
50. Schwender J, Seemann M, Lichtenthaler H, Rohmer M. Biosynthesis of
isoprenoids (carotenoids, sterols, prenyl side-chains of chlorophylls and
plastoquinone) via a novel pyruvate/glyceraldehyde 3-phosphate
non-mevalonate pathway in the green alga Scenedesmus obliquus.
Biochem J. 1996;316:73–80.
51. Kim J, DellaPenna D. Defining the primary route for lutein synthesis in
plants: the role of Arabidopsis carotenoid β-ring hydroxylase CYP97A3. Proc
Natl Acad Sci U S A. 2006;103(9):3474–9.
52. Tian L, DellaPenna D. Characterization of a second carotenoid β-hydroxylase
gene from Arabidopsis and its relationship to the LUT1 locus. Plant Mol Biol.
2001;47(3):379–88.
53. Chapple C. Molecular-genetic analysis of plant cytochrome P450-dependent
monooxygenases. Annu Rev Plant Biol. 1998;49(1):311–43.
54. De Geyter N, Gholami A, Goormachtig S, Goossens A. Transcriptional
machineries in jasmonate-elicited plant secondary metabolism. Trends Plant
Sci. 2012;17(6):349–59.
55. Kobayashi S, Goto-Yamamoto N, Hirochika H. Retrotransposon-induced
mutations in grape skin color. Science. 2004;304(5673):982.
56. Takos AM, Jaffé FW, Jacob SR, Bogs J, Robinson SP, Walker AR.
Light-induced expression of a MYB gene regulates anthocyanin biosynthesis
in red apples. Plant Physiol. 2006;142(3):1216–32.
57. Mahjoub A, Hernould M, Joubès J, Decendit A, Mars M, Barrieu F, et al.
Overexpression of a grapevine R2R3-MYB factor in tomato affects vegetative
development, flower morphology and flavonoid and terpenoid metabolism.
Plant Physiol Biochem. 2009;47(7):551–61.
58. Puranik S, Sahu PP, Srivastava PS, Prasad M. NAC proteins: regulation and
role in stress tolerance. Trends Plant Sci. 2012;17(6):369–81.
59. Olsen AN, Ernst HA, Leggio LL, Skriver K. NAC transcription factors:
structurally distinct, functionally diverse. Trends Plant Sci. 2005;10(2):79–87.
60. Hegedus D, Yu M, Baldwin D, Gruber M, Sharpe A, Parkin I, et al. Molecular
characterization of Brassica napus NAC domain transcriptional activators
induced in response to biotic and abiotic stress. Plant Mol Biol.
2003;53(3):383–97.
61. Zhu M, Chen G, Zhou S, Tu Y, Wang Y, Dong T, et al. A new tomato NAC
(NAM/ATAF1/2/CUC2) transcription factor, SlNAC4, functions as a positive
regulator of fruit ripening and carotenoid accumulation. Plant Cell Physiol.
2014;55(1):119–35.
62. Lee JM, Joung JG, McQuinn R, Chung MY, Fei Z, Tieman D, et al. Combined
transcriptome, genetic diversity and metabolite profiling in tomato fruit
reveals that the ethylene response factor SlERF6 plays an important role in
ripening and carotenoid accumulation. Plant J. 2012;70(2):191–204.
63. Mortazavi A, Williams BA, Mccue K, Schaeffer L, Wold B. Mapping and
quantifying mammalian transcriptomes by RNA-Seq. Nat Methods.
2008;5(7):621–8.
64. Anders S, Huber W. Differential expression analysis for sequence count data.
Genome Biol. 2010;11(10).
65. Livak KJ, Schmittgen TD. Analysis of relative gene expression data using
real-time quantitative PCR and the 2− ΔΔCT method. Methods.
2001;25(4):402–8.
66. Yun Z, Gao HJ, Liu P, Liu SZ, Luo T, Jin S, et al. Comparative proteomic and
metabolomic profiling of citrus fruit with enhancement of disease
resistance by postharvest heat treatment. BMC Plant Biol. 2013;13(1):44.
Page 12 of 12
Submit your next manuscript to BioMed Central
and take full advantage of:
• Convenient online submission
• Thorough peer review
• No space constraints or color figure charges
• Immediate publication on acceptance
• Inclusion in PubMed, CAS, Scopus and Google Scholar
• Research which is freely available for redistribution
Submit your manuscript at
www.biomedcentral.com/submit