Timing of ripening initiation in grape berries and its relationship to seed content and pericarp auxin levels
Bạn đang xem bản rút gọn của tài liệu. Xem và tải ngay bản đầy đủ của tài liệu tại đây (1.73 MB, 16 trang )
Gouthu and Deluc BMC Plant Biology (2015) 15:46
DOI 10.1186/s12870-015-0440-6
RESEARCH ARTICLE
Open Access
Timing of ripening initiation in grape berries and
its relationship to seed content and pericarp
auxin levels
Satyanarayana Gouthu and Laurent G Deluc*
Abstract
Background: Individual berries in a grape (Vitis vinifera L.) cluster enter the ripening phase at different times
leading to an asynchronous cluster in terms of ripening. The factors causing this variable ripening initiation among
berries are not known. Because the influence via hormonal communication of the seed on fruit set and growth is
well known across fruit species, differences in berry seed content and resultant quantitative or qualitative
differences in the hormone signals to the pericarp likely influence the relative timing of ripening initiation among
berries of the cluster.
Results: At the time of the initiation of cluster ripening (véraison), underripe green berries have higher seed
content compared to the riper berries and there is a negative correlation between the seed weight-to-berry weight
ratio (SB) and the sugar level in berries of a cluster. Auxin levels in seeds relative to the pericarp tissues are two to
12 times higher at pre-ripening stages. The pericarp of berries with high-SB had higher auxin and lower abscisic
acid (ABA) levels compared to those with low-SB from two weeks before véraison. In the prevéraison cluster, the
expression of auxin-response factor genes was significantly higher in the pericarp of high-SB berries and remained
higher until véraison compared to low-SB berries. The expression level of auxin-biosynthetic genes in the pericarp
was the same between both berry groups based upon similar expression activity of YUC genes that are rate-limiting
factors in auxin biosynthesis. On the other hand, in low-SB berries, the expression of ABA-biosynthetic and
ABA-inducible NCED and MYB genes was higher even two weeks before véraison.
Conclusions: Differences in the relative seed content among berries plays a major role in the timing of ripening
initiation. Towards the end of berry maturation phase, low and high levels of auxin are observed in the pericarp of
low- and high-SB berries, respectively. This results in higher auxin-signaling activity that lasts longer in the pericarp
of high-SB berries. In contrast, in low-SB berries, concomitant with an earlier decrease of auxin level, the features of
ripening initiation, such as increases in ABA and sugar accumulation begin earlier.
Keywords: Seed, Auxin, Fruit ripening, Vitis vinifera, Asynchronous ripening
Background
Fruit set depends upon successful fertilization that includes regulatory interactions between fertilized ovule
and ovary that are mediated by hormones [1]; fruit
growth is also closely related to seed growth [2]. Seed
number is positively correlated with fruit growth in
many species including cucumber [3], grape [4], and
sweet pepper [5]. For example, strawberry fruits fail to
* Correspondence:
Department of Horticulture, College of Agricultural Sciences, Oregon State
University, Corvallis, OR 97331, USA
grow when the seeds are removed and growth can be restored upon the application of auxins to the deseeded
fruits, indicating that seeds supply substances necessary
for the fruit growth [6]. In grape, the weight of berries in
the cluster may vary by a factor of two and the coefficient of variance of berry weight within a cluster can
reach a maximum of 25-30% [7,8]. Many factors such as
assimilate supply and environmental conditions may
affect variation in berry size, but external factors such as
water stress have been shown to homogeneously inhibit
berry growth in all berries, indicating that internal factors influence berry growth differences [8]. The number
© 2015 Gouthu and Deluc; licensee BioMed Central. This is an Open Access article distributed under the terms of the Creative
Commons Attribution License ( which permits unrestricted use, distribution, and
reproduction in any medium, provided the original work is properly credited. The Creative Commons Public Domain
Dedication waiver ( applies to the data made available in this article,
unless otherwise stated.
Gouthu and Deluc BMC Plant Biology (2015) 15:46
of seeds has been suggested to influence cell division
and cell expansion in pericarp through the production of
hormones during tomato fruit development [1]. Similarly, lower growth was reported for seedless berries
compared to seeded berries in Pinot Noir and Cabernet
Sauvignon clusters [7]. Based upon recent molecular evidence, auxin is synthesized in the ovule and transported
to the pericarp upon fertilization, where it induces
gibberellin (GA) biosynthesis. The GA then degrades
DELLA proteins that repress ovary growth and fruit initiation (reviewed by [9]). However, fruit development
can be uncoupled from fertilization and seed development, as seen in parthenocarpic and stenospermocarpic
fruits [10]. In these instances, elevated endogenous phytohormone levels in the pericarp similar to those of
seeded fruits have been observed during fruit set [11].
This suggests that either the phytohormones could originate from sources other than seeds, or their increase
in the pericarp is developmentally regulated. Accordingly, parthenocarpy can be induced by the exogenous
application of auxins, cytokinins, or gibberellins [12] or
by the expression of auxin biosynthetic genes in ovaries
and ovules [13]. However, unseeded parthenocarpic
fruits show less growth and lack the peak of auxin that
occurs before the onset of ripening seen in the normal
seeded fruits suggesting that, at least during the later
stages of fruit development, the embryo-supplied auxin
is necessary for continued fruit growth [14,15].
Even as we know much about the role of seeds during
fruit set and maturation from several fruit models, the
role played by seeds in the process of the ripening onset
is not well understood. In strawberry, removal of
achenes from immature fruit causes precocious ripening,
which can be stopped by the application of auxin [16],
suggesting that seeds negatively affect ripening through
auxins. In tomato, over-expression of a gene from Capsicum chinense L. that encodes an auxin-conjugating enzyme (GH3) leads to increased sensitivity of fruit to
ethylene at an earlier stage of development [17]. Similarly, in avocado, seeds have been shown to inhibit the
ripening process, and seedless fruits show higher response to ethylene even at earlier developmental stages
[18], probably owing to the lack of inhibitory action by
the seed-supplied auxin. All of this evidence suggests
that as seeds mature, auxin biosynthesis or transport to
the pericarp ceases, allowing the mature fruit to ripen.
This phenomenon appears to be supported across fruit
species, including grape, as auxin treatment of fruit at
immature and mature stages delays ripening [19-21]. It
has been suggested that, as premature ripening of fruit
before seed maturation is not desirable for reproductive
success, seed and fruit maturation are strictly synchronized and auxin may coordinate communication between seed and pericarp [9].
Page 2 of 16
In grape, completion of seed growth coincides with
the onset of ripening (véraison) [22], when fruit becomes
ready to undergo ripening and there is a major switch in
the relative hormone levels in the pericarp, notably
auxin and ABA [23,24]. In a mid-véraison cluster (50%
of berries have changed color), uneven ripening among
the individual berries indicates that the berries do not
enter the ripening phase at the same time. Differences in
flowering times and fertilization events have been suggested to cause the differences in the timing of ripening
onset among berries [7]. However, Gorchov in [25]
reported that variance in the fruit-ripening times in
Amelanchier arborea appears more related to the developmental duration of fruit maturation rather than the
flowering times. Based upon evidence for the seed-toberry growth relationship discussed above, relative seed
content in the berry might influence the duration of
berry maturation and its transition to the ripening.
In the present study, we examined the differences in
seed content between berries that enter the ripening
stage sooner or later, with the aim of understanding the
effect of seed content on the timing of berry ripening
initiation. We monitored the changes in ripening-related
hormones in the pericarp of berries with high or low
seed content during the period leading to ripening onset.
We show that the differences in the relative level of
auxin in the berries having low and high seed content
leads to differences in the timing of ripening initiation
and could possibly be the main cause for asynchronous
ripening of a grape cluster.
Results and discussion
Observation of seed content and berry ripening
phenotype
Grape clusters generally transition into the ripening
phase about eight weeks post-anthesis (E-L stage; [26]),
but the timing of transition for individual berries in the
cluster varies. Ripening-related physiological and transcriptional differences between berries in different ripening stages (green hard, green soft, pink soft, and red soft
berries) in mid-véraison clusters have been reported in
several studies [27-29]. In our previous study, by examining the post-véraison progression of sugar and color
accumulation in differentially ripening berries within
véraison clusters, we found that green hard, green soft,
or pink berries were ~14, 7, or 4 days delayed, respectively, in their ripening program at mid-véraison stage
(Additional file 1) [30]. Examination of the number and
weight of seeds per berry revealed that green underripe
berries consistently contained higher seed number and
weight compared to the colored berries that had entered
the ripening phase earlier even though the seeds had yet
to reach their maximum weight (Figure 1A). This suggests that the delay in the ripening onset for individual
Gouthu and Deluc BMC Plant Biology (2015) 15:46
Page 3 of 16
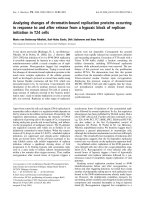
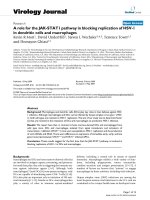
Figure 1 Relationship between seed and berry ripening in the mid-véraison cluster. (A) Seed weight and seed numbers in the green hard,
green soft, pink, and red berries of mid-véraison cluster. Data represent means ± SEM (n = 50). Different letters denote significant differences between
the berries of ripening stages for each seed parameter (Tukey’s HSD, p < 0.05) (B) Percentage of single-seeded green, pink and red berries in low and
high seed weight-to-berry weight (SB) groups of berries in the cluster. Berries with low and high SB ranges were selected as described in methods.
Berries of four entire clusters from two plants were used for analysis. Approximate test for equal proportions was used to identify differences in the
distribution of ripening classes between the SB groups and significant differences were marked with asterisks (p < 0.05). (C) Differences in mean dry
mass and dehydration levels per seed from green and red berries of mid-véraison cluster. Water loss was obtained by subtracting the seed dry weight
from the fresh weight and expressed as percentage of water in the seed. Data represent means ± SEM (n = 50). Different letters denote significant
differences between red and green berry seeds (Tukey’s HSD, p < 0.05). (D) Linear relation between SB and berry sugar level in the single-seeded berry
population of a cluster. Sugar levels were measured as °Brix. Berries of ten clusters from five different plants were used for the analysis (n = 1,146).
berries increases along with the increasing seed content.
A number of studies have indicated that seed number
and weight are related to berry growth and showed a
positive correlation between growth rates of seed and
pericarp tissues during the first phase of berry development
[4,7,22,31]. The entry of the pericarp into the ripening
phase also generally coincides with the completion of seed
growth [1]. Two studies investigated the relationship
between seed content, fruit growth and ripening in grape
[22,32]. In these studies lower seed weight in Shiraz and
low seed number in Concord were associated with delayed
berry ripeness and the ripening delay was attributed to
incomplete seed maturation [22]. However, our results
in Pinot noir show that green underripe berries have
not only higher total seed weight per berry, but also the
weights of individual seeds are significantly higher
Gouthu and Deluc BMC Plant Biology (2015) 15:46
compared to those of red berries, suggesting a quantitative negative influence of seed tissue on the ripening
(Additional file 2). These contrasting findings might be
attributable to cultivar differences, to the method of defining berry seed content for which berry size differences
were not considered, and to the exclusive use of seed
weight or number in the interpretation of the results in
the two studies cited in [22,32].
To examine the composition of green, pink, and red
berries in the mid-véraison cluster originating from berries with low and high seed content, we segregated the
berries on the basis of their “seed weight-to-berry weight
ratio (SB)”, and refer to these as the low and high-SB
groups hereafter. To rule out the effect of seed number
on ripening, only the single-seeded berries, which
accounted for ~70% of berries in a cluster, were considered (Figure 1B). While 86% berries with low-SB were either pink or red, 78% of high-SB berries were green at
mid-véraison. This indicates that seed weight-to-berry
weight ratio is a more suitable index to assess the influence of seed on the pericarp development than seed
number per berry. The positive correlation between seed
number and berry growth, reported in previous studies,
was probably due to the fact that higher seed number
generally results in higher weight. To examine whether
low-SB in pink and red berries is due to dehydration of
seeds, we compared the percentage of water loss between the seeds of green and red berries at mid-véraison
(Figure 1C). Based upon the literature, dehydration begins in the middle of véraison [33]. In our data, seeds of
red berries only had 3% less water content compared to
those of green berries, indicating that they had just entered the dehydration phase. In addition, the dry mass of
seeds was not different between green and red berries
(Figure 1C) and the decrease in fresh weight did not
commence before mid-véraison between low- and highSB berries (Additional file 3). These results indicate that
seed developmental changes in weight between green
and red berries had little contribution to the observed
Page 4 of 16
SB ratio differences until mid-véraison. Further, SB
showed a good correlation with sugar levels of the berries in the mid-véraison cluster, indicating that berries
with low seed content begin to accumulate sugars, the
main criterion for the ripening onset, earlier than those
with high-SB content (Figure 1D).
Ripening-related hormone levels in seed and pericarp
tissues
During the first cycle of rapid berry growth, the rate of
seed growth is assumed to have a positive effect on the
rate of cell division in the pericarp [2,34], which suggests
that the seed supplies the pericarp with hormones required for cell division, and possibly cell expansion. In
order to assess the relative levels of ripening-related hormones, we quantified abscisic acid (ABA) and indole-3acetic acid (IAA), two main regulators of the ripening
onset [20,24], in skin, pulp, and seed tissues of all green
prevéraison clusters and the green, pink, and red berries
from the mid-véraison-stage clusters (Figure 2). ABA
levels in seeds were about 4 times higher than in pericarp tissues at prevéraison, but remained at a similar
level until the later berry ripening-transition stage while
ABA levels in the pericarp increased significantly during
the berry ripening transitions (Figure 2A). ABA, a key
regulator of seed maturation and embryogenesis, is
largely synthesized in the integuments and its level in
seeds is high during mid- and late-maturation stages
(reviewed by [35]). Unlike in pericarp, where the actions
of auxin and ABA are antagonistic and developmentally
regulated during berry maturation and ripening phases,
respectively, ABA and auxin act synergistically in seed to
maintain dormancy [36]. In grape, rapid embryo growth
and the associated synthesis of auxin occur around the
maturation phase [22]. Auxin was up to 12-fold higher
in the seeds during the pre-ripening phase and was maintained at significantly higher levels compared to pericarp
tissues through the later ripening stages (Figure 2B). Pericarp tissues, especially pulp, show a steady decrease in
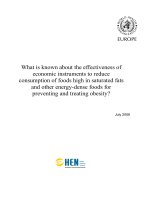
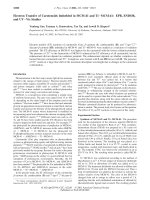
Figure 2 Levels of ripening-related hormones (A) abscisic acid (ABA) and (B) indole-3-acetic acid (IAA) in skin, pulp, and seed tissues of
berries. Hormone levels were quantified in prevéraison green (PV) and green, pink, and red stage berries of a mid-véraison (MV) cluster. Error bars
represent ± SEM (n = 4). Different letters denote significant differences between skin, pulp, and seed at each ripening stage (Tukey’s HSD, p < 0.05).
Gouthu and Deluc BMC Plant Biology (2015) 15:46
IAA with progressing ripening stages. Evidence for seeds
as the predominant source of auxins in fruit stems from
studies of diverse species [23,37,38], in which synthesis of
auxins in the embryo and endosperm tissues was observed
[39]. Although mainly associated with normal embryo
morphogenesis, auxin from seeds is thought to be transported to other parts of the fruit to promote cell division and expansion in the pericarp tissues [15,37,40].
When seed maturation is complete, auxin transport to
the pericarp is inhibited, allowing the fruit to ripen
(reviewed by [41]).
Differences between berries with low and high seed
weight-to-berry weight ratio (SB) within the prevéraison
clusters
In most studies related to grape berry ripening, the definition of ripening progress has been based on overall
cluster ripening and all green berries in prevéraison clusters were assumed to have low sugar, high auxin, and
low ABA levels compared to those of a véraison-stage
cluster [23,24,42]. However, given that the low- and
high-SB berries of prevéraison clusters will emerge as
different ripening classes (Figure 1B), the ripeningrelated biochemical and hormonal features might not be
the same among all of the green prevéraison berries.
Therefore, the pericarp of high- and low-SB berries from
clusters that were at two or one week before mid-véraison
(2-wk PV and 1-wk PV), or were at mid-véraison were
analyzed separately. SB differences between low- and
high-SB berries, selected for downstream hormone and
gene expression analyses, were 1.6-, 2.4-, and 2-fold at
2-wk PV, 1-wk PV, and mid-véraison, respectively
(Figure 3A). Prevéraison clusters that were two weeks
before mid-véraison showed the highest correlation between seed and berry weights, followed by clusters at
one week prevéraison and mid-véraison (data not
shown). At 2-wk PV, all berries were at the end of the
first rapid growth stage of the berry, when growth rates
in seed and pericarp are most related [22], while at
mid-véraison, the growth of the seeds concludes and
the increase in pericarp weight is due to sugar import.
The highest SB difference was observed at 1-wk PV and
part of the rapid decrease in the ratio of the low-SB
group can be attributed to pericarp expansion independent
of seed influence (Additional file 3: Figures A and D). We
observed the most rapid weight gain due to increases in
sugars in high-SB berries after mid-véraison (Additional
file 3: Figure D). At 2-wk PV, both low- and high-SB berries in the cluster were at the same pre-ripening stage
based on similar basal sugar levels (Figure 3B). But one
week later, the low-SB berries were already in the active
sugar-accumulation phase, which indicates that these
berries had entered the ripening transition earlier even
though berries of both SB groups were still green
Page 5 of 16
(Figure 3B). In the mid-véraison cluster, low-SB berries
were in pink to red stages with sugar levels at 14%, while
high-SB berries were still at 8% (Figure 3B). In grape, seed
tannins increase from very early stages of seed and berry
development and reach a maximum around véraison, after
which they rapidly decline [22,43]. So seed extractable tannins were used to assess the seed maturity differences between low and high-SB berries. Extractable tannins were
at similar levels in the seeds of both low and high-SB berries in 2-wk PV clusters, but lower amounts of extractable
tannins in the seeds of low-SB berries at 1-wk PV suggest
that seeds were at an advanced developmental stage in
these berries (Figure 3C). These results indicate that the
developmental trajectory of the immature green berries
deviate at least before one week prior to mid-véraison,
depending on their seed content, and that the ripeningrelated differences would amplify further as the cluster
approaches véraison-stage.
Differences in auxin levels in the pericarp of low- and
high-SB berries in clusters preceding the onset of
ripening
During fruit development, auxins and cytokinins appear
to be the key regulators during the maturation phase
and when fruit becomes competent to ripen, ABA and
ethylene play a predominant role (reviewed by [41,44]).
In non-climacteric fruits that have little or no ethylene
requirement for ripening, ABA has a stronger role; the
decrease in auxin and the concomittant increase in ABA
are significant events that signal the developmental transition to ripening [24,45,46]. To examine the emergence
of auxin dynamics in low- and high-SB berries around
the onset of ripening, we observed IAA levels in the
pericarp of these berries separately in 2-wk PV clusters,
when both were at a similar pre-ripening stage, and in
1-wk PV clusters, when ripening-related sugar accumulation had begun in low-SB berries (Figure 4). The levels
of auxin in the pericarp of low-SB berries at 1-wk PV
were significantly lower compared to those in high-SB
berries (Figure 4A) and had already decreased to the
levels of mid-véraison green berries (see Figure 2A),
while those of high-SB berries remained at higher levels.
High levels of auxin in developing fruit that decline
before the initiation of ripening have been reported in
many climacteric and non-climacteric fruits such as tomato, pepper, banana, and strawberry ([38] and reviewed
by [41,47]). We observed the expression of tryptophan
aminotransferase related (TAR3) and YUC flavin monooxygenase (YUC1) to determine whether the auxin levels
observed follow the expression of auxin biosynthetic
genes in the pericarp (Figure 4B,C). These two genes
were selected based upon the literature [48] and our
transcriptomic data for berry developmental stages [30],
which indicates that their expression varies the most
Gouthu and Deluc BMC Plant Biology (2015) 15:46
Figure 3 (See legend on next page.)
Page 6 of 16
Gouthu and Deluc BMC Plant Biology (2015) 15:46
Page 7 of 16
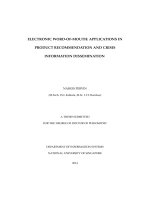
(See figure on previous page.)
Figure 3 Differences between low- and high-SB berry groups in (A) seed weight-to-berry weight ratio (SB), (B) sugar level and visual
observation, and (C) seed tannin level at two- and one-week prevéraison, and at mid-véraison (MV) cluster stages. The data represent
the berries selected for downstream hormone and expression analyses based upon their highest SB differential. Error bars are ± SEM (n = 5). In
panel B, the ripening phenotype of the berries of low and high-SB groups were indicated as dark green (green hard immature phase), light green
(green soft phase with sugar increase), and red (red colored advanced ripening phase). The data representing low and high-SB berry populations
are described in Additional file 3. Significant differences between low and high-SB at each cluster stage are indicated by asterisks (Student’s t-test,
p < 0.05). Significant differences of each SB group between the ripening stages are denoted by different letters (lower and upper case letters are
used for low and high-SB berries, respectively (Tukey’s HSD, p < 0.05)).
from prevéraison to early stages of véraison. The declining trend of auxin from 2-wk PV to 1-wk PV in the pericarp of low-SB berries followed the decrease in the
expression of TAR3, but a similar decrease in expression
in high-SB berries did not result in a decrease in IAA
(Figure 4A and B). Unlike the expression of the TAR
gene, the expression of the YUC1 gene, the rate-limiting
enzyme in the IPA pathway of IAA biosynthesis [49], did
not differ between low- and high-SB; and its expression
level in both groups was unchanged before mid-véraison
(Figure 4C). Similarly, YUC2 also showed no difference
in expression between berry groups (Additional file 4).
This suggests that local biosynthesis of auxin in the pericarp might be tapering off in both of the berry classes as
they neared the ripening transition phase, more so in
low-SB berries, and that the pericarp-synthesized auxin
levels might not be very different.
An important mechanism in auxin homeostasis is its
conjugation with amino acids and sugars, and in grape
berries, regulation of auxin levels through conjugation
with aspartic acid (IAA-Asp) by IAA-amido synthetases
(GH3) has been reported ([50] and reviewed by [51]). At
2-wk PV, the levels of IAA-asp were similar in the
pericarp of both low- and high-SB berries but IAA-Asp
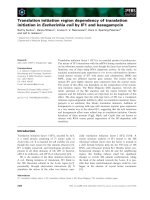
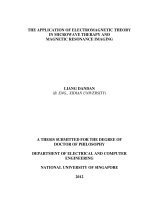
Figure 4 Hormone levels of indole-3-acetic acid (IAA) (A) and its conjugate form, IAA-Aspartic acid (IAA-Asp) (D); and the expression
levels of IAA biosynthetic genes, TAR3 (B), and YUC1 (C), in the pericarp of low and high seed weight-to-berry weight (SB) berries.
Prevéraison cluster stages were two- and one-week before véraison (2-wk PV and 1-wk PV). IAA and IAA-Asp levels were quantified by LC-MS/MS
using four replicates. Gene expression was measured by qRT-PCR and expression levels are relative to low-SB berries at 2-wk PV (n = 5). Gene
expressions were also measured at mid-véraison (MV) cluster stage. Significant differences between low- and high-SB at each cluster stage are
indicated by asterisks (Student’s t-test, p < 0.05). Significant differences of each SB group between the ripening stages are denoted by different
letters (lower and upper case letters are used for low- and high-SB berries, respectively (Tukey’s HSD, p < 0.05)).
Gouthu and Deluc BMC Plant Biology (2015) 15:46
increased fourfold in low-SB berries at 1-wk PV, concomitant with the decrease in free auxin and the increase in sugar (Figures 4D). In several plants including
grape, the reduction of auxin is accompanied by an increase in IAA-Asp before the onset of ripening, so IAAAsp has been suggested as a ripening initiator, much like
ABA ([52], reviewed by [47,53]). In the pericarp of highSB berries, which did not enter into active sugar accumulation phase until mid-véraison (see Figure 3B), IAA-Asp
levels remained low and unchanged across 2- and 1-wk
PV. The peak expression levels of GH3-1 and −2 genes
was at 1-wk and 2-wk PV, respectively, and decrease by
mid-véraison in both groups (Additional file 4). The increase in GH3-1 expression in low-SB berries from 2-wk
to 1-wk PV matched the decrease in the levels of IAA and
the increase in IAA-Asp (Figure 4A,D). However, in highSB berries, increased GH3-1 expression was not followed
by associated changes in IAA and IAA-Asp levels
(Figure 4A,D). Significant differences in the expression of GH3 genes between low- and high-SB groups
was observed at 1-wk PV, but its impact on the relative IAA and IAA-Asp levels in the pericarp of the
two berry groups could not be ascertained, as our
hormone analysis did not extend to mid-véraison
stage. Despite the local biosynthesis and homeostasis
dynamics of auxin in the pericarp, the additional hypothesized seed-sourced auxin could add substantially to the pericarp of high-SB berries, as their seed
content per berry was more than twice that of low-SB berries (see Figure 3). This could potentially confound the actual local auxin levels during the ripening transition stage,
as evidenced by the discrepancies observed between the
expression of biosynthetic genes and actual hormone
levels.
Screening of auxin responsive genes in cultured grape
cells and their induction in the pericarp of low- and
high-SB berries
Auxin signaling regulates cell responses to different
levels of auxin. The main components of signaling are
auxin response factors (ARFs) that activate or repress
the expression of auxin-dependent genes [54,55]. Recent
evidence in other models implicates specific ARF proteins that mediate auxin responses at different stages of
fruit development. Genetic studies in tomato and Arabidopsis have shown that ARF6, ARF7, ARF8, and AUX/
IAA9 [56-59] function at the fruit initiation stage, while
ARF4 is important at the ripening transition stage [60].
To examine if any of these auxin-responsive genes function in mediating the observed auxin level changes during the ripening transition in grape, expression of these
ARFs was examined in the pericarp of low- and high-SB
berries from 1-wk PV clusters, which had lower and
higher auxin levels, respectively (Figure 5B). Further, we
Page 8 of 16
assessed the auxin-responsiveness of these genes in
grape cultured cells and found that ARF4 and ARF6
genes were significantly induced in cells treated with
20 μM IAA for 2 h (Figure 5A). While both ARF4 and
ARF6 had higher expression in the pericarp of high-SB
berries, the expression of ARF4 was more than sixfold
higher. In Arabidopsis the expression of ARF4 and
ARF19 is induced by auxin [61], and the expression of
ARF genes that mediate auxin responses is cell- and
development-context specific [62] (reviewed by [63,64]).
The expression of ARF7, a negative regulator of auxin
response that inhibits fruit set in tomato, is highest in
the ovary and decreases with increasing auxin levels in
this tissue [57]. Similarly in tomato, ARF4 is preferentially
expressed in fruit around the breaker stage and its
expression levels follow the ripening-related auxin
changes in the tissue [60]. Under-expressing ARF4,
formerly designated DR12, in tomato results in dark
green, immature fruits and up-regulates the expression
of sugar metabolism-related genes [60,65]. Based upon
this evidence, our results indicate that ARF4 mediates
the response to auxin changes during the grape berry
ripening initiation, and is likely a negative regulator of
the ripening-related changes in the pericarp during
véraison.
Expression trends for ARF4 in low- and high-SB berries
show the greatest difference between both berry groups at
1-wk PV (Figure 5C), when the low-SB berries begin rapid
accumulation of sugars (see Figure 3B). However, differences in ARF4 expression between the berry groups was
obvious at 2-wk PV, when the sugars were at very similar
levels and both groups were presumably at the same preripening stage. The down-regulation of ARF4 in the pericarp of low-SB berries from 2- to 1-wk PV was more than
twelve fold (Figure 5C), concomitant with the steepest
drop in the IAA levels and the increase of sugar (Figures 4
and 3). In high-SB berries the expression level of ARF4
reached its lowest at mid-véraison (Figures 5C). Overall,
the expression of ARF4 follows the same declining trend
as auxin in the pericarp, reaching its minimum level
towards véraison from its maximum at 2-wk PV, and
coinciding with the increased expression of ripeningpromoting genes discussed in the following section.
These results indicate that the role of ARF4 during the
grape berry ripening transition is similar to its reported
role in tomato. Its expression is also indicative of the
changes in the pericarp auxin levels of high and low-SB
berries. Auxin transporters are known to be involved
in the transport of auxin from seed to pericarp and a
spatial distribution gradient of auxin flux has been
shown [15] (reviewed by [66]). In non-climacteric
strawberry, removal of achenes enhances ripening and
this enhancement could be abolished by application of
auxin [16]. These observations might suggest that
Gouthu and Deluc BMC Plant Biology (2015) 15:46
Page 9 of 16
Figure 5 Screening for Auxin response genes induced in grape cultured cells and in the pericarp of low and high seed containing
berries. (A) Induction of auxin response genes in cultured grape cells with auxin treatment (20 μM indole-3-acetic acid). The expression level is
relative to the control. (B) Expression of auxin response genes in the pericarp of berries with low and high seed weight-to-berry weight (SB) from
one-week prevéraison clusters. Expression level of high-SB is shown relative to that of low-SB. (C) Expression of ARF4 gene in the pericarp of low
and high-SB berry groups at two- and one-week prevéraison (PV), and at mid-véraison (MV). Expression levels of ARF4 are relative to those of
low-SB berries at 2-wk PV. Gene expression was analyzed by qRT-PCR and all data represent means of five replicates and error bars indicate ± SEM.
Significant differences between low- and high-SB berries at each cluster stage are indicated by asterisks (Student’s t-test, p < 0.05). Significant
differences of each SB group between the ripening stages are denoted by different letters (lower and upper case letters are used for low- and
high-SB berries, respectively (Tukey’s HSD, p < 0.05)).
auxin from seeds contributes to the differential regulation of ripening-related signaling in the pericarp of
grape berries.
Levels of ABA and ABA-related transcripts in low and
high-SB berries
The consequences of changes in auxin levels in the pericarp vary depending on the stage of the fruit development.
During early fruit development, seed-sourced auxin acts
as a signal to initiate gibberellin (GA) biosynthesis and signaling in the pericarp (reviewed by [9]), where ARF7 expression mediates auxin-GA crosstalk [67]. In the pericarp
of pea, auxin application after removal of seeds restores
GA biosynthesis and pericarp growth, which supports the
hypothesis that auxin is transported from the seeds [68].
At around ripening initiation stage, auxin represses genes
involved in ripening, such as cell-wall modifying proteins,
and those involved in sugar metabolism, and anthocyanin
biosynthesis in the pericarp [20,60,69,70]. In grape, ABA
is the hormone involved in the initiation of ripeningrelated changes, as ethylene is in climacteric fruits.
Changes in ABA levels and the expression of the main
ABA biosynthetic gene, 9-cis-epoxycarotenoid dioxygenase (NCED), and that of an ABA-responsive MYBA1, a
transcription factor involved in the anthocyanin biosynthesis, were examined in the pericarp of low- and high-SB
berries (Figure 6). Like IAA, early differences in ABA were
observed between low- and high-SB berries (Figure 6A).
The pericarp of low-SB berries exhibited a trend towards a
higher concentration of ABA, though statistically nonsignificant, compared to that of high-SB berries as early as
two weeks prior to mid-véraison. The early increase in
ABA is probably in direct response to the earlier decrease
in auxin in the pericarp of low-SB berries (Figure 4A). An
inhibitory influence of auxin on ABA during ripening has
been suggested in several fruit models, and the down-
Gouthu and Deluc BMC Plant Biology (2015) 15:46
Page 10 of 16
Figure 6 Hormone level of abscisic acid (ABA) (A), and the expression levels of ABA biosynthesis gene, NCED4 (B) and ABA-responsive
gene, MYBa1 (C) in the pericarp of low and high seed weight-to-berry weight (SB) groups. ABA levels were quantified by LC-MS/MS using
four replicates. Gene expressions were measured by qRT-PCR and expression levels are relative to those of low-SB berries at 2-wk PV (n = 5). Error
bars indicate ± SEM. Prevéraison stages were two- and one-week before véraison (2-wk PV and 1-wk PV). Gene expressions were also measured at
mid-véraison (MV) cluster stage. Significant differences between low- and high-SB berries at each cluster stage are indicated by asterisks (Student’s
t-test, p < 0.05). Significant differences of each SB group between the ripening stages are denoted by different letters (lower and upper case
letters are used for low- and high-SB berries, respectively (Tukey’s HSD, p < 0.05)).
regulation of NCED expression by auxin has been
reported [71,72]. The expression level of NCED4 was
significantly higher in the pericarp of low-SB berries
compared to that in high-SB by 1-wk PV, suggesting a
higher level of ABA synthesis (Figure 6B). These results
indicate that, depending on relative seed content, the differences in ripening-related hormones emerge in the pericarp much earlier than the onset of ripening, which
predispose the berries with lower seed content to ripen
earlier compared to those with higher seed content.
Similar to ARF4, differences in the expression of the
ABA-responsive MYBa1 gene between low- and high-SB
berries were apparent from 2-wk PV and became more
pronounced at 1-wk PV. The expression of MYBa1 in
the pericarp of high-SB berries was significantly lower
and remained comparatively lower until mid-véraison.
At this stage, auxin levels had decreased and ripening
initiation had started in low-SB berries while auxin levels
were still higher in relatively immature high-SB berries
(see Figure 4A). In strawberry, a non-climacteric fruit
like grape, expression of NCED2 and MYB10 are repressed by auxin and activated by ABA [70,72]. Further,
removal of achenes, the source of auxin, increases MYB
expression, which can be abolished by auxin application
[70]. Similarly, tomato transgenic lines under-expressing
ARF4 show enhanced expression of golden2-like (SlGLK),
a MYB-type transcription factor [60]. To check whether
these genes are direct targets of ARF4, we performed the
in silico analysis of the promoters for auxRE binding sites.
Analysis of the 2-KB promoter sequence of MYBa1 identified only the expected ABA-response elements. However,
NCED4 possesses a conserved auxRE, TGTCTC, at
position −803 and an auxin induction element, ACTTTA,
at position −1351 (data not shown), suggesting possible
negative regulation of its expression by auxin. In the 2-wk
PV cluster, both low- and high-SB berries were at a similar
immature pre-ripening physiological stage with no sugar
accumulation and only differed in their seed content
Gouthu and Deluc BMC Plant Biology (2015) 15:46
Page 11 of 16
(Figure 3). Our results suggest a relationship between
low seed content and the resulting earlier decreased
auxin levels in the pericarp of low-SB berries and the
observed higher expression of ABA-related genes that
leads to their earlier ripening.
Exogenous IAA and ABA treatment of prevéraison
clusters and changes in the composition of green, pink,
and red berries in low- and high-SB groups
To evaluate the influence of seed content on the timing
of ripening initiation through hormone signals, exogenous applications of hormones were performed on clusters one week before expected véraison. The normal
proportions of berries transitioning into the progressive
véraison-ripening stages of green, pink, and red, which
follow the SB ratio, should be perturbed when the levels
of ripening-related hormones in the pericarp are altered.
The emergence of normal proportions of green, pink,
and red berries in IAA-treated clusters at mid-véraison
was not different from that of control, while in ABAtreated clusters, fewer berries stayed green and more
transitioned to pink and red stages (Additional file 5).
However, when the proportions of the three ripening
stages in low- and high-SB berry groups were examined
separately, for which berries with low and high seed content should yield mostly colored and green berries, respectively (Figure 1B), significant changes were observed
(Figure 7). ABA treatment disrupted the proportions of
ripening stages most significantly in low-SB group, while
IAA mostly affected the high-SB berry group (Figure 7).
Decreases in the pericarp IAA level and increased synthesis of ABA are required for the onset of ripening in
many non-climacteric fruits [24,38]. One week before
véraison, at the time of hormone treatment, IAA had
not reached yet its basal level in high-SB berries and berries were probably not in the irreversible phase of the
ripening program. Exogenous IAA likely further elevates
the pericarp IAA levels and results in more berries staying green and pink that otherwise would have advanced
in ripening, as shown by other studies [20,21,72].
Ripening-related expression of genes associated with
ABA and pigment biosynthesis, and with cell wall loosening is generally inhibited by higher auxin levels [19].
On the other hand, berries with low seed content, owing
to the earlier decrease in IAA in the pericarp, had
already entered ripening initiation at the time of IAA
treatment, which made them less responsive to exogenous IAA application. But fewer berries transitioning
from pink to red stage compared to control clusters
were observed. ABA treatment caused enhanced green
to pink and red stage transitions in low-SB berries and
the treated clusters showed significantly lower number
of green low-SB berries. On the other hand, no changes
in the proportions of berries of each color in the high-
Figure 7 Effect of indole-3-acetic acid (IAA) and abscisic acid
(ABA) treatments on the composition of ripening classes in low
and high seed-to-berry weight (SB) groups. Eight days before the
expected mid-véraison, two clusters each on three different plants
were treated with 50 mg/L hormone solutions in Tween-20. Control
plants were sprayed with 0.01% Tween-20 alone. SB ratio was calculated
for each berry of the clusters at mid-véraison and the numbers of
green, pink, and red berries in low- and high-SB groups were
counted (about 300 berries per treatment). Approximate test for equal
proportions was used to identify differences in the distribution of the
ripening classes between control and treated and significant differences
were marked with asterisks (p < 0.05).
SB group could be due to higher auxin levels. These results show that the timing of the ripening transition,
which depends on both the auxin decrease and the ABA
increase in the pericarp, is influenced by the relative
seed content and its possible auxin contribution to the
pericarp, and that this mechanism can be uncoupled by
external sources of auxins.
Conclusions
The influence of seeds on pericarp ripening through the
transport of growth-regulating hormones has been demonstrated in tomato and strawberry. In grape, the influence of seed on berry growth has been extensively
studied, but its influence on the ripening has not been
elucidated. We investigated the role of seeds in the asynchronous nature of ripening among the berries of a
grape cluster at the onset of ripening. Berries with
higher seed content enter the ripening phase 4 to 14 d
later than berries with lower seed content. In addition,
the linear correlation between the seed weight-to-berry
weight ratio (SB) and berry sugar levels implicates the
seed in the regulation of the ripening transition. During
this stage, 86% of berries with low SB are in the rapid
Gouthu and Deluc BMC Plant Biology (2015) 15:46
sugar-accumulation stage and change color, whereas
78% of berries with high-SB remain green with basal
sugar levels. Differences in auxin and ABA levels in the
pericarp of low- and high-SB berry groups begin to
emerge towards the end of the fruit maturation phase, at
least two weeks pre-ripening, whereas auxin decreases
and ABA increases are delayed in high-SB berries.
Higher expression of auxin-inducible ARF4 in the pericarp of high-SB berries compared to that in low-SB berries at ripening initiation suggests that ARF4 might play
a role in mediating the ripening-related auxin responses
in grape berry. Overall, the quantitative relationship between berry seed content and pericarp auxin levels, high
auxin levels in seeds, the delaying effect of higher seed
content on ripening initiation, and the transport of auxin
from seed to pericarp reported in other fruit models together suggest that relative seed content is a major factor in the timing of entry of grape berries into the
ripening phase, and provide an explanation for the asynchronous ripening nature of a grape cluster.
Methods
Plant materials and sampling
Experiments were conducted during 2012–2013 at the
Oregon State University research experimental station
(Monroe, OR). Vitis vinifera L. cv. Pinot noir clone
‘Pommard’ grafted to 101–14 rootstock, trained in a
double guyot system with vertically positioned shoots,
was used for these experiments. Primary clusters from
five vines were used for these experiments. Clusters were
sampled at two stages of prevéraison, including late lag
phase and second growth phase, when all of the berries
were green, and at mid-véraison, when 50% of the berries in the cluster had changed color. Mid-véraison stage
was reached at approximately 69 days post-anthesis for
all clusters. Clusters sampled at each stage were transported to the laboratory on dry ice and stored at −80°C
until further analysis and were always maintained on dry
ice during the workflow of the analysis. Each berry was
weighed and dissected to separate the seed and pericarp
tissues in a brief semi-thawed state and the seeds from
each berry were weighed. A longitudinal section of frozen pulp tissue was used to measure the sugar level
(Total soluble solids, °Brix) of the berry using a digital
refractometer (SPER Scientific Inc., USA) before storing
all the tissues at −80°C. Berry sampling and analysis
methods followed for the assessment of ripening delay
times of underripe berries in Additional file 1 have been
described elsewhere [30].
Data analysis and selection of low and high seed
weight-to-berry weight ratio (SB) berries
Grape clusters from prevéraison to mid-véraison stages
were collected to observe biochemical and growth changes,
Page 12 of 16
and differences in hormone levels and gene expression
between berries of low- and high-SB groups. A minimum of three to four clusters from each stage were used
in the study and all the berries of the clusters were sampled to measure berry weight, seed weight, seed number,
and sugar level of individual berries. The seed weightto-berry weight ratio (SB) was calculated for individual
berries and pericarp weight was derived by subtracting
the seed weight from the whole berry weight. From the
range of SB values for each cluster stage, 40% each of
the berries in the higher and lower ranges were classified as high- and low-SB, respectively. Final numbers of
berries in each of the high- and low-SB categories were
about 150 berries at all three stages.
Induction of auxin-response genes in cell culture
experiments
Cell suspension cultures of Vitis vinifera (L.) cv. Gamay
Fréaux var. ‘Teinturier’ were maintained in the maintenance medium as previously described [73]. For auxin
treatment experiments, 7-day-old cell cultures were inoculated into a fresh medium at 1:4 (v:v) and allowed to
grow for 3 d. Four replicate cultures were treated with
indole-3-acetic acid solution (Sigma Life Sciences) solution in methanol (w/v), which was diluted in 1 mL of
maintenance medium to achieve a final IAA concentration of 20 μM and control cultures received an equal
volume of methanol in maintenance medium. Control
and IAA-treated cells were harvested after 2 h by filtration under vacuum, rapidly washed with fresh medium,
flash frozen in liquid nitrogen and stored at −80°C. Total
RNAs extracted from the frozen cells were used to study
the expression of IAA-induced genes.
Extractable seed tannin assay
Tannin levels in seeds were measured using a methyl
cellulose-precipitable tannin assay [74]. Seeds from five
berries representative of low- and high-SB groups that
exhibited maximum differences in seed weight-to-berry
weight ratio were selected for the assay. Seeds from each
biological replicate were homogenized in liquid nitrogen
and approximately 100 mg of fresh tissue were extracted
for 1–2 h with 1 mL of 50% ethanol. Two technical replicates for each extracted sample were used. The appropriate volume of the extract to use in 1 mL reaction was
determined through a series of dilutions. The reaction
contained the seed extract, 0.04% methyl cellulose solution, and a saturated solution of ammonium sulfate, while
parallel blank reactions contained no methyl cellulose
polymer. Tannins were precipitated by centrifugation
at 14,000 rpm for 10 min and the absorbances of the
supernatant for blank and methyl cellulose-containing
reactions were measured at 280 nm in glass cuvettes
using a Genesis 10S UV–vis spectrophotometer (Thermo
Gouthu and Deluc BMC Plant Biology (2015) 15:46
Scientific, USA). Epicatechin (Sigma-Aldrich, St. Louis,
USA) solutions at different concentrations were used to
establish a calibration curve for reporting tannin concentrations as epicatechin equivalents.
Hormone analysis in seed and pericarp tissues
For hormone analysis in the pericarp tissue of high- and
low-SB berries, five individual berries each from lowand high-SB groups that had high differences in SB were
used as biological replicates. Pericarp tissues of the selected berries were used for the quantification of abscisic acid and auxin analytes (IAA and IAA-Aspartic acid)
using LC-MS/MS under multiple-reaction monitoring
mode following the established method for grape berries
[75]. For hormone levels in skin, pulp and seed tissues,
presented in Figure 2, the experiment was conducted in
2010–2011. Pre-véraison berries were collected 54 d
after anthesis and mid-véraison-green, −pink, and -red
berries were collected 69 d post anthesis. Five clusters
each on four different plants were used for sampling
and five berries belonging to each ripening class were
sampled from each of five clusters from each plant to
make a replicate. Skin, pulp, and seed were separated
while the berries were still frozen. Homogenized and
freeze-dried tissues including deuterated internal standards for each analyte were extracted in methanol:formic acid:water (15:1:4, v:v:v) at 4°C for 20 h. The extract
was cleaned using the solid phase extraction properties
of Oasis HLB SPE and Oasis MCX cartridges (Waters,
Mildford, MA, USA) (Waters, USA). ABA and auxin
analytes bound to MCX were eluted with 100% methanol and the eluate was evaporated overnight and reconstituted with acetonitrile:water:formic acid (15:85:0.1, v:
v:v) for analysis. Chromatography separation was carried out using an Agilent Zorbax Extend-C18 column
(2.1 mm × 150 mm; 5 μm) using a binary gradient of
acetonitrile, water, and 0.1% formic acid with a gradient
program of 40 min duration. Acquisition of the mass
spectral data was performed on a hybrid triple quadrupole/linear ion trap 4000 QTrap LC-MS/MS instrument
equipped with a Turbo V source (Applied Biosystems ®,
Life Technologies, NY, USA). Mass spectra for ABA
were acquired in the negative mode while the mass
spectra for auxin compounds were acquired in the positive mode, and the analysis was performed using Analyst
software version 1.5.1 (Applied Biosystems, USA). Analyte concentrations were calculated against calibration
curves and expressed as nanograms per gram dry weight
of the tissue.
Hormone spray experiment in the prevéraison clusters
Eight days before mid-véraison, two selected primary
clusters each from three plants were treated with either
Page 13 of 16
indole-3-acetic acid (Sigma) (50 mg/L), (+)- cis, transabscisic acid (A.G. Scientific Inc., CA, USA) (50 mg/L)
solutions in 0.01% Tween-20®, or Tween-20 alone. The
clusters were sampled at mid-véraison and the same
workflow explained above was followed to record the
ripening phenotype using visual color observation, berry
weight, and seed weight for each berry.
RNA isolation and cDNA synthesis
The same individual berries used for the hormone analyses were processed for gene expression. Total RNAs
from pericarp tissue were isolated using the RNeasy
Mini Kit (Qiagen Inc., Valencia, CA, USA). Because of
the high sugar and phenolic content of the tissues, Qiagen
RLC buffer (2% polyethylene glycol (MW 20,000), 0.2 M
sodium acetate (pH 5.2), and 1% β-mercaptoethanol was
substituted for lysis buffer. For the remainder of the procedure, the manufacturer’s protocol was followed, including on-column DNase digestion (RNase-free DNase,
Qiagen, Valencia, USA). The quality and integrity of RNA
prepared RNA was assessed using 280/260 and 230/260
ratios and on agarose gel. First-strand cDNA was synthesized from 1 μg total RNA using SuperScript III Reverse
Transcriptase (Invitrogen, Carlsbad, USA) and oligo (dT)
12–18 primers in a 20-μl reaction volume. Five microliters
of the 5x- diluted cDNA was used as template in RT-PCR
reactions.
Quantitative real-time RT-PCR analysis
Gene expression levels were analyzed with the QuantiFast
SYBR Green (Qiagen) assay using an ABI 7500 Fast
Real-Time PCR System (Applied Biosystems). The
cDNAs prepared from the five individual berries were
used as biological replicates for each SB group and each
PCR reaction was performed in duplicate. The peptidylprolyl cis-trans isomerase gene (VIT_06s0004g06610),
based on its low M value [76] in pulp tissues between
prevéraison and mid-véraison stages was used for data
normalization. Oligonucleotide gene-specific primer
pairs were designed with Primer 3 software ( so that
the forward and reverse primers are located in the coding
region and 3′ untranslated region respectively (Additional
file 6). The size of the amplicons was generally between
100-125 bp. The reaction conditions were: heat activate/
denature at 95°C for 5 min (one cycle); followed by 95°C
for 10 s, 60°C for 30 s (40 cycles). The specificity of the
primers was assessed by PCR on agarose gel and that of
the real-time PCR reactions was confirmed by melting
curve analysis. The amplification products were verified by sequencing (Center for Genome Research and
Biocomputing, OSU). Data were acquired and exported
with 7500 Fast Software version 2.0.6 (Applied Biosystems)
and relative gene expression was calculated using the ΔΔCt
Gouthu and Deluc BMC Plant Biology (2015) 15:46
method. Relative fold-expression for each gene was calculated relative to the level of expression in low-SB berries at
2-wk PV.
Statistical analysis
Student’s t-test was applied to the data for comparisons
between low- and high-SB berries (P < 0.05). A one-way
ANOVA was conducted to compare the differences in
parameters in each berry group between cluster stages
followed by post-hoc means comparison using Tukey’s
HSD test (P < 0.05). For hormone spray experiments, an
approximate test for equal proportions [77] was used to
identify significant differences in the distribution of berry
ripening classes (green, pink, or red) among low- and
high-SB berry groups in treated clusters compared to
those of control.
Additional files
Additional file 1: Ripening lag in green hard, green soft, pink
compared to red berries around véraison. Progression in the
accumulation of sugars and pigments in pink, green soft, and green hard
berries of the mid-véraison cluster were followed to post-mid-véraison
stage and the times the under-ripe berries reach sugar and color levels in
red berries at mid-véraison (indicated by boxed text) were calculated [30].
The horizontal pink, light green, and dark green bars at the bottom of
the plot indicate the duration of time taken by pink, green soft, and
green hard berries, respectively to reach the sugar and color equivalent
levels of mid-véraison-red berries. Methods followed to calculate these
times and color index to measure the color level were described
elsewhere [30].
Additional file 2: Individual seed weight in green, pink and red
berries of véraison cluster. The mean calculation per ripening class is
based on more than 300 individual berries. Error bars indicate ± SEM.
Different letters denote significant difference (Tukey’s HSD test, p < 0.05).
Additional file 3: Changes in (A) Seed weight-to-berry weight ratio
(SB), (B) Sugar levels, (C) Seed weight, and (D) pericarp weight
between low and high-SB berries of the cluster from two weekprevéraison (PV) to 100% véraison (V). Data represent means of all the
berries with low- and high-SB ranges (see Methods), respectively. Number
of berries is approximately a minimum of 150 for each of low and highSB group at each cluster stage. In panel D, the ripening phenotype of the
berries of low and high-SB groups were indicated as dark green (green
immature phase), light green (green soft phase with sugar increase), red
(pink phase), and purple (red phase). Error bars represent ± SEM. Significant
differences between low- and high-SB at each cluster stage are indicated by
asterisks (t-Test, p < 0.05). Significant differences for each SB group between
the ripening stages are denoted by different letters (lower and upper
case letters are used for low and high-SB berries, respectively (Tukey’s
HSD, p < 0.05)).
Additional file 4: Expression of (A) YUC2, (B) GH3-1, and (C) GH3-2
in the pericarp of low and high-SB berries. Gene expression was
measured by qRT-PCR and expression levels are presented relative to
those of low-SB berries at 2-wk PV. All data represent means of five
replicates and error bars indicate ± SEM. Prevéraison stages were two- and
one-week before véraison (2-wk PV and 1-wk PV), and mid-véraison (MV).
Significant differences between low and high-SB groups at each cluster
stage are indicated by asterisks (t-Test, p < 0.05). Significant differences of
each SB group between the ripening stages are denoted by different letters
(lower and upper case letters are used for low and high-SB berries, respectively
(Tukey’s HSD, p < 0.05)).
Additional file 5: Percentages of green, pink, and red berries in
hormone-treated mid-véraison clusters. Two clusters each on three
Page 14 of 16
different plants were treated with 50 mg/L solutions of indole-3-acetic
acid or abscisic acid in Tween-20, or 0.01% Tween-20 one week before
the expected mid-véraison. The clusters were then harvested at midvéraison and green, pink, and red berries counted (about 300 berries per
treatment). Approximate test for equal proportions was used to identify
differences in the distribution of the ripening classes between control
and treated clusters, and significant differences were marked with
asterisks (p < 0.05).
Additional file 6: Vitis gene IDs and sequences of the primers used
in the qRT-PCR experiment.
Abbreviations
2-wk PV: Two weeks before véraison; 1-wk PV: One week before véraison;
MV: Mid-véraison stage; SB: Seed weight-to-berry weight ratio; IAA: Indole-3acetic acid; ABA: Abscisic acid; IAA-Asp: IAA-Aspartic Acid; TAR: Tryptophan
aminotransferase related; YUC: YUCCA; GH3: Gretchen Hagen3;
NCED: 9-cis-epoxycarotenoid dioxygenase.
Competing interests
The authors declare that they have no competing interests.
Authors’ contributions
LD and SG devised the study and participated in its design and
coordination; SG conducted the experiments and wrote the paper. Both the
authors read and finalized the final manuscript. Both authors read and
approved the final manuscript.
Acknowledgements
The authors would like to thank Professors Jean-Michel Mérillon and Alain
Decendit for kindly providing the grape cell lines. We thank the OSU Mass
Spectrometry facility for the analysis of hormones. OSU’s mass spectrometry
facility is supported in part by grant P30 ES00210 from the NIH/NIEHS. This
work was supported by the College of Agricultural Sciences and the Oregon
Wine Research Institute.
Received: 17 August 2014 Accepted: 23 January 2015
References
1. Gillaspy G, Ben-David H, Gruissem W. Fruits: a developmental perspective.
Plant Cell. 1993;5:1439–51.
2. Coombe BG, McCarthy MG. Dynamics of grape berry growth and
physiology of ripening. Aust J Grape Wine Res. 2000;6:131–5.
3. Stephenson AG, Delvin B, Brian HJ. The effects of seed number and prior
fruit dominance on the pattern of fruit production in Cucurbits pepo
(Zucchini squash). Ann Bot. 1988;62:653–61.
4. Walker RR, Blackmore DH, Clingeleffer PR, Kerridge GH, Rühl EH, Nicholas PR.
Shiraz berry size in relation to seed number and implications for juice and
wine composition. Aust J Grape Wine Res. 2005;11:2–8.
5. Marcelis LFM, Hofman-Eijer LRB. Effects of seed number on competition and
dominance among fruits in Capsicum annuum L. Ann Bot. 1997;79:687–93.
6. Nitsch JP. Growth and morphogenesis of the strawberry as related to auxin.
Am J Bot. 1950;37:211–5.
7. Friend A, Trought M, Creasy G. The influence of seed weight on the
development and growth of berries and live green ovaries in Vitis vinifera L.
cvs. Pinot Noir and Cabernet Sauvignon. Aust J Grape Wine Res.
2009;15:166–74.
8. Shellie KC. Water deficit effect on ratio of seed to berry fresh weight and
berry weight uniformity in winegrape cv. Merlot. Am J Enol Viticult.
2010;61:414–8.
9. Sundberg E, Ostergaard L. Distinct and dynamic auxin activities during
reproductive development. Cold Spring Harbor Perspect Biol. 2009;1:
a001628.
10. Talon M, Zacarias L, Primo-Millo E. Gibberellin and parthenocarpic ability in
developing ovaries of seedless mandarins. Plant Physiol. 1992;99:1575–81.
11. Talon M, Zacarias L, Primo-Millo E. Hormonal changes associated with fruit
set and development in mandarins different in their parthenocarpic ability.
Physiol Plantarum. 1990;79:400–6.
12. Vivian-Smith A, Koltunow A-M. Genetic analysis of growth-regulator-induced
parthenocarpy in Arabidopsis. Plant Physiol. 1999;121:437–51.
Gouthu and Deluc BMC Plant Biology (2015) 15:46
13. Mezzetti B, Landi L, Pandolfini T, Spena A. The defH9-iaaM auxin-synthesizing
gene increases plant fecundity and fruit production in strawberry and
raspberry. BMC Biotechnol. 2004;4:4.
14. Mapelli S, Frova C, Torti G, Soressi GP. Relationship between set,
development and activities of growth regulators in tomato fruits. Plant Cell
Physiol. 1978;19:1281–8.
15. Pattison RJ, Catalá C. Evaluating auxin distribution in tomato (Solanum
lycopersicum) through an analysis of the PIN and AUX/LAX gene families.
Plant J. 2012;70:585–98.
16. Given NK, Venis MA, Grierson D. Hormonal-regulation of ripening in the
strawberry, a non-climacteric fruit. Planta. 1988;174:402–6.
17. Liu K, Kang B-C, Jiang H, Moore SL, Li H, Watkins CB, et al. A GH3-like gene,
CcGH3, isolated from Capsicum chinense L. fruit is regulated by auxin and
ethylene. Plant Mol Biol. 2005;58:447–64.
18. Hershkovitz V, Friedman H, Goldschmidt EE, Feygenberg O, Pesis E. Effect of
seed on ripening control components during avocado fruit development. J
Plant Physiol. 2011;168:2177–83.
19. Aharoni A. Novel insight into vascular, stress, and auxin-dependent and
-independent gene expression programs in strawberry, a non-climacteric
fruit. Plant Physiol. 2002;129:1019–31.
20. Davies C, Boss PK, Robinson SP. Treatment of grape berries, a
nonclimacteric fruit with a synthetic auxin, retards ripening and alters the
expression of developmentally regulated genes. Plant Physiol.
1997;115:1155–61.
21. Böttcher C, Harvey K, Forde CG, Boss PK, Davies C. Auxin treatment of
pre-veraison grape (Vitis vinifera L.) berries both delays ripening and
increases the synchronicity of sugar accumulation. Aust J Grape Wine Res.
2010;17:1–8.
22. Ristic R, Iland P. Relationships between seed and berry development of Vitis
vinifera L. cv Shiraz: developmental Changes in seed morphology and
phenolic composition. Aust J Grape Wine Res. 2005;11:43–58.
23. Zhang XR, Luo GG, Wang RH, Wang J, Hilmerick DG. Growth and
developmental responses of seeded and seedless grape berries to shoot
girdling. J Am Soc Hort Sci. 2003;128:316–23.
24. Davies C, Böttcher C. Hormonal control of grape berry ripening. In:
Roubelakis-Angelakis KA, editor. Grapevine molecular physiology &
biotechnology. 2nd ed. 2009. p. 229–62.
25. Gorchov DL. Fruit ripening asynchrony is related to variable seed number in
Amelanchier and Vaccinium. Am J Bot. 1985;72:1939–43.
26. Coombe B. Adoption of a system for identifying grapevine growth stages.
Aust J Grape Wine Res. 1995;1:100–10.
27. Deluc LG, Grimplet J, Wheatley MD, Tillett RL, Quilici DR, Osborne C, et al.
Transcriptomic and metabolite analyses of Cabernet Sauvignon grape berry
development. BMC Genomics. 2007;8:429.
28. Lund ST, Peng FY, Nayar T, Reid KE, Schlosser J. Gene expression analyses in
individual grape (Vitis vinifera L.) berries during ripening initiation reveal that
pigmentation intensity is a valid indicator of developmental staging within
the cluster. Plant Mol Biol. 2008;68:301–15.
29. Zenoni S, Ferrarini A, Giacomelli E, Xumerle L, Fasoli M, Malerba G, et al.
Characterization of transcriptional complexity during berry development in
Vitis vinifera using RNA-seq. Plant Physiol. 2010;152:1787–95.
30. Gouthu S, O’Neil ST, Di Y, Ansarolia M, Megraw M, Deluc LG. A comparative
study of ripening among berries of the grape cluster reveals an altered
transcriptional programme and enhanced ripening rate in delayed berries.
J Exp Bot. 2014;65:5889–902.
31. Cadot Y, Miñana-Castelló MT, Chevalier M. Anatomical, histological, and
histochemical changes in grape seeds from Vitis vinifera L. cv Cabernet franc
during fruit development. J Agric Food Chem. 2006;54:9206–15.
32. Cawthon D, Morris J. Relationship of seed number and maturity to berry
development, fruit maturation, hormonal changes, and uneven ripening of
Concord (Vitis labrusca L. ) grapes. J Am Soc Hort Sci. 1982;107:1097–104.
33. Kennedy JA, Troup GJ, Pilcrow JR, Hutton DR, Hewitt D, Hunter CR, et al.
Development of seed polyphenols in berries from Vitis vinifera L. cv. shiraz.
Aust J Grape Wine Res. 2000;6:244–54.
34. Ojeda H, Deloire A, Carbonneau A, Ageorges A, Romieu C. Berry
development of grapevines: relations between the growth of berries and
their DNA content indicate cell multiplication and enlargement. Vitis.
1999;38:145–50.
35. Nambara E, Okamoto M, Tatematsu K, Yano R, Seo M, Kamiya Y. Abscisic
acid and the control of seed dormancy and germination. Seed Sci Res.
2010;20:55.
Page 15 of 16
36. Liu X, Zhang H, Zhao Y, Feng Z, Li Q, Yang H-Q, et al. Auxin controls seed
dormancy through stimulation of abscisic acid signaling by inducing
ARF-mediated ABI3 activation in Arabidopsis. Proc Natl Acad Sci.
2013;110:15485–90.
37. Ozga JA, Van Huizen R, Reinecke DM. Hormone and seed-specific regulation
of pea fruit growth. Plant Physiol. 2002;128:1379–89.
38. Symons GM, Chua YJ, Ross JJ, Quittenden LJ, Davies NW, Reid JB.
Hormonal changes during non-climacteric ripening in strawberry. J Exp
Bot. 2012;63:4741–50.
39. Faure O, Dewitte W, Nougarede A, Van Onckelen H. Precociously
germinating somatic embryos of Vitis vinifera have lower ABA and
IAA levels than their germinating zygotic counterparts. Physiol
Plantarum. 1998;102:591–5.
40. Tiwari A, Vivian-Smith A, Ljung K, Offringa R, Heuvelink E. Physiological and
morphological changes during early and later stages of fruit growth in
Capsicum annuum. Physiol Plantarum. 2013;147:396–406.
41. McAtee P, Siti K, Schaffer R, David K. A dynamic interplay between
phytohormones is required for fruit development, maturation, and ripening.
Front Plant Sci. 2013;4:79.
42. Wheeler S, Loveys B, Ford C, Davies C. The relationship between the
expression of abscisic acid biosynthesis genes, accumulation of abscisic acid
and the promotion of Vitis vinifera L. berry ripening by abscisic acid. Aust J
Grape Wine Res. 2009;15:195–204.
43. Kennedy JA, Matthews M, Waterhouse A. Changes in grape seed
polyphenols during fruit ripening. Phytochemistry. 2000;55:77–85.
44. Giovannoni JJ. Genetic regulation of fruit development and ripening. Plant
Cell. 2004;16:S170–80.
45. Symons GM, Davies C, Shavrukov Y, Dry IB, Reid JB, Thomas MR. Grapes on
steroids. Brassinosteroids are involved in grape berry ripening. Plant Physiol.
2006;140:150–8.
46. Jia HF, Chai YM, Li CL, Lu D, Luo JJ, Qin L, et al. Abscisic acid plays an
important role in the regulation of strawberry fruit ripening. Plant Physiol.
2011;157:188–99.
47. Osorio S, Fernie AR. Biochemistry of fruit ripening. In: Seymour GB, Poole M,
Giovannoni JJ, editors. The molecular biology and biochemistry of fruit
ripening. 1st ed. Tucker GA: John Wiley & Sons, Inc; 2013. p. 1–20.
48. Böttcher C, Burbidge CA, Boss PK, Davies C. Interactions between ethylene
and auxin are crucial to the control of grape (Vitis vinifera L.) berry ripening.
BMC Plant Biol. 2013;13:222.
49. Mashiguchi K, Tanaka K, Sakai T, Sugawara S, Kawaide H, Natsume M, et al.
The main auxin biosynthesis pathway in Arabidopsis. Proc Natl Acad Sci.
2011;108:18512–7.
50. Böttcher C, Boss PK, Davies C. Acyl substrate preferences of an IAA-amido
synthetase account for variations in grape (Vitis vinifera L.) berry ripening
caused by different auxinic compounds indicating the importance of auxin
conjugation in plant development. J Exp Bot. 2011;62:4267–80.
51. Ludwig-Muller J. Auxin conjugates: their role for plant development and in
the evolution of land plants. J Exp Bot. 2011;62:1757–73.
52. Böttcher C, Keyzers RA, Boss PK, Davies C. Sequestration of auxin by the
indole-3-acetic acid-amido synthetase GH3-1 in grape berry (Vitis vinifera L.)
and the proposed role of auxin conjugation during ripening. J Exp Bot.
2010;61:3615–25.
53. Ljung K. Auxin metabolism and homeostasis during plant development.
Development. 2013;140:943–50.
54. Chapman EJ, Estelle M. Mechanism of auxin-regulated gene expression in
plants. Annu Rev Genet. 2009;43:265–85.
55. Pierre-Jerome E, Moss BL, Nemhauser JL. Tuning the auxin transcriptional
response. J Exp Bot. 2013;64:2557–63.
56. Liu N, Wu S, Van Houten J, Wang Y, Ding B, Fei Z, et al. Down-regulation
of AUXIN RESPONSE FACTORS 6 and 8 by microRNA 167 leads to floral
development defects and female sterility in tomato. J Exp Bot.
2014;65:2507–20.
57. de Jong M, Wolters-Arts M, Feron R, Mariani C, Vriezen WH. The Solanum
lycopersicum auxin response factor 7 ( SlARF7) regulates auxin signaling
during tomato fruit set and development. Plant J. 2009;57:160–70.
58. Goetz M, Hooper LC, Johnson SD, Rodrigues JC, Vivian-Smith A, Koltunow
AM. Expression of aberrant forms of AUXIN RESPONSE FACTOR8 stimulates
parthenocarpy in Arabidopsis and tomato. Plant Physiol. 2007;145:351–66.
59. Wang H, Jones B, Li Z, Frasse P, Delalande C, Regad F, et al. The tomato
Aux/IAA transcription factor IAA9 is involved in fruit development and leaf
morphogenesis. Plant Cell. 2005;17:2676–92.
Gouthu and Deluc BMC Plant Biology (2015) 15:46
60. Sagar M, Chervin C, Mila I, Hao Y, Roustan JP, Benichou M, et al. SlARF4, an
auxin response factor involved in the control of sugar metabolism during
tomato fruit development. Plant Physiol. 2013;161:1362–74.
61. Paponov IA, Paponov M, Teale W, Menges M, Chakrabortee S, Murray JAH,
et al. Comprehensive transcriptome analysis of auxin responses in
Arabidopsis. Mol Plant. 2008;1:321–37.
62. Zouine M, Fu Y, Chateigner-Boutin AL, Mila I, Frasse P, Wang H, et al.
Characterization of the tomato ARF gene family uncovers a multi-levels posttranscriptional regulation including alternative splicing. PLoS One. 2014;9:e84203.
63. Kieffer M, Neve J, Kepinski S. Defining auxin response contexts in plant
development. Curr Opin Plant Biol. 2010;13:12–20.
64. Bargmann B, Estelle M. Auxin perception: in the IAA of the beholder. Physiol
Plantarum. 2014;151:52–61.
65. Jones B, Frasse P, Olmos E, Zegzouti H, Li ZG, Latché A, et al. Down-regulation
of DR12, an auxin-response-factor homolog, in the tomato results in a
pleiotropic phenotype including dark green and blotchy ripening fruit.
Plant J. 2002;32:603–13.
66. Pattison RJ, Csukasi F, Catalá C. Mechanisms regulating auxin action during
fruit development. Physiol Plantarum. 2014;151:62–72.
67. de Jong M, Wolters-Arts M, Garcia-Martinez JL, Mariani C, Vriezen WH. The
Solanum lycopersicum Auxin response factor 7 (SlARF7) mediates cross-talk
between auxin and gibberellin signalling during tomato fruit set and
development. J Exp Bot. 2011;62:617–26.
68. Ozga JA, Reinecke DM, Ayele BT, Ngo P, Nadeau C, Wickramarathna AD.
Developmental and hormonal regulation of gibberellin biosynthesis and
catabolism in pea fruit. Plant Physiol. 2009;150:448–46.
69. Catalá C, Rose JKC, Bennett AB: Auxin-regulated genes encoding cell
wall-modifying proteins are expressed during early tomato fruit growth.
Plant Physiol. 2000;122:527–34.
70. Medina-Puche L, Cumplido-Laso G, Amil-Ruiz F, Hoffmann T, Ring L,
Rodriguez-Franco A, et al. MYB10 plays a major role in the regulation of
flavonoid/phenylpropanoid metabolism during ripening of Fragaria x
ananassa fruits. J Exp Bot. 2014;65:401–17.
71. Ji K, Chen P, Sun L, Wang Y, Dai S, Li Q, et al. Non-climacteric ripening in
strawberry fruit is linked to ABA, FaNCED2 and FaCYP707A1. Funct Plant
Biol. 2012;39:351.
72. Ziliotto F, Corso M, Rizzini FM, Rasori A, Botton A, Bonghi C. Grape berry
ripening delay induced by a pre-veraison NAA treatment is paralleled by a
shift in the expression pattern of auxin- and ethylene-related genes. BMC
Plant Biol. 2012;12:185.
73. Decendit A, Merillon J-M. Condensed tannin and anthocyanin production in
Vitis vinifera cell suspension cultures. Plant Cell Rep. 1996;15:762–5.
74. Sarneckis CJ, Dambergs RG, Jones P. Quantification of condensed tannins
by precipitation with methyl cellulose: development and validation of an
optimised tool for grape and wine analysis. Australian J Grape Wine Res.
2006;12:39–49.
75. Gouthu S, Morre J, Maier CS, Deluc LG. An analytical method to quantify
three plant hormone families in grape berry using liquid chromatography
and multiple reaction monitoring mass spectrometry. In: David GR, editor.
Phytochemicals, plant growth, and the environment. Volume 42. New York,
NY: Springer New York; 2012. p. 19–36.
76. Vandesompele J, De Preter K, Pattyn F, Poppe B, Van Roy N, De Paepe A,
et al. Accurate normalization of real-time quantitative RT-PCR data by
geometric averaging of multiple internal control genes. Genome Biol.
2002;3:0034.1–0034.11.
77. Ramsey FL, Schafer DW. Comparison of proportions or odds. In: Ramsey FL,
Schafer DW, editors. The statistical sleuth a course in methods of data
analysis. 2nd ed. California: Duxbury: Pacific Groove; 2002. p. 529–51.
Page 16 of 16
Submit your next manuscript to BioMed Central
and take full advantage of:
• Convenient online submission
• Thorough peer review
• No space constraints or color figure charges
• Immediate publication on acceptance
• Inclusion in PubMed, CAS, Scopus and Google Scholar
• Research which is freely available for redistribution
Submit your manuscript at
www.biomedcentral.com/submit