Identification of QTLs affecting scopolin and scopoletin biosynthesis in Arabidopsis thaliana
Bạn đang xem bản rút gọn của tài liệu. Xem và tải ngay bản đầy đủ của tài liệu tại đây (1.17 MB, 14 trang )
Siwinska et al. BMC Plant Biology 2014, 14:280
/>
RESEARCH ARTICLE
Open Access
Identification of QTLs affecting scopolin and
scopoletin biosynthesis in Arabidopsis thaliana
Joanna Siwinska1, Leszek Kadzinski1, Rafal Banasiuk1, Anna Gwizdek-Wisniewska1, Alexandre Olry2,3,
Bogdan Banecki1, Ewa Lojkowska1 and Anna Ihnatowicz1*
Abstract
Background: Scopoletin and its glucoside scopolin are important secondary metabolites synthesized in plants as a
defense mechanism against various environmental stresses. They belong to coumarins, a class of phytochemicals with
significant biological activities that is widely used in medical application and cosmetics industry. Although numerous
studies showed that a variety of coumarins occurs naturally in several plant species, the details of coumarins biosynthesis
and its regulation is not well understood. It was shown previously that coumarins (predominantly scopolin and
scopoletin) occur in Arabidopsis thaliana (Arabidopsis) roots, but until now nothing is known about natural variation of
their accumulation in this model plant. Therefore, the genetic architecture of coumarins biosynthesis in Arabidopsis has
not been studied before.
Results: Here, the variation in scopolin and scopoletin content was assessed by comparing seven Arabidopsis accessions.
Subsequently, a quantitative trait locus (QTL) mapping was performed with an Advanced Intercross Recombinant Inbred
Lines (AI-RILs) mapping population EstC (Est-1 × Col). In order to reveal the genetic basis of both scopolin and scopoletin
biosynthesis, two sets of methanol extracts were made from Arabidopsis roots and one set was additionally subjected to
enzymatic hydrolysis prior to quantification done by high-performance liquid chromatography (HPLC). We identified one
QTL for scopolin and five QTLs for scopoletin accumulation. The identified QTLs explained 13.86% and 37.60% of the
observed phenotypic variation in scopolin and scopoletin content, respectively. In silico analysis of genes located in the
associated QTL intervals identified a number of possible candidate genes involved in coumarins biosynthesis.
Conclusions: Together, our results demonstrate for the first time that Arabidopsis is an excellent model for studying the
genetic and molecular basis of natural variation in coumarins biosynthesis in plants. It additionally provides a basis for fine
mapping and cloning of the genes involved in scopolin and scopoletin biosynthesis. Importantly, we have identified new
loci for this biosynthetic process.
Keywords: Coumarins, Natural variation, Plant-environment interaction, Scopoletin, Scopolin, Secondary metabolism,
QTL mapping
Background
Plants produce a great variety of secondary metabolites. It
is estimated that between 4000 to 20 000 metabolites per
species can be expected [1]. This great biochemical diversity
reflects the variety of environments in which plants live,
and the way they have to deal with different environmental
stimuli. The production of specialized secondary metabolites is assumed to protect plants against biotic and abiotic
stresses [2]. Although Arabidopsis is a small plant with
* Correspondence:
1
Intercollegiate Faculty of Biotechnology of University of Gdansk and Medical
University of Gdansk, ul. Kladki 24, Gdansk 80-822, Poland
Full list of author information is available at the end of the article
short generation time and highly reduced genome, it
has a set of secondary metabolites that is as abundant
and diverse as those of other plant taxa [3]. In recent
years, this model plant was extensively used towards
identification of genes and enzymes working in a complex network involved in secondary metabolites biosynthesis and regulation [4].
Currently, genetic variation found between natural
Arabidopsis accessions is an important basic resource for
plant biology [5-7]. Arabidopsis with its extensive genetic
natural variation provides an excellent model to study
variation in the biosynthesis of secondary metabolites in
natural populations. Recent genetic analysis of natural
© 2014 Siwinska et al.; licensee BioMed Central Ltd. This is an Open Access article distributed under the terms of the Creative
Commons Attribution License ( which permits unrestricted use, distribution, and
reproduction in any medium, provided the original work is properly credited. The Creative Commons Public Domain
Dedication waiver ( applies to the data made available in this article,
unless otherwise stated.
Siwinska et al. BMC Plant Biology 2014, 14:280
/>
variation in untargeted metabolic composition uncovered
many qualitative and quantitative differences in metabolite accumulation between Arabidopsis accessions [8-10].
Numerous studies [8,10-12] proved the presence of abundant genetically controlled variation for various classes of
secondary metabolites. Coumarins (scopoletin, scopolin,
skimmin and esculetin) are one of the secondary metabolite classes found in Arabidopsis’ roots [13-16]. But up to
now, nothing is known about natural variation in coumarins content between Arabidopsis accessions.
Coumarins are a group of important natural compounds
that provide for the plant antimicrobial and antioxidative
activities, and are produced as a defence mechanism
against pathogen attack and abiotic stresses [17]. Importantly, coumarins are widely recognized in the pharmaceutical industry for their wide range of therapeutic activities
and are an active source for drug development. Numerous
coumarins have medical application in the treatment of
burns and rheumatoid diseases. Furanocoumarins, which
are coumarin derivatives, are used in the treatment of
leucoderma, vitiligo and psoriasis [18], due to their photoreactive properties. Moreover, they are used in symptomatic treatment of demyelinating diseases, particularly
multiple sclerosis [19]. Furanocoumarin-producing plants
that are currently studied are non-model organisms [20]
and many approaches to identify the genes underlying
genetic variation in coumarins accumulation are not yet
available in those species. Scopoletin, which is a major coumarin compound of Arabidopsis, has been found in many
plant species [21-29], and was clearly shown to have antifungal and antibacterial activities important for medical
purposes [30]. All these properties make coumarins attractive from the commercial point of view.
Coumarins are derived from phenylopropanoid pathway,
which serves as a rich source of metabolites in plants
[31,32]. It was suggested that in Arabidopsis several branch
pathways leading from phenylpropanoid compounds to
coumarins are probable [14]. Scopoletin and scopolin biosynthesis was shown to be strongly dependent on the
CYP98A3 [14], which is the cytochrome P450 catalyzing
3′-hydroxylation of p-coumarate units in the phenylpropanoid pathway [33]. The feruloyl-CoA was suggested to be a
major precursor in scopoletin biosynthesis [15]. A key enzyme involved in the final step of scopoletin biosynthesis,
which is the conversion of feruloyl-CoA into 2-hydroxyferuloyl-CoA, is encoded by a member of the iron (Fe) IIand 2-oxoglutarate-dependent dioxygenase (2OGD) family,
designated as F6′H1 [15]. Despite the advances that have
been made in previous years [15,34-42] (Figure 1), many
questions with regard to coumarins biosynthesis are still
open [43]. In particular, the regulation of the biosynthesis
of coumarins is not well understood. Up to now, all studies
investigating coumarins biosynthesis in the model plant
Arabidopsis were done with one laboratory accession
Page 2 of 14
Col-0, which was used as the genetic background of all
mutant and transgenic plants.
To gain an understanding of the genetic architecture of
coumarins biosynthesis, we screened a set of Arabidopsis
accessions for variation in scopolin and scopoletin content, and subsequently conducted a quantitative trait locus
(QTL) mapping. Our study addressed the following questions. Is there a natural variation in accumulation of
scopolin and scopoletin between Arabidopsis accessions
and what are genetic regions responsible for the observed
differences? What are candidate genes possibly underlying
QTLs involved in scopolin and scopoletin biosynthesis?
Results
Phenotypic variation between accessions
A set of seven natural Arabidopsis accessions, which are
the parents of existing RIL populations and represent accessions from different locations, were used in the initial
screening for variation in scopolin and scopoletin accumulation. Accessions were grown in vitro in liquid cultures in
order to obtain the optimal growth of plant roots. Under
these conditions, most of the scopoletin is stored in root
cells in vacuoles as its glycoside form, scopolin. In order to
reveal the content of both scopolin and that of scopoletin, a
subset of the methanol extracts made from Arabidopsis
roots were subjected to enzymatic hydrolysis in order to
hydrolyze the glycoside forms of coumarins. Using highperformance liquid chromatography (HPLC), we detected
in the roots scopoletin (sct in Figure 2), as well as scopolin
(scl in Figure 2BC). The identification of scopoletin in
HPLC fraction (Figure 3A) was further confirmed using gas
chromatography/mass spectrometry (GC/MS) by comparison to spectrum library (Figure 3B). The quantification of
coumarins in methanol root extracts made from seven
Arabidopsis accessions clearly showed the presence of natural variation in scopolin content before enzymatic hydrolysis (Figure 4A) and scopoletin after hydrolysis (Figure 4B).
In spite of the fact that scopolin standard was not available and in order to unify further analysis, we measured
the amounts of both scopolin and scopoletin as area%
of total chromatogram signals. The statistically significant differences between group means for scopolin and
scopoletin accumulation were determined by one-way
ANOVA (p < 0.001 and p < 0.0001, respectively). Values
that are not significantly different based on the post hoc
test (least significant differences [LSD]) are indicated by the
same letters (Figure 4). Based on the obtained results we
have selected an Advanced Intercross Recombinant Inbred
Lines (AI-RILs) mapping population derived from the cross
between Col-0 and Est-1, because these parents significantly differed in coumarins content. Further genetic analysis was performed using values for the accumulation of
scopolin before enzymatic hydrolysis and the content of
scopoletin after hydrolysis of methanol extracts.
Siwinska et al. BMC Plant Biology 2014, 14:280
/>
Page 3 of 14
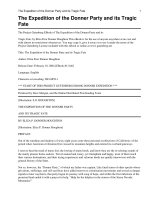
Figure 1 The chemical structures of scopoletin and scopolin and their biosynthetic pathway in Arabidopsis thaliana. Cloned and characterized
genes encoding enzymes for scopoletin and scopolin biosynthesis are shown. The corresponding references [15,34-42] are listed in the Reference
section. The isoenzymes indicated by an asterisk (*) were functionally annotated by the in-house Ensemble Enzyme Prediction Pipeline (E2P2, version
2.0) (Plant Metabolic Network, The presented molecules were created using website.
(4CL1) 4-coumarate:CoA ligase 1. (4CL2) 4-coumarate:CoA ligase 2. (4CL3) 4-coumarate:CoA ligase 3. (4CL5) 4-coumarate:CoA ligase 5. (C3H)
p-coumaroyl 3′-hydroxylase. (CCoAOMT1) caffeoyl coenzyme A dependent O-methyltransferase 1. (CCoAOMT7) caffeoyl coenzyme A dependent
O-methyltransferase 7. (F6′H1) feruloyl-CoA 6′-hydroxylase 1. (F6′H2) feruloyl-CoA 6′-hydroxylase 2. (HCT) shikimate O-hydroxycinnamoyltransferase.
(OMT1) caffeate O-methyltransferase 1. (TSM1) tapetum-specific O- methyltransferase.
Genetic analyses of scopolin and scopoletin accumulation
The scopoletin and scopolin content values were determined for three biological replicates of AI-RILs (n = 144
and n = 140, respectively) and parental lines, which were
grown in independent flasks in liquid cultures. A set of
lines (AI-RILs) showed a wider range of scopolin
(Figure 5A) and scopoletin (Figure 5B) values than the ones
observed for both parental lines (Col-0 and Est-1), which
indicated the presence of transgressive segregation and suggested that multiple loci contribute to variation in the EstC
population. The lowest scopolin content within AI-RILs
was 1.90 (measured as an area% of total chromatogram
signals) that corresponds to 20% of the minimum Col-0
value. The maximal relative value of scopolin was 45.13,
which corresponds to 159% of the maximal Est-1 value.
For scopoletin content, these values were respectively 7.82
(54% of the minimum Col-0 value) and 54.93 (159% of the
maximal Est-1 value) (Table 1). Having a commercially
available scopoletin standard, we were able to quantify the
scopoletin contents as μg/g fresh weight (μg/gFW) in both
parental lines of the AI-RILs mapping population (Col-0
and Est-1) before and after enzymatic hydrolysis. The scopoletin levels in root samples not subjected to hydrolysis
were ~3 μg/gFW and ~10 μg/gFW in Col-0 and Est-1
respectively, and ~16 μg/gFW and ~86 μg/gFW in samples after hydrolysis. These values correspond to ~18, 54,
82 and 449 nmol/gFW respectively that is in the range
found in the literature data, which vary from ~1 to
1200 nmol/gFW depending on plant culture being used
[14]. The calculated quantities of parental lines (Table 2)
can be used as references for the overall quantity of the
products in the whole mapping population.
In order to identify the fraction of variation that is
genetically determined, the broad sense heritability (H2)
for scopolin and scopoletin content was estimated as described in Methods section. In the AI-RIL population,
Siwinska et al. BMC Plant Biology 2014, 14:280
/>
Page 4 of 14
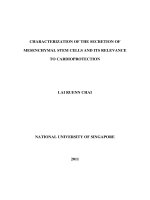
Figure 2 Chromatograms of scopoletin standard and methanol extracts from Arabidopsis thaliana roots. The column effluent was monitored
with fluorescence detector with excitation at 340 nm and emission at 460 nm. The peak for glucoside of scopoletin – scopolin (scl); the
peak for scopoletin (sct). (A) Chromatogram of scopoletin standard. (B) Chromatogram of methanol extract from Arabidopsis roots before
enzymatic hydrolysis. (C) Chromatogram of methanol root extract subjected to hydrolysis using β-glucosidase. The peak for scopoletin is a
dominant peak of total chromatogram.
Siwinska et al. BMC Plant Biology 2014, 14:280
/>
Page 5 of 14
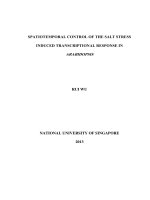
Figure 3 Mass spectra of HPLC scopoletin fraction and scopoletin standard. (A) GC/MS spectrum of the scopoletin fraction of methanol
extract from Arabidopsis thaliana roots subjected to enzymatic hydrolysis. (B) Scopoletin standard library spectrum.
the broad sense heritability ranged from 0.45 for scopoletin to 0.50 for scopolin content (Table 1). To explore
the relationship between scopolin content in methanol
root extracts before enzymatic hydrolysis and scopoletin
levels in extracts subjected to hydrolysis, the mean values
of coumarins for each AI-RILs were used as phenotype
values in trait correlation analysis. A relatively strong genetic correlation (R2 = 0.6634) was observed between the
level of coumarins measured before and after hydrolysis in
the AI-RILs population, indicating genetic co-regulation
of scopolin and scopoletin biosynthesis (Figure 6).
Mapping QTLs for scopolin and scopoletin accumulation
Six QTLs were identified, with one QTL being detected for
scopolin and five QTLs for scopoletin accumulation
(Table 3). The QTL effect sizes ranged from the 7.0% to
16.7% of the phenotypic variance explained by the QTL
(PVE), with three of the six QTLs having effect sizes below
10% PVE. One QTL (SCL1) was detected for scopolin
accumulation at the bottom of chromosome 5 (Figure 7)
explaining the 13.86% PVE (Table 3), and five QTLs
(SCT1 - SCT5) for scopoletin accumulation were identified on chromosome 1, 3 and 5 (Figure 8, Table 3). No
QTLs were detected on chromosome 2 and 4. To improve
the QTL model explaining variation in a scopoletin content, the MQM approach was performed using two QTLs
(SCT4 and SCT5) as cofactors. We have included in the
model QTL on chromosome 1 (SCT1), despite its LOD
score was slightly below the threshold (3.327). The whole
model explains 37.6% variance for scopoletin content. No
epistasis between the main effect loci were detected.
QTL mapping identifies known and new loci for
coumarins biosynthesis
Some of the mapped QTLs underlying variation in scopolin (SCL1) and scopoletin (SCT1 and SCT2) accumulation
in the AI-RILs population, co-localize with the genes annotated to be involved in coumarin biosynthetic process
(Plant Metabolic Network, Figure 1).
We detected seven cloned and characterized genes encoding enzymes for scopoletin and scopolin biosynthesis that
co-localize with detected QTLs (see Additional file 1).
Within the SCL1 interval, which is characterized by one of
the highest LOD score values, there are two very good candidates. One of them is At5g48930 encoding a shikimate
O-hydroxycinnamoyltransferase (HCT), while the other
one (At5g54160) encodes caffeic acid/5-hydroxyferulic acid
O-methyltransferase (OMT1). Importantly, both genes are
Siwinska et al. BMC Plant Biology 2014, 14:280
/>
Page 6 of 14
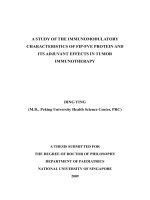
Figure 4 Relative levels of scopolin and scopoletin in the roots of seven Arabidopsis thaliana accessions. (A) Scopolin level in methanol root
extracts without hydrolysis (H-). (B) Scopoletin content in the methanol extracts that were subjected to enzymatic hydrolysis (H+) prior to quantification.
The statistically significant differences between group means for scopolin and scopoletin accumulation were determined by one-way ANOVA (p < 0.001
and p < 0.0001, respectively). Values that are not significantly different based on the post hoc test (least significant differences [LSD]) are indicated by the
same letters. The data analysis consisted of scopolin and scopoletin relative levels measured as area% of total chromatogram signals. Error bars represent
the SD from three measurements.
expressed in roots (SCL1 in Table 4). Within the SCT1 and
SCT2 intervals underlying variation in scopoletin content
more possible candidate genes were detected: At1g33030,
At1g51990, At1g67980 and At1g67990 (TSM1) encoding
proteins from O-methyltransferase family; At1g51680 and
At1g65060 encoding isoforms of 4-coumarate:CoA ligase
(4CL1 and 4CL3 respectively); At1g62940 encoding acylCoA synthetase (ACOS5); and At1g55290 encoding feruloyl CoA ortho-hydroxylase 2 (F6′H2).
In order to reveal other candidate genes possibly underlying detected QTLs, two QTLs for scopoletin content
(SCT4 and SCT5) and one QTL associated with scopolin
(SCL1) accumulation were chosen for further in silico analyses. The selected intervals are characterized by the highest percentage of phenotypic variance explained by each
QTL and the highest LOD score values. The annotated
functions for all genes located in the selected QTL intervals were checked. As a result, we selected genes encoding
transcription factors that might be induced by environmental stresses and enzymes that according to the annotation
functions could be possibly involved in scopolin and scopoletin biosythensis. Subsequently, we performed in silico
analysis of the tissue distribution and level of expression of
selected genes. Only genes that were expressed in roots
were selected as possible candidates for further studies. As
a result, we selected a set of genes that deserve close attention as possible new loci underlying variation in scopolin
and scopoletin accumulation (Table 4). Among candidates
possibly involved in scopoletin accumulation, a particularly
interesting one is a CYP81D11 gene (At3g28740) encoding a member of the cytochrome P450 family, which is
located within the QTL on chromosome 3 (SCT4 in
Siwinska et al. BMC Plant Biology 2014, 14:280
/>
Page 7 of 14
Figure 5 Frequency distribution of scopolin and scopoletin relative levels in the AI-RILs and parental lines roots. Plants used for genetic
mapping were grown in in vitro liquid cultures under a photoperiod of 16 h light (35 μmol m−2 s−1) at 20°C and 8 h dark at 18°C. Coumarins content
in the roots of the AI-RILs population and parental lines (accessions Col-0 and Est-1) were determined by HPLC. (A) Scopolin contents were determined
in methanol extracts without hydrolysis. (B) Methanol extracts subjected to enzymatic hydrolysis were used for scopoletin quantification. The data
analysis consisted of scopolin and scopoletin relative levels measured as area% of total chromatogram signals. The average values of Col-0 and Est-1
are indicated with arrows.
Table 4). According to the 1001 Genomes Project database (www.1001genomes.org) and re-sequencing data of
Est-1 from our laboratory (see Additional files 2 and 3, indicated as Est-1*), the CYP81D11 gene contains several
SNPs and one indel in the coding sequences of the parental lines of EstC mapping population and in the other
accessions tested in this study (see Additional file 2).
Other interesting candidates are three genes (At5g14340,
At5g14750, At5g15130) located within the QTL interval
on chromosome 5 (SCT5 in Table 4), which encode members of the MYB and WRKY transcription factor families.
These genes are relatively highly expressed in roots and
their expression is induced by various environmental
stresses [44]. A particularly interesting candidate that
Table 1 Parental values, ranges and heritabilities in the AI-RILs of scopolin and scopoletin content (relative valuesa)
Parents
AI-RIL
Trait
Col-0 valuea
Est-1 valuea
Range
Mean
Heritabilityd
Scopolin (H-)b
9.71
28.45
1.9-45.13
19.84
0.50
Scopoletin (H+)c
14.58
34.53
7.82-54.93
29.68
0.45
a
Relative levels measured as an area% of total chromatogram signals (as described in Methods section).
b
Content of scopolin before enzymatic hydrolysis.
c
Content of scopoletin after enzymatic hydrolysis.
d
Measure of total phenotypic variance attributable to genetic differences among genotypes (broad sense heritability) calculated as VG /(VG + VE).
Siwinska et al. BMC Plant Biology 2014, 14:280
/>
Page 8 of 14
Table 2 The quantified levels of scopoletina in Arabidopsis thaliana roots
Roots (μg/gFW)
Scopoletin (H-)b
c
Scopoletin (H+)
Roots (nmol/gFW)
Col-0 valuea
Est-1 valuea
Col-0 valuea
Est-1 valuea
3.4 ± 1.8
10.4 ± 2.4
17.7 ± 9.4
54.1 ± 6.2
15.8 ± 6.4
86.2 ± 9.8
82.2 ± 33.3
448.6 ± 51.0
a
Scopoletin was quantified with HPLC. Values show the averages of scopoletin contents with standard deviation (SD) from two measurements.
b
Content of scopoletin before enzymatic hydrolysis.
c
Content of scopoletin after enzymatic hydrolysis.
could be possibly linked to scopolin accumulation was detected within the QTL on chromosome 5 (SCL1 in Table 4).
It is At5g53990 encoding a UDP-glycosyltransferase, which
is relatively highly expressed in Arabidopsis roots [44].
According to the 1001 Genomes Project and our resequencing data of Est-1, this gene contains several SNPs
in the coding sequences of tested accessions including the
parental lines (see Additional file 3). Interestingly, the
CYP81D11 and UDP-glycosyltransferase sequences originating from Est, Est-1 (both taken from the 1001 Genomes
Project database) and Est-1* that was re-sequenced in our
laboratory are not identical (see Additional files 2 and 3).
This needs to be further verified.
Discussion
Here, we report a QTL mapping study of variation in
scopoletin and scopolin accumulation between two
Arabidopsis accessions and thereby we demonstrate the
Figure 6 Scatterplot for scopolin (H-) versus scopoletin (H+)
content in the AI-RILs population. Correlation between scopolin
level determined in the methanol root extracts before enzymatic
hydrolysis and scopoletin accumulation in extracts subjected to
hydrolysis. The regression equation for the AI-RILs population is
y = 1.122x +7.7039 with an R2 = 0.6634. (□) and (Δ) correspond to
Col-0 and Est-1 mean values, respectively.
usefulness of Arabidopsis natural variation in elucidating
the genetic and molecular basis of coumarins biosynthesis.
A large number of Arabidopsis recombinant inbred
line (RIL) populations are available and extensively used
for identification of numerous QTLs controlling various
traits such as growth, development or resistance to different biotic and abiotic stresses as well as the content
of chemical compounds [5,7,9,45,46]. In most studies,
the average number of QTLs identified is between one
and 10 and at least one major QTL is detected [47].
Here, one QTL for scopolin and five QTLs for scopoletin accumulation were detected, which is in agreement
with the average result in the field. Using an AI-RILs
mapping population has the advantage in comparison to
RILs due to the fact that the opportunity for recombination is increased before genotypes are fixed upon selfing [48]. As a result, using AI-RILs mapping population
that captures an increased number of recombination
events [48], enabled us to detect QTLs with effect size
as low as 7.0% PVE.
Once QTL has been identified, the next challenge is to
identify the gene(s) underlying detected QTL. In most
cases, a large number of genes that are present in the
QTL interval cannot be directly tested for candidacy. In
order to reduce the mapped region, a fine-mapping is
performed in which many individuals are genotyped for
markers around the QTL. More accurate QTL localization
might lead to the selection of candidate genes. Nonetheless, performing a fine mapping may be practically difficult
if the QTL effect is relatively small [49]. When multiple
data sets are available, which is the case for Arabidopsis, it
is possible to improve accuracy and to test the candidacy
of genes within mapped QTL intervals [49] based on the
available information. Therefore, it seems like a realistic
possibility to identify candidate genes underlying a QTL
by using the high throughput expression data and the
complete genome sequences of numerous Arabidopsis
accessions that were used to construct mapping populations. There are successful examples of using expression
arrays in identifying genes causally associated with quantitative traits of interest, both in plants and animals [50,51].
In this study, possible candidate genes were found within
mapped QTL intervals for scopolin and scopoletin content, including known and novel loci. Further functional
analysis, including re-sequencing, characterization of loss-
Siwinska et al. BMC Plant Biology 2014, 14:280
/>
Page 9 of 14
Table 3 Characteristics of the detected QTLs underlying scopolin and scopoletin biosynthesis in AI-RILs population
Trait
QTL
Chra
LOD score
Peakb (cM)
Confidence intervalc (cM)
Confidence interval (bp)
PVEd (%)
Scopolin
SCL1
5
4.53
174.2
173.6 - 185.9
19.414.594 - 22.027.830
13.86
Scopoletin
SCT1
1
3.327
71.1
32.6 - 178.6
4.826.763 - 20.083.545
7.008
SCT2
1
3.594
189.3
176.5 - 263.2
19.672.910 - 28.537.561
7.602
SCT3
3
4.223
19.2
6.7 - 25.8
786.303 - 4.140.699
9.027
SCT4
3
7.427
96.7
93.8 - 99.0
9.942.057 - 10.995.480
16.735
SCT5
5
5.249
53.3
51.7 - 53.9
4.235.132 - 5.725.918
11.409
a
Chromosome number.
b
Position of peak.
c
1-LOD support interval.
d
Percentage of phenotypic variance explained by the QTL (PVE).
of-function alleles and conducting gene complementation
either by crossing or genetic transformation, are required
to prove the role of selected possible candidate genes in
coumarins biosynthesis and their regulation.
Expanding molecular understanding of coumarins biosynthesis at an ecological level will be beneficial for the
future discovery of the physiological mechanisms of action
of genes involved in coumarins biosynthesis. It was suggested recently that some members the 2′-OG dioxygenase family, including the F6′H1 that is a key enzyme in
scopoletin biosynthesis, may be involved in Fe deficiency
responses and metabolic adjustments linked to Fe homeostasis in plant cells [52]. Other latest studies showed that
Fe deficiency induces the secretion of scopoletin and its
derivatives by Arabidopsis roots [53], and that F6′H1 is
required for the biosynthesis of coumarins that are
released into the rhizosphere as part of the strategy I-type
Fe acquisition machinery [54]. Previously, the existence of
natural variation in root exudation profiles was clearly detected among eight Arabidopsis accessions [55]. The
above mentioned findings make a study of coumarins biosynthesis in Arabidopsis using naturally occurring intraspecific variation even more promising and up-to-date.
Conclusions
In summary, we have presented here for the first time a
presence of naturally occurring intraspecies variation in
scopoletin and its glucoside, scopolin, accumulation
among seven Arabidopsis accessions. Even though,
these accessions do not completely represent a wide
genetic variation existing in Arabidopsis, it is assumed
that these accessions should reflect genetic adaptation
to local environmental factors [6]. A QTL mapping
study of scopoletin and scopolin variation within EstC
mapping population was conducted leading to the identification of new loci. The results presented here suggest
that natural variation in coumarins content in Arabidopsis
has a complex molecular basis. Importantly, they also provide a basis for fine mapping and cloning of the genes
involved in coumarins biosynthesis.
Methods
Plant material
Figure 7 LOD profile for QTL underlying scopolin accumulation
in the AI-RILs. One-dimensional LOD profile for the QTL underlying
variation in scopolin accumulation (SCL1). Red line represents LOD
threshold (3.4).
Seven Arabidopsis thaliana accessions Antwerpen (An-1,
Belgium), Columbia (Col-0, Germany), Estland (Est-1,
Estonia), Kashmir (Kas-2, India), Kondara (Kond, Tadjikistan),
Landsberg erecta (Ler, Poland) and Tsu (Tsu-1, Japan),
which are the parents of existing RIL populations and
represent accessions from different locations, were used
in the initial screening for variation in scopoletin and scopolin accumulation. An advanced recombinant inbred lines
(AI-RILs) mapping population (EstC) derived from the
cross between Columbia (Col-0) and Estland (Est-1) was
used in the QTL mapping experiment [48]. All seeds of the
Arabidopsis accessions and mapping population were
kindly provided by Maarten Koornneef from the Max
Planck Institute for Plant Breeding Research in Cologne,
Germany. Arabidopsis accessions are available at the
stock centre NASC (o/). The EstC
mapping population together with the marker data are
available at the NASC under the stock number CS39389.
Siwinska et al. BMC Plant Biology 2014, 14:280
/>
Page 10 of 14
Figure 8 LOD profiles for QTLs underlying scopoletin accumulation in the AI-RILs. QTLs for scopoletin (SCT1 - SCT5) content. Black line
represents LOD threshold (3.4). Profile LOD curves for a five-QTL model was done with formula = y ~ Q1 + Q2 + Q3 + Q4 + Q5. Each QTL is
highlighted in different colour.
Growth conditions
The seeds were surface sterilized by soaking in 70% ethanol
for two min and subsequently kept in 5% calcium hypochlorite solution for eight min. Afterwards seeds were
rinsed three times in autoclaved millipore water and
planted on 0.5 Murashige and Skoog’s (MS) medium containing 1% sucrose, 0.8% agar supplemented with 100 mg/l
myo-inositol, 1 mg/l thiamine hydrochloride, 0.5 mg/l pyridoxine hydrochloride and 0.5 mg/l nicotinic acid. For stratification, plates were kept in the dark at 4°C for 72 h and
then placed under defined growth conditions. All plants
were grown in vitro in plant growth chambers under a
photoperiod of 16 h light (35 μmol m−2 s−1) at 20°C and
8 h dark at 18°C. After 10 days seedlings were transferred
from agar plates into 200 ml glass culture vessels (5.5 cm
diameter × 10 cm high, glass jars with magenta B caps) containing 8 ml sterile liquid medium. Plants grown in liquid
cultures were incubated on rotary platform shakers at
120 rpm. After 17 days plants were harvested (28th day of
culture), leaves and roots were frozen separately in liquid
nitrogen and stored at −80°C. All genotypes were grown in
three biological replicates (in independent flasks). The
growth conditions were monitored by a HOBO U12 data
logger (Onset Computer Corporation, Bourne, MA) that
recorded the parameters (temperature, light intensity and
relative humidity) in an interval at every five minutes.
Preparation of methanol extracts from Arabidopsis roots
The root tissue was homogenized using steel beads and
sonication. The coumarins were extracted at 4°C with
80% methanol. After 24 h two sets of methanol extracts
were centrifuged for 20 min at 13000 rpm, one set was
additionally subjected to enzymatic hydrolysis using β-
glucosidase from almonds (Sigma-Aldrich) dissolved in
acetate buffer according to modified protocol of [56].
Scopoletin and scopolin quantification by HighPerformance Liquid Chromatography (HPLC)
The methanol extracts of Arabidopsis roots with and without enzymatic treatment were analyzed (Figure 2) using a
Perkin Elmer series 200 HPLC system comprising of a quaternary LC pump, autosampler, column oven and a UV
detector. All samples were filtered with 0.22 μm filters
before loading. The volume injected was 10 μl. Gradient
elution on Perkin Elmer C18 column SC18 (250×4.6 mm)
was performed at flow rate of 0.7 ml/min with the following
solvent system: (A) 50 mM ammonium acetate pH 4.5, (B)
Methanol: starting from 30% B for 2 min, 30–80% B in
40 min followed by isocratic elution and column regeneration. The fluorescence detector was based on absorbance
at 340 nm excitation wavelength and emission at 460 nm.
The data analysis consisted of scopoletin and scopolin relative analysis (area percent of total chromatogram).
Scopoletin identification by Gas Chromatography/Mass
Spectrometry (GC/MS)
The HPLC fractions containing scopoletin peak were
collected and scopoletin identification was confirmed
(Figure 3A) with Gas Chromatography/Mass Spectrometry
(GC/MS) by comparison to spectrum library (Figure 3B).
GC/MS analysis was performed using a Perkin-Elmer GC
XL Gas Chromatograph interfaced to a Mass Spectrometer
equipped with an Elite-5MS (5% diphenyl/ 95% dimethyl
polysiloxane) fused to a capillary column (30 × 0.25 μm
ID × 0.25 μm df ). For GC/MS detection, an electron
ionization system operated in electron impact mode
Siwinska et al. BMC Plant Biology 2014, 14:280
/>
Page 11 of 14
Table 4 Potential candidate genesa located within the SCL1, SCT4 and SCT5 intervals
No. Locus: Description (TAIR)
Gene expression level (Arabidopsis eFP
Browser)
Relative level (Fold-change)
Candidate genes selected from the QTL interval (SCT4) on chromosome 3: 9942057 to 10995480 nt.
Absolute level
1.
AT3G27230: S-adenosyl-L-methionine-dependent methyltransferases superfamily protein 1.18
210.15
2.
AT3G27325: Hydrolases, acting on ester bond
1.20
40.38
3.
AT3G27340: Molecular_function unknown; involved in oxidation reduction
1.62
83.80*
4.
AT3G27890: Encodes NAD(P)H:quinone reductase
1.59
367.30
5.
AT3G28200: Peroxidase superfamily protein
2.42
242.03
6.
AT3G28480: Oxoglutarate/iron-dependent oxygenase
0.82
130.66
7.
AT3G28740: Encodes a member of the cytochrome p450 family (CYP81D11)
3.35
35.84
Candidate genes selected from the QTL interval (SCT5) on chromosome 5: 4235132 to 5725918 nt.
8.
AT5G13780: Acyl-CoA N-acyltransferases (NAT) superfamily protein
1.96
395.68
9.
AT5G14130: Peroxidase superfamily protein
4.02
16.68
10.
AT5G14240: Thioredoxin superfamily protein
2.49
397.36*
11.
AT5G14340: Member of the R2R3 factor gene famil (MYB40)
5.16
28.41*
12.
AT5G14390: Alpha/beta-Hydrolases superfamily protein
1.36
69.43
13.
AT5G14430: S-adenosyl-L-methionine-dependent methyltransferases superfamily protein 1.26
261.78
14.
AT5G14750: Encodes a MyB-related protein containing R2 and R3 repeats (MYB66)
64.45
99.90*
15.
AT5G15130: Encodes a member of WRKY Transcription Factor (WRKY72)
18.65
85.83*
16.
AT5G15180: Peroxidase superfamily protein
36.11
287.14#
Candidate genes selected from the QTL interval (SCL1) on chromosome 5: 19414594 to 22027829 nt.
17.
AT5G47950: HXXXD-type acyl-transferase family protein
11.16
68*
18.
AT5G47980: HXXXD-type acyl-transferase family protein
28.79
66*
19.
AT5G47990: Encodes a member of the CYP705A family of cytochrome P450 enzymes
40.50
168*
20.
AT5G48000: Encodes a member of the CYP708A family of cytochrome P450 enzymes
221.82
189*
21.
AT5G48020: 2-oxoglutarate (2OG) and Fe(II)-dependent oxygenase superfamily protein
1.22
177
22.
AT5G48560: Basic helix-loop-helix (bHLH) DNA-binding superfamily protein
11.99
124
23.
AT5G48930: Encode shikimate O-hydroxycinnamoyltransferase (HCT)b
1.70
757
24.
AT5G49520: Encodes WRKY48, a member of the WRKY Transcription Factor
3.86
175*
25.
AT5G49560: Putative methyltransferase family protein
2.95
71
26.
AT5G49810: Methionine S-methyltransferase (MMT)
1.27
349
27.
AT5G49950: Alpha/beta-Hydrolases superfamily protein
1.16
119
28.
AT5G50890: Alpha/beta-Hydrolases superfamily protein
1.27
29.
AT5G51130: S-adenosyl-L-methionine-dependent methyltransferases superfamily protein 1.41
46.65
30.
AT5G51880: 2-oxoglutarate (2OG) and Fe(II)-dependent oxygenase superfamily protein
0.99
291.46
31.
AT5G52260: Encodes a member of the R2R3 factor gene family (MYB19)
4.83
30.21*
32.
AT5G52400: Encodes a member of CYP715A
1.03
12.91
33.
AT5G53560: Encodes a cytochrome b5 isoform that can be reduced by AtCBR
1.54
1845.23
34.
AT5G53990: UDP-Glycosyltransferase superfamily protein
19.54
10.75#
35.
AT5G54080: Homogentisate 1,2-dioxygenase (HGO)
1.53
254.15
36.
AT5G54160: OMT1:A caffeic acid/5-hydroxyferulic acid O-methyltransferase (OMT1)b
1.01
758.6
37.
AT5G54230: Encodes a putative transcription factor (MYB49)
7.01
34.73*
a
36
The list of potential candidate genes was compiled by searching TAIR ( and Arabisopsis eFP Browser ( />b
Loci known to be involved in coumarins biosynthesis.
*
Genes with the highest expression in roots of vegetative rosette.
#
Genes with relatively high expression in roots of vegetative rosette.
The selected intervals are associated with scopolin (SCL1) and scopoletin (SCT4, SCT5) accumulation and are characterized by the highest percentage of
phenotypic variance explained by each QTL and the highest LOD score values. Most of selected genes (except two highlighted with letter b) are novel loci.
Siwinska et al. BMC Plant Biology 2014, 14:280
/>
with an ionization energy of 70 eV. Helium gas was used
as a carrier gas at a constant flow rate of 1 ml/min, and
an injection volume of 2 μl was employed (a split ratio
of 10:1). The ion-source temperature was 250°C, the
oven temperature was programmed from 100°C (isothermal
for 5 min), with an increase of 10°C/min to 300°C. Mass
spectra were taken at 70 eV; a scan interval of 0.5 s and
fragments from 30 to 450 Da. The solvent delay was 1 to
2 min, and the total GC/MS running time was 38 min. The
mass-detector used in this analysis was Turbo-Mass GoldPerkin-Elmer, and the MS software Turbo-Mass ver-5.1.
Page 12 of 14
were checked according to TAIR
( To reveal other candidate
genes possibly underlying detected QTLs, a list of candidates was constructed using the following criteria: (1)
genes encoding enzymes belonging to families involved in
coumarins biosynthesis and genes encoding transcription
factors that might be induced by environmental stresses
( (2) genes that are expressed
in roots ( The list of potential
candidates was compiled by searching TAIR (http://www.
arabidopsis.org/) and Arabisopsis eFP Browser (http://bar.
utoronto.ca/) (Table 4).
Quantitative traits
Coumarins were quantified in the methanol root extracts
of three biological replicates (cultivated in independent
flasks) of all AI-RILs individuals. Methanol extracts subjected to enzymatic hydrolysis were used for scopoletin
quantification, while scopolin contents were determined
in methanol extracts without hydrolysis.
Quantitative genetic analyses
The scopolin and scopoletin mean values for each AIRILs were used in QTL mapping and trait correlation
analysis. The regression equation and R2 were calculated
by plotting scopolin and scopoletin mean values against
one another in Scatterplot (Microsoft Excel). The broad
sense heritability (H2) was estimated according to the
formula H2 = VG/(VG + VE), where VG is the amonggenotype variance component and VE is the residual
(error) variance.
QTL analyses in the AI-RIL population
Statistical analysis of phenotypic data was performed by
Shapiro-Wilk normality test. Phenotypic data is normally
distributed at the significance level α = 0.05. QTL mapping
was performed using R software (A Core Team, 2012,
www.R-project.org) with R/qtl package [57,58]; http://www.
rqtl.org/). QTL mapping was performed with Simple
Interval Mapping (SIM) (data not shown) followed by the
Multiple QTL mapping (MQM) procedure. The QTLs
with the highest logarithm of odds (LOD) scores detected
by SIM were subsequently used to make the QTL model
by the MQM. The final QTL model was done with the
backward elimination of cofactors with the window size
10 cM and maximum number of cofactors 5. Significance
threshold (LOD) values (P <0.05) for the QTL presence
was estimated from 10 000 permutations and is 3.4.
“Addint” function has been used to add pairwise interaction, one at a time, to a multiple-QTL model. No interaction has been detected.
Candidate genes selection
The physical positions of genes annotated to be involved in
coumarin biosynthetic process (Plant Metabolic Network,
Statistical analysis
All treatments included at least three (or two in case of
parental lines used in the genetic mapping) biological
replicates. Data processing and statistical analyses (one
way ANOVA, post-hoc test: least significant difference
test [LSD]) were carried out using Microsoft Excel. Error
bars representing standard deviation (SD) are shown in
the figures; the data presented are means.
DNA samples preparation and sequencing
The RNeasy® Plant Mini Kit (Qiagen) was used following the instructions of the manufacturer and including
on-column DNA digestion step with the RNase-Free
DNase Set (Qiagen) to eliminate genomic DNA contamination. 0.5 μg of RNA was used for reverse transcription
by Maxima First Strand cDNA Synthesis Kit (Thermo
Scientific). The amplification of genes coding sequences
was carried out in a 20 μl reaction mixture containing
cDNA synthetized from RNA isolated from roots, 0.4 U
of Platinum® Taq DNA Polymerase (Invitrogen), 200 μM
dNTP, 1 μM primers, and 1 × PCR Buffer and 1.5 mM Mg2+.
The reaction mixture was denatured at 94°C for 2 min,
and then the PCR amplification was performed using
34 cycles of 94°C for 30 sec, 52°C for 30 sec, and 72°C
for 90 sec in the Thermal Cycler C1000 Touch (Bio-Rad).
Gene-specific primers used for AT5G53990 UDPglycosyltransferase amplification were 5′- ATGGGCCAA
AATTTTCACGCT -3′ and 5′- TCATTCAAGATTTGTA
TCGTTGACT-3′ and for AT3G28740 CYP81D11 5′ATGTCATCAACAAAGACAATAATGG-3′ and 5′- TTA
TGGACAAGAAGCATCTAAAACC-3′. PCR products
were cloned into pCR8 vector (Invitrogen). For plasmid
amplification and maintenance, the Escherichia coli strain
One Shot® (Invitrogen) was used. Positive clones were
sequenced using vector specific primers M13fwd and
M13rev and BigDye® Terminator v3.1 (Life Technologies).
Sequencing reaction products were separated and analyzed
by 3730xl DNA Analyzer. All sequences were aligned using
CLUSTALW [59].
Siwinska et al. BMC Plant Biology 2014, 14:280
/>
Availability of supporting data
The data sets supporting the results of this article are
included within the article and its additional files.
Additional files
Additional file 1: Figure S1. The position of known loci involved in
scopolin and scopoletin biosynthesis.
Additional file 2: Figure S2. Multiple Sequence Alignment of coding
sequences of AtCYP81D11 gene produced by CLUSTALW.
Additional file 3: Figure S3. Multiple Sequence Alignment of coding
sequences of AtUDP-glycosyltransferase gene produced by CLUSTALW.
Abbreviations
2OGD: 2-oxoglutarate-dependent dioxygenase; 4CL1: 4-coumarate:CoA
ligase 1; 4CL2: 4-coumarate:CoA ligase 2; 4CL3: 4-coumarate:CoA ligase 3;
4CL5: 4-coumarate:CoA ligase 5; ACOS5: Acyl-CoA synthetase 5;
AI-RILs: Advanced intercross recombinant inbred lines; C3H: p-coumaroyl
3′-hydroxylase; CCoAOMT1: Caffeoyl coenzyme A dependent
O-methyltransferase 1; CCoAOMT7: Caffeoyl coenzyme A dependent
O-methyltransferase 7; CYP: Cytochrome P450 superfamily of
monooxygenases; F6′H1: Feruloyl-CoA 6′-hydroxylase 1; F6′H2: FeruloylCoA 6′-hydroxylase 2; GC/MS: Gas Chromatography/Mass Spectrometry;
HCT: Shikimate O-hydroxycinnamoyltransferase; HPLC: High-performance
liquid chromatography; LOD: Logarithm of odds; MS: Murashige and Skoog
medium; MQM: Multiple QTL mapping; MYB: Superfamily of transcription
factors; NASC: Nottingham Arabidopsis stock centre; OMT1: Caffeate
O-methyltransferase 1; TSM1: Tapetum-specific O- methyltransferase;
PVE: Phenotypic variance explained; SIM: Simple interval mapping;
QTL: Quantitative trait loci; WRKY: Superfamily of transcription factors.
Competing interests
The authors declare that they have no competing interests.
Authors’ contributions
JS cultivated the plant material, conducted secondary metabolites isolation,
performed the QTL mapping and contributed to the in silico analyses,
statistical analyses and the results interpretation. LK, RB and BB conducted
the coumarins quantification by HPLC. BB and RB contributed to the
statistical analyses. AO was involved in the in silico analyses. AGW
contributed to the statistical analyses. EL contributed to the results
interpretation. AI received grant support for the project, wrote the paper,
design the experiments, interpreted the results, performed the in silico and
statistical analyses, and participate in optimization of plant growth and
secondary metabolites isolation. All authors read and approved the final
manuscript.
Acknowledgements
This research was supported by the National Science Centre (6815/B/P01/
2011/40), the Foundation for Polish Science (HOMING Programme) and the
LiSMIDoS PhD fellowship (UDA-POKL.04.01.01-00-017/1000). Open access
publication cost supported from the project MOBI4Health that has received
funding from the European Union’s Seventh Framework Programme for
research, technological development and demonstration under grant
agreement no 316094. We thank Maarten Koornneef from the Max Planck
Institute for Plant Breeding Research in Cologne for providing all Arabidopsis
seeds used in this study and for critical reading of the manuscript.
Author details
1
Intercollegiate Faculty of Biotechnology of University of Gdansk and Medical
University of Gdansk, ul. Kladki 24, Gdansk 80-822, Poland. 2Université de
Lorraine, UMR 1121 Laboratoire Agronomie et Environnement Nancy-Colmar,
2 avenue de la forêt de Haye, Vandœuvre-lès-Nancy 54505, France. 3INRA,
UMR 1121 Laboratoire Agronomie et Environnement Nancy-Colmar,
2 avenue de la forêt de Haye, Vandœuvre-lès-Nancy 54505, France.
Received: 13 May 2014 Accepted: 9 October 2014
Page 13 of 14
References
1. Fernie AR, Trethewey RN, Krotzky AJ, Willmitzer L: Metabolite profiling: from
diagnostics to systems biology. Nat Rev Mol Cell Biol 2004, 5(9):763–769.
2. Kliebenstein DJ, Osbourn A: Making new molecules - evolution of pathways
for novel metabolites in plants. Curr Opin Plant Biol 2012, 15(4):415–423.
3. D’Auria JC, Gershenzon J: The secondary metabolism of Arabidopsis
thaliana: growing like a weed. Curr Opin Plant Biol 2005, 8(3):308–316.
4. Brotman Y, Riewe D, Lisec J, Meyer RC, Willmitzer L, Altmann T: Identification
of enzymatic and regulatory genes of plant metabolism through QTL
analysis in Arabidopsis. J Plant Physiol 2011, 168(12):1387–1394.
5. Alonso-Blanco C, Aarts MG, Bentsink L, Keurentjes JJ, Reymond M,
Vreugdenhil D, Koornneef M: What has natural variation taught us about
plant development, physiology, and adaptation? Plant Cell 2009,
21(7):1877–1896.
6. Koornneef M, onso-Blanco C, Vreugdenhil D: Naturally occurring genetic
variation in Arabidopsis thaliana. Annu Rev Plant Biol 2004, 55:141–172.
7. Weigel D: Natural variation in Arabidopsis: from molecular genetics to
ecological genomics. Plant Physiol 2012, 158(1):2–22.
8. Keurentjes JJ, Fu J, de Vos CH, Lommen A, Hall RD, Bino RJ, van der Plas LH,
Jansen RC, Vreugdenhil D, Koornneef M: The genetics of plant
metabolism. Nat Genet 2006, 38(7):842–849.
9. Lisec J, Meyer RC, Steinfath M, Redestig H, Becher M, Witucka-Wall H, Fiehn O,
Torjek O, Selbig J, Altmann T, Willmitzer L: Identification of metabolic and
biomass QTL in Arabidopsis thaliana in a parallel analysis of RIL and IL
populations. Plant J 2008, 53(6):960–972.
10. Rowe HC, Hansen BG, Halkier BA, Kliebenstein DJ: Biochemical networks
and epistasis shape the Arabidopsis thaliana metabolome. Plant Cell 2008,
20(5):1199–1216.
11. Kliebenstein DJ, Gershenzon J, Mitchell-Olds T: Comparative quantitative trait
loci mapping of aliphatic, indolic and benzylic glucosinolate production in
Arabidopsis thaliana leaves and seeds. Genetics 2001, 159(1):359–370.
12. Tholl D, Chen F, Petri J, Gershenzon J, Pichersky E: Two sesquiterpene
synthases are responsible for the complex mixture of sesquiterpenes
emitted from Arabidopsis flowers. Plant J 2005, 42(5):757–771.
13. Bednarek P, Schneider B, Svatos A, Oldham NJ, Hahlbrock K: Structural
complexity, differential response to infection, and tissue specificity of
indolic and phenylpropanoid secondary metabolism in Arabidopsis
roots. Plant Physiol 2005, 138(2):1058–1070.
14. Kai K, Shimizu B, Mizutani M, Watanabe K, Sakata K: Accumulation of
coumarins in Arabidopsis thaliana. Phytochemistry 2006, 67(4):379–386.
15. Kai K, Mizutani M, Kawamura N, Yamamoto R, Tamai M, Yamaguchi H,
Sakata K, Shimizu B: Scopoletin is biosynthesized via ortho-hydroxylation
of feruloyl CoA by a 2-oxoglutarate-dependent dioxygenase in
Arabidopsis thaliana. Plant J 2008, 55(6):989–999.
16. Rohde A, Morreel K, Ralph J, Goeminne G, Hostyn V, De RR, Kushnir S, Van DJ,
Joseleau JP, Vuylsteke M, Van DG, Van BJ, Messens E, Boerjan W: Molecular
phenotyping of the pal1 and pal2 mutants of Arabidopsis thaliana reveals
far-reaching consequences on phenylpropanoid, amino acid, and
carbohydrate metabolism. Plant Cell 2004, 16(10):2749–2771.
17. Baillieul F, de Ruffray P, Kauffmann S: Molecular cloning and biological
activity of alpha-, beta-, and gamma-megaspermin, three elicitins secreted
by Phytophthora megasperma H20. Plant Physiol 2003, 131(1):155–166.
18. Stern RS: Psoralen and ultraviolet a light therapy for psoriasis. N Engl J Med
2007, 357(7):682–690.
19. Wulff H, Rauer H, During T, Hanselmann C, Ruff K, Wrisch A, Grissmer S, Hansel
W: Alkoxypsoralens, novel nonpeptide blockers of Shaker-type K + channels:
synthesis and photoreactivity. J Med Chem 1998, 41(23):4542–4549.
20. Karamat F, Olry A, Doerper S, Vialart G, Ullmann P, Werck-Reichhart D,
Bourgaud F, Hehn A: CYP98A22, a phenolic ester 3′-hydroxylase specialized in
the synthesis of chlorogenic acid, as a new tool for enhancing the
furanocoumarin concentration in Ruta graveolens. BMC Plant Biol 2012, 12:152.
21. Bertolucci SK, Pereira AB, Pinto JE, Oliveira AB, Braga FC: Seasonal variation
on the contents of coumarin and kaurane-type diterpenes in Mikania
laevigata and M. glomerata leaves under different shade levels.
Chem Biodivers 2013, 10(2):288–295.
22. Costet L, Fritig B, Kauffmann S: Scopoletin expression in elicitor-treated
and tobacco mosaic virus-infected tobacco plants. Physiol Plant 2002,
115(2):228–235.
23. Gnonlonfin BG, Gbaguidi F, Gbenou JD, Sanni A, Brimer L: Changes in
scopoletin concentration in cassava chips from four varieties during
storage. J Sci Food Agric 2011, 91(13):2344–2347.
Siwinska et al. BMC Plant Biology 2014, 14:280
/>
24. Matsumoto S, Mizutani M, Sakata K, Shimizu B: Molecular cloning and
functional analysis of the ortho-hydroxylases of p-coumaroyl coenzyme
A/feruloyl coenzyme A involved in formation of umbelliferone and
scopoletin in sweet potato, Ipomoea batatas (L.) Lam. Phytochemistry
2012, 74:49–57.
25. Prats E, Galindo JC, Bazzalo ME, Leon A, Macias FA, Rubiales D, Jorrin JV:
Antifungal activity of a new phenolic compound from capitulum of a head
rot-resistant sunflower genotype. J Chem Ecol 2007, 33(12):2245–2253.
26. Sargent JA, Skoog F: Effects of indoleacetic acid and kinetin on
scopoletin-scopolin levels in relation to growth of tobacco tissues
in vitro. Plant Physiol 1960, 35(6):934–941.
27. Schmeda-Hirschmann G, Jordan M, Gerth A, Wilken D, Hormazabal E,
Tapia AA: Secondary metabolite content in Fabiana imbricata plants and
in vitro cultures. Z Naturforsch C 2004, 59(1–2):48–54.
28. Taguchi G, Fujikawa S, Yazawa T, Kodaira R, Hayashida N, Shimosaka M,
Okazaki M: Scopoletin uptake from culture medium and accumulation in
the vacuoles after conversion to scopolin in 2,4-D-treated tobacco cells.
Plant Sci 2000, 151(2):153–161.
29. Tal B, Robeson DJ: The metabolism of sunflower phytoalexins ayapin and
scopoletin: plant-fungus interactions. Plant Physiol 1986, 82(1):167–172.
30. Gnonlonfin GJB, Sanni A, Brimer L: Review Scopoletin - a coumarin phytoalexin
with medicinal properties. Crit Rev Plant Sci 2012, 31:47–56.
31. Vogt T: Phenylpropanoid biosynthesis. Mol Plant 2010, 3(1):2–20.
32. Fraser CM, Chapple C: The phenylpropanoid pathway in Arabidopsis.
Arabidopsis Book 2011, 9:e0152.
33. Schoch G, Goepfert S, Morant M, Hehn A, Meyer D, Ullmann P,
Werck-Reichhart D: CYP98A3 from Arabidopsis thaliana is a 3′-hydroxylase of
phenolic esters, a missing link in the phenylpropanoid pathway. J Biol Chem
2001, 276(39):36566–36574.
34. Ehlting J, Buttner D, Wang Q, Douglas CJ, Somssich IE, Kombrink E:
Three 4-coumarate:coenzyme A ligases in Arabidopsis thaliana represent two
evolutionarily divergent classes in angiosperms. Plant J 1999, 19(1):9–20.
35. Hamberger B, Hahlbrock K: The 4-coumarate:CoA ligase gene family in
Arabidopsis thaliana comprises one rare, sinapate-activating and three
commonly occurring isoenzymes. Proc Natl Acad Sci U S A 2004,
101(7):2209–2214.
36. Hoffmann L, Maury S, Martz F, Geoffroy P, Legrand M: Purification, cloning,
and properties of an acyltransferase controlling shikimate and quinate
ester intermediates in phenylpropanoid metabolism. J Biol Chem 2003,
278(1):95–103.
37. Hoffmann L, Besseau S, Geoffroy P, Ritzenthaler C, Meyer D, Lapierre C, Pollet B,
Legrand M: Silencing of hydroxycinnamoyl-coenzyme A shikimate/quinate
hydroxycinnamoyltransferase affects phenylpropanoid biosynthesis.
Plant Cell 2004, 16(6):1446–1465.
38. Kuhnl T, Koch U, Heller W, Wellmann E: Chlorogenic acid biosynthesis:
characterization of a light-induced microsomal 5-O-(4-coumaroyl)-D-quinate/
shikimate 3′-hydroxylase from carrot (Daucus carota L.) cell suspension
cultures. Arch Biochem Biophys 1987, 258(1):226–232.
39. Goujon T, Sibout R, Pollet B, Maba B, Nussaume L, Bechtold N, Lu F, Ralph J,
Mila I, Barriere Y, Lapierre C, Jouanin L: A new Arabidopsis thaliana mutant
deficient in the expression of O-methyltransferase impacts lignins and
sinapoyl esters. Plant Mol Biol 2003, 51(6):973–989.
40. Wils CR, Brandt W, Manke K, Vogt T: A single amino acid determines position
specificity of an Arabidopsis thaliana CCoAOMT-like O-methyltransferase.
FEBS Lett 2013, 587(6):683–689.
41. Grienenberger E, Besseau S, Geoffroy P, Debayle D, Heintz D, Lapierre C,
Pollet B, Heitz T, Legrand M: A BAHD acyltransferase is expressed in the
tapetum of Arabidopsis anthers and is involved in the synthesis of
hydroxycinnamoyl spermidines. Plant J 2009, 58(2):246–259.
42. Hino F, Okazaki M, Miura Y: Effect of 2,4-dichlorophenoxyacetic Acid on
glucosylation of scopoletin to scopolin in tobacco tissue culture.
Plant Physiol 1982, 69(4):810–813.
43. Bourgaud F, Hehn A, Larbat R, Doerper S, Gontier E, Kellner S, Matern U:
Biosynthesis of coumarins in plants: a major pathway still to be unravelled
for cytochrome P450 enzymes. Phytochem Rev 2006, 5:293–308.
44. Winter D, Vinegar B, Nahal H, Ammar R, Wilson GV, Provart NJ: An “Electronic
Fluorescent Pictograph” browser for exploring and analyzing large-scale
biological data sets. PLoS One 2007, 2:e718.
45. Fernie AR, Klee HJ: The use of natural genetic diversity in the understanding
of metabolic organization and regulation. Front Plant Sci 2011, 2:59.
Page 14 of 14
46. Lisec J, Steinfath M, Meyer RC, Selbig J, Melchinger AE, Willmitzer L,
Altmann T: Identification of heterotic metabolite QTL in Arabidopsis
thaliana RIL and IL populations. Plant J 2009, 59(5):777–788.
47. Grillo MA, Li C, Hammond M, Wang L, Schemske DW: Genetic architecture
of flowering time differentiation between locally adapted populations of
Arabidopsis thaliana. New Phytol 2013, 197(4):1321–1331.
48. Balasubramanian S, Schwartz C, Singh A, Warthmann N, Kim MC, Maloof JN,
Loudet O, Trainer GT, Dabi T, Borevitz JO, Chory J, Weigel D: QTL mapping
in new Arabidopsis thaliana advanced intercross-recombinant inbred
lines. PLoS One 2009, 4(2):e4318.
49. Price AH: Believe it or not, QTLs are accurate! Trends Plant Sci 2006,
11(5):213–216.
50. Wayne ML, McIntyre LM: Combining mapping and arraying: An approach
to candidate gene identification. Proc Natl Acad Sci U S A 2002,
99(23):14903–14906.
51. Werner JD, Borevitz JO, Warthmann N, Trainer GT, Ecker JR, Chory J, Weigel D:
Quantitative trait locus mapping and DNA array hybridization identify an
FLM deletion as a cause for natural flowering-time variation. Proc Natl Acad
Sci U S A 2005, 102(7):2460–2465.
52. Vigani G, Morandini P, Murgia I: Searching iron sensors in plants by
exploring the link among 2′-OG-dependent dioxygenases, the iron
deficiency response and metabolic adjustments occurring under iron
deficiency. Front Plant Sci 2013, 4:169.
53. Fourcroy P, Siso-Terraza P, Sudre D, Saviron M, Reyt G, Gaymard F, Abadia A,
Abadia J, varez-Fernandez A, Briat JF: Involvement of the ABCG37 transporter
in secretion of scopoletin and derivatives by Arabidopsis roots in response
to iron deficiency. New Phytol 2014, 201(1):155–167.
54. Schmid NB, Giehl RF, Doll S, Mock HP, Strehmel N, Scheel D, Kong X, Hider RC,
von Wiren N: Feruloyl-CoA 6′-hydroxylase1-dependent coumarins mediate
iron acquisition from alkaline substrates in Arabidopsis. Plant Physiol 2014,
164(1):160–172.
55. Micallef SA, Shiaris MP, Colon-Carmona A: Influence of Arabidopsis thaliana
accessions on rhizobacterial communities and natural variation in root
exudates. J Exp Bot 2009, 60(6):1729–1742.
56. Nguyen C, Bouque V, Bourgaud F, Guckert A: Quantification of Daidzein
and Furanocoumarin Conjugates of Psoralea cinerea L. (Leguminosae).
Phytochem Anal 1997, 8:27–31.
57. Arends D, Prins P, Jansen RC, Broman KW: R/qtl: high-throughput multiple
QTL mapping. Bioinformatics 2010, 26(23):2990–2992.
58. Broman KW, Wu H, Sen S, Churchill GA: R/qtl: QTL mapping in
experimental crosses. Bioinformatics 2003, 19(7):889–890.
59. Thompson JD, Higgins DG, Gibson TJ: CLUSTAL W: improving the
sensitivity of progressive multiple sequence alignment through
sequence weighting, position-specific gap penalties and weight matrix
choice. Nucleic Acids Res 1994, 22:4673–4680.
doi:10.1186/s12870-014-0280-9
Cite this article as: Siwinska et al.: Identification of QTLs affecting
scopolin and scopoletin biosynthesis in Arabidopsis thaliana. BMC Plant
Biology 2014 14:280.
Submit your next manuscript to BioMed Central
and take full advantage of:
• Convenient online submission
• Thorough peer review
• No space constraints or color figure charges
• Immediate publication on acceptance
• Inclusion in PubMed, CAS, Scopus and Google Scholar
• Research which is freely available for redistribution
Submit your manuscript at
www.biomedcentral.com/submit