Flavonoid supplementation affects the expression of genes involved in cell wall formation and lignification metabolism and increases sugar content and saccharification in the fast-growing
Bạn đang xem bản rút gọn của tài liệu. Xem và tải ngay bản đầy đủ của tài liệu tại đây (1.48 MB, 17 trang )
Lepikson-Neto et al. BMC Plant Biology 2014, 14:301
/>
RESEARCH ARTICLE
Open Access
Flavonoid supplementation affects the expression
of genes involved in cell wall formation and
lignification metabolism and increases sugar
content and saccharification in the fast-growing
eucalyptus hybrid E. urophylla x E. grandis
Jorge Lepikson-Neto1, Leandro C Nascimento1, Marcela M Salazar1, Eduardo LO Camargo1, João PF Cairo2,
Paulo J Teixeira1, Wesley L Marques1, Fabio M Squina2, Piotr Mieczkowski3, Ana C Deckmann1
and Gonçalo AG Pereira1*
Abstract
Background: Eucalyptus species are the most widely planted hardwood species in the world and are renowned for
their rapid growth and adaptability. In Brazil, one of the most widely grown Eucalyptus cultivars is the fast-growing
Eucalyptus urophylla x Eucalyptus grandis hybrid. In a previous study, we described a chemical characterization of
these hybrids when subjected to flavonoid supplementation on 2 distinct timetables, and our results revealed
marked differences between the wood composition of the treated and untreated trees.
Results: In this work, we report the transcriptional responses occurring in these trees that may be related to the
observed chemical differences. Gene expression was analysed through mRNA-sequencing, and notably, compared
to control trees, the treated trees display differential down-regulation of cell wall formation pathways such as
phenylpropanoid metabolism as well as differential expression of genes involved in sucrose, starch and minor CHO
metabolism and genes that play a role in several stress and environmental responses. We also performed enzymatic
hydrolysis of wood samples from the different treatments, and the results indicated higher sugar contents and
glucose yields in the flavonoid-treated plants.
Conclusions: Our results further illustrate the potential use of flavonoids as a nutritional complement for modifying
Eucalyptus wood, since, supplementation with flavonoids alters its chemical composition, gene expression and
increases saccharification probably as part of a stress response.
Keywords: Eucalyptus, Lignin, Phenylpropanoid metabolism, Syringyl/guaiacyl ratio, Gene expression, Hydrolysis, Stress
Background
Trees constitute the majority of the lignocellulosic biomass on Earth and are expected to play a significant role
in the future as a renewable and environmentally costeffective alternative feedstock for biofuel production, a
source of fibers and solid wood products and a major
* Correspondence:
1
Departamento de Genética e Evolução, Laboratório de Genômica e
Expressão, Instituto de Biologia, Universidade Estadual de Campinas,
Campinas, São Paulo, Brazil
Full list of author information is available at the end of the article
sink for excess atmospheric CO2 [1-3]. In Brazil, the
pulp and paper industries have been efficiently fed by
Eucalyptus forests due to their rapid growth, adaptability
and wood quality, but with the dramatic increase in industrial demands and the interest in second-generation
biofuels and renewable chemicals, the quality and quantity of wood produced must also increase [4,5].
Wood is a highly variable material that differs among
trees and is composed of the secondary xylem, a specialized type of conductive and structural support tissue
produced through the lateral growth and differentiation
© 2014 Lepikson-Neto et al.; licensee BioMed Central Ltd. This is an Open Access article distributed under the terms of the
Creative Commons Attribution License ( which permits unrestricted use,
distribution, and reproduction in any medium, provided the original work is properly credited. The Creative Commons Public
Domain Dedication waiver ( applies to the data made available in this
article, unless otherwise stated.
Lepikson-Neto et al. BMC Plant Biology 2014, 14:301
/>
of the meristematic vascular cambium [6]. Most of the
genes expressed during the formation of the secondary
xylem (xylogenesis) are involved in determining the physical and chemical properties of wood [2,7]. Despite the
progress that has been made in defining the molecular
and cellular events involved in xylogenesis, the mechanisms regulating the rate of this process and the variation
in wood properties remain largely unknown [8-10].
The secondary xylem cell wall of Eucalyptus trees
is mostly composed by cellulose (β-1,4-glucan), lignin
(a phenolic polymer) and hemicelluloses (heterogeneous
polysaccharides), in an approximate ratio of 2:1:1 [11].
During tree growth, cellulose microfibrils give the cell
walls tensile strength, and the lignin encasing the cellulose
microfibrils imparts rigidity to the cell walls. Despite its
importance during growth, lignin becomes problematic
during postharvest, cellulose-based wood processing because it must be extracted during industrial handling
through a complicated process, resulting in an enormous
expenditure of energy and chemicals and strain on the
environment [11,12]. Thus, it is of major interest to investigate the molecular basis of lignification to further increase our overall comprehension of this metabolic
process for better adaptation of industrial processes.
Lignin synthesis is a relatively well-understood process
that begins with the assembly of radicals produced during
the single-electron oxidation of monolignols [10,13,14].
The industrial exploitation of wood to obtain cellulose depends mostly on the composition of lignins because lignins determine the rigidity of the wood and the feasibility
of cellulose extraction, which are of major concern in the
paper and pulp industries. In angiosperms, lignin is composed of 2 major units: the guaiacyl (G) and syringyl (S)
units, which are derived from corresponding monolignol
precursors, the coniferyl and sinapyl alcohols, respectively
[1,15]. The S/G ratio dictates the degree and nature of
polymeric cross-linking; an increased G content leads to
highly cross-linked lignin (more rigid wood), whereas S
subunits are typically linked through more labile ether
bonds at the 4-hydroxyl position [16-18]. Thus, S-rich lignins are much easier to dissociate from cellulosic content,
resulting in a much cleaner and cheaper process [18]. The
S/G ratio is variable among species and is commonly used
to evaluate the quality of wood in commercial tree plantations [19,20].
The formation of lignin monomers begins with the catalytic step performed by the 4-coumaroyl:CoA-ligase (4CL)
enzyme, which likely represents the most important branch
point in the central phenylpropanoid biosynthesis pathway in plants [21,22]. Through 4CL activity, cells can
produce the precursors for either flavonoids or the G
and S lignin precursors [23]. The product of 4CL,
p-coumaroyl-CoA, is the substrate of the enzyme
chalcone synthase (CHS) [24], which carries out the
Page 2 of 17
committing step in flavonoid biosynthesis. This pathway
is reviewed in detail elsewhere [10,24].
The flavonoids naringenin-chalcone and naringenin,
which are synthesized by the enzymes chalcone synthase
(CHS) and chalcone isomerase (CHI), respectively, are the
primary C15 intermediates in flavonoid biosynthesis
[25,26]. This metabolic pathway appears to be a promising
target for improving wood quality in Eucalyptus trees, as
shown by our previous work [27] demonstrating that
flavonoid supplementation of the fast-growing Eucalyptus
urophylla x Eucalyptus grandis hybrid, hereafter referred
to as E. urograndis, changes its wood composition, reduces its extractive contents and alters its syringyl monomer composition.
In this context, the objective of the present work was to
perform further studies on the effects of flavonoid supplementation on E. urograndis trees by analyzing gene
expression in xylem tissue from treated and non-treated
trees and by measuring the effect on sugar accessibility
through enzymatic hydrolysis. We analyzed the obtained
data with special emphasis on results that might be correlated with the previously observed changes in wood
composition [27].
Results
RNA sequencing and differential gene expression
A total of over 335 million reads were generated from 8
samples: 3 samples from the control group (CT); 3 from
the naringenin-supplemented groups (2 NAR and 1 NARSTOP); and 2 from the naringenin-chalcone supplemented
groups (1 CH and 1 CHSTOP). The number of reads per
sample ranged from 32 to 54 million (total) and 30 to 48
million (after filtering). The reads were mapped against the
greater splice variants (44,974 sequences) of the E.
grandis gene predictions from Phytozome 7.0 (54,935
transcripts) using the SOAP2 alignment software package [28] (Additional file 1).
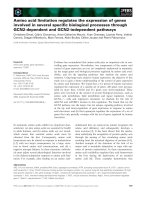
Heat map clustering of all transcripts was performed
using Expander software [29], resulting in 2 major groups:
1 formed by the 3 control sample replicates and the other
by the flavonoid-supplemented samples (Figure 1).
The read counts from each sample were used to test
the differential expression of the genes between the
control (CT) and supplemented (CH, NAR, CHSTOP
and NARSTOP) treatments using the baySeq package
[30]. A total of 1,573 genes were considered to be differentially expressed (FDR ≤0.01), which were distributed
among the treatments (917 CH; 1,289 NAR; 268 CHSTOP;
47 NARSTOP) (Additional file 2).
The gene expression patterns observed for the supplemented and control groups were distinct, while similar
profiles were observed within treatments, indicating similarities among the different types of flavonoid supplementation studied here. Most of the differences were observed
Lepikson-Neto et al. BMC Plant Biology 2014, 14:301
/>
Page 3 of 17
Figure 1 Heat map clustering and Venn diagram of differentially expressed genes. A) Heat map clustering of differentially expressed
transcripts and comparison of the estimated log2 fold change correlations between each group subjected to differential expression analyses.
B) Venn diagram of differentially expressed genes. CH- prolonged narigenin-chalcone supp; NAR – prolonged naringenin supp; CHSTOP- short-term
naringenin-chalcone supp; NARSTOP – short-termnaringenin sup.
in the long-term supplementation treatments, which
comprised almost all of the genes that were differentially
expressed in the short-term treatments as well. The
NAR-supplemented plants displayed the greatest number
of genes that were differentially expressed, while the
NARSTOP-supplemented plants had fewer, which may
indicate that naringenin supplementation has a stronger,
but short-lasting impact on gene expression, whereas
naringenin-chalcone has a smaller but more durable
impact.
Functional analyses
To determine the biological functions of the genes
responding to flavonoid supplementation, functional analyses were performed using the web-based tools Blast2GO
and Mapman. The genes considered differentially expressed in each treatment were mapped to their corresponding metabolic pathways, and the treatments were
tested for enrichment of particular metabolic responses.
Only 36 genes were differentially expressed in all four
treatments, including genes encoding several heat-shock
proteins, sequences with no hits and unknown proteins
(Table 1).
Each supplemented group was analysed individually.
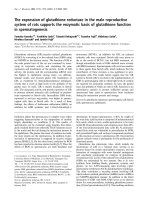
Common categories between different treatments are
shown in Figure 2, and all affected GO categories are
listed in Additional file 3.
Many of the down-regulated categories that were common to all treatments are involved in cell wall formation
and development. On the other hand, the common upregulated categories are all related to stress and environmental responses. Interestingly, NARSTOP, which resulted
in fewer differentially expressed genes, only led to enriched
GO categories among up-regulated genes.
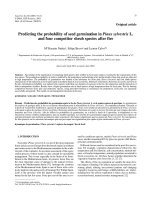
Mapman analyses of all of the differentially expressed
genes also indicated down-regulation of cell wall-related
genes and phenylpropanoid pathways, whereas flavonoid,
minor CHO and starch and sucrose metabolism and
stress response were associated with the most genes upregulated (Figure 3).
The phenylpropanoid genes
To further analyze the impact of flavonoid supplementation on lignification, a broader analysis was performed
on the genes from the phenylpropanoid pathway, especially those related to lignin biosynthesis.
Several phenylpropanoid genes were differentially expressed between the treated samples and controls (Table 2),
including the following genes that are directly related to
lignin synthesis: 4CL, HCT, 2 OMT-methyltransferases,
CCR and 2 CAD genes; 4CL, HCT and CCR were downregulated, while the 2 methyltransferases and CAD genes
were up-regulated. Additionally, several laccases were
down-regulated among the treatments. These results are
Lepikson-Neto et al. BMC Plant Biology 2014, 14:301
/>
Page 4 of 17
Table 1 Gene ID, FPKM values and annotation of the 36 genes that found to be differentially expressed in all tested
conditions
FPKM
Gene ID
Annotation
CT
CH
NAR
CHSTOP
NARSTOP
Eucgr.F04479.1
HSP20
0.12
35.55
40.44
23.84
57.92
Eucgr.K02389.1
Unknown
0.04
13.69
10.18
9.89
26.99
Eucgr.K02399.1
Unknown
0.08
18.09
18.67
19.48
53.82
Eucgr.G01188.2
EGY3
2.78
45.78
41.56
33.40
76.35
Eucgr.J01979.1
HSP18.2
0.34
17.61
19.94
14.63
27.21
Eucgr.K02410.1
Unknown
0.13
14.27
10.66
12.52
29.61
Eucgr.J01980.1
HSP18.2
0.02
12.20
11.59
9.15
26.39
Eucgr.L02233.1
no hit
1.29
41.47
38.15
29.24
118.40
Eucgr.F02898.1
HSP20
2.76
525.99
343.17
280.68
342.59
Eucgr.J01985.1
HSP18.2
0.31
22.25
16.62
13.21
33.33
Eucgr.K03553.1
STS
0.04
4.11
4.59
2.83
6.87
Eucgr.L03261.1
HSP18.2
1.44
47.41
27.81
19,98
75,67
Eucgr.C03449.1
HSFA2
0.29
14.55
12.98
14.36
18.58
Eucgr.C00684.1
HSP17.6II
2.00
341.30
299.30
243.65
272.90
Eucgr.K02384.1
unknown
0.07
14.56
10.59
10.60
27.23
Eucgr.J01969.1
HSP20
4.89
192.23
134.53
103.09
310.44
Eucgr.K03472.1
ARATH
0.07
109.57
84.15
62.04
20.94
Eucgr.H04513.1
HSP70
0.23
15.72
18.79
11.56
21.62
Eucgr.A00595.1
PEBP
0.10
81.17
76.66
57.33
98.83
Eucgr.E02421.1
Unknown
0.19
260.04
220.12
119.63
51.05
Eucgr.H04692.1
HSP21
2.97
83.31
59.57
43.11
313.22
Eucgr.G02440.1
UGT73B2
0.00
5.46
5.80
3.33
4.06
Eucgr.G02259.1
UGT73B3
0.00
2.73
2.14
1.18
3.10
Eucgr.J01959.1
HSP18.2
3.19
142.90
89.76
58.22
148.21
Eucgr.K00295.1
HSP90.1
2.11
46.13
38.25
35.52
62.69
Eucgr.A01833.1
AAC3
0.13
32.00
24.43
15.08
10.47
Eucgr.C03071.1
HSP17.6II
3.64
517.08
509.51
451.66
324.54
Eucgr.B03843.1
No hit
1.45
93.17
63.39
67.61
20.77
Eucgr.C03320.1
DUF1677
0.38
24.39
18.22
14.01
9.78
Eucgr.B00176.2
PIMT2
3.86
153.25
109.01
82.97
57.39
Eucgr.J02588.1
No hit
3.20
225.90
182.76
194.01
130.04
Eucgr.C00690.1
HSP17.6II
2.48
563.68
498.40
514.67
458.94
Eucgr.K00237.1
PEBP
0.04
115.83
64.41
61.47
11.49
Eucgr.F03196.1
GSTU25
1.43
292.73
240.63
168.71
38.29
Eucgr.I02136.1
HSP20
1.68
226.73
147.43
90.02
259.35
Eucgr.H04427.1
MEE32
49.92
0.52
0.85
1.32
13.93
A total of 36 genes were differentially expressed in all four conditions. FPKM -fragments per kilobase of exon per million fragments mapped. CT – control;
CH – prolonged naringenin-chalcone supp; NAR – prolonged naringenin supp; CHSTOP- short-term naringenin-chalcone supp; NARSTOP – short-term
naringenin supp.
Abbreviations: HSP20 HSP20-like chaperone superfamily protein, unknown unknown protein, EGY3 ethylene-dependent gravitropism-deficient and yellow-green-like
3, HSP18.2 heat shock protein 18.2, HSP20 HSP20-like chaperones superfamily protein, STS stachyose synthase, HSFA2 heat shock transcription factor A2, HSP17.6II
17.6 kDa class II heat shock protein, ARATH Adenine nucleotide alpha hydrolases-like superfamily protein, HSP70 BIP1heat shock protein 70 family protein, PEBP
phosphatidylethanolamine-binding protein family protein, HSP21 heat shock protein 21, UGT73B2 UDP-glucosyltransferase 73B2, UGT73B3UDP glucosyl transferase
73B3, HSP90.1 heat shock protein 90.1, AAC3 ADP/ATP carrier 3, DUF1677 protein of unknown function, PIMT2 protein-l-isoaspartate methyltransferase 2, GSTU25
glutathione S-transferase TAU 25, MEE32 dehydroquinate dehydratase, putative/shikimate dehydrogenase.
Lepikson-Neto et al. BMC Plant Biology 2014, 14:301
/>
Page 5 of 17
Figure 2 GO analysis. Common GO categories that were enriched (p-values ≤0.05) between treatments. CH – prolonged naringenin-chalcone
supp; NAR – prolonged naringenin supp; CHSTOP- short term naringenin-chalcone supp; NARSTOP – short-term naringenin supplementation.
highly significant in terms of explaining the higher S/G ratio found in supplemented plants.
Interestingly, no gene related to the phenylpropanoid
pathway was differentially expressed as a result of
NARSTOP treatment.
following the prolonged supplementation treatments.
However, we also observed the up-regulation of several
genes related to secondary cell wall formation after both
prolonged and short-term flavonoid supplementation, including galactinol synthase, stachyose synthase, raffinose
synthase and starch synthase.
Secondary cell wall genes
In addition to genes from the phenylpropanoid pathway,
many genes related to secondary cell wall formation were
differentially expressed in response to flavonoid supplementation (Table 3). Among these genes, we observed
sucrose synthases, cellulose synthases and many glucosylases and transferases, most of which were down-regulated
Stress-related genes
Some of the most differentially expressed genes belonged
to stress-related gene categories, which were up-regulated
in all of the supplemented groups. These genes included
several encoding heat-shock proteins and UDP-glycosil
transferases (Table 4).
Lepikson-Neto et al. BMC Plant Biology 2014, 14:301
/>
Page 6 of 17
Figure 3 MapMan analysis. MapMan overview of the metabolism- and cellular response-related genes among the 1,573 genes that were
differentially expressed under the four different flavonoid treatments. The presented values are the fold changes between the treatment and
control groups. CH – prolonged naringenin-chalcone supp; NAR – prolonged naringenin supp; CHSTOP- short-term naringenin-chalcone supp;
NARSTOP – short-term naringenin supp.
Enzymatic hydrolysis
To verify the effects of flavonoid supplementation on
sugar yields and saccharification in Eucalyptus wood,
enzymatic hydrolysis was performed. The hydrolysates
were analyzed for total sugar contents (‘reduced sugars’),
which included most of the pentoses and hexoses from
the hemicellulose fraction, and glucose content (‘glucose’),
allowing an estimate of the percent of saccharification to
be obtained.
Flavonoid-supplemented plantlets showed increased
sugar and glucose values compared to the control groups.
The reduced sugar content was increased from 50% (CH)
to 250% (NARSTOP), and the glucose content was increased from 43% (CH) to 253% (NARSTOP). With the
exception of the naringenin-chalcone prolonged supplementation treatment (CH), all of the treatment values
were considered statistically significant (Table 5).
Discussion
The metabolism of phenylpropanoids follows 2 main
pathways: the lignin branch and the flavonoid branch. The
two pathways share common substrates and enzymes, and
these shared components lead to a high level of interdependence between the pathways. Considering the economic interest in Eucalyptus trees for paper and pulp
production, and given that flavonoids are known to have a
direct influence on lignification and wood formation in
several species [31,32], including Eucalyptus species, as
previously demonstrated by our group [27], it is of high
interest to verify the effects of flavonoid supplementation
on gene expression, especially concerning genes related to
wood formation. Additionally, there is a pressing interest
in expanding the industrial uses of Eucalyptus because
Eucalyptus forest cultures are well-established in Brazil
and may affect other strategic sectors, such as second-
Lepikson-Neto et al. BMC Plant Biology 2014, 14:301
/>
Page 7 of 17
Table 2 Differentially expressed phenylpropanoid-related genes
FPKM
Gene ID
Annotation
CT
CH
NAR
CHSTOP
NARSTOP
Eucgr.C00859.1
U91A1
0.00
1.60*
0.83
0.28
0.00
Eucgr.K00903.1
AAT
0.38
3.91
4.61*
3.45
1.26
Eucgr.K00901.1
AAT
0.83
0.03*
0.98
1.18
1.51
Eucgr.E01250.1
PRR1
38.77
3.72*
4.68*
7.66
21.15
Eucgr.B03781.1
AA
24.04
0.04*
0.86
1.39
9.77
Eucgr.D02454.1
DFR
0.05
3.10*
2.73*
1.32
0.48
Eucgr.G02325.1
DFR
2.51
28.24*
20.16*
21.06
9.55
Eucgr.F04163.1
LAC14
6.22
0.15
0.32*
0.57
1.82
Eucgr.F02646.1
LAC14
1.99
0.00*
0.02*
0.06*
0.44
Eucgr.F04162.1
LAC14
1.95
0.09
0.04*
0.06
0.72
Eucgr.H04937.1
LAC14
13.67
0.02*
0.15*
0.21
4.66
Eucgr.F04160.1
LAC14
17.17
0.04*
0.25*
0.26*
3.08
Eucgr.F02674.1
LAC14
7.13
0.28
0.27*
0.42
2.90
Eucgr.H04936.1
LAC14
8.51
0.04*
0.03*
0.08
2.50
Eucgr.B02796.1
LAC4
12.04
0.28*
1.95
3.31
5.69
Eucgr.K00957.1
ATOMT1
1.36
17.54
17.19*
10.55
15.16
Eucgr.A01877.1
OMT-like
0.00
0.31
0.79
1.75*
0.22
Eucgr.J00363.1
HCT
88.68
3.76*
16.43
29.57
53.35
Eucgr.B00137.1
4CL
12.31
1.83
2.50*
4.21
6.24
Eucgr.E00270.1
CCR
30.29
3.21
3.29*
4.03
8.00
Eucgr.G01350.2
CAD5
23.73
146.29*
126.30*
144.55
62.96
Eucgr.E01110.2
CAD1
4.34
59.21
49.17*
51.45
27.12
FPKM -fragments per kilobase of exon per million fragments mapped. CT – control; CH – prolonged naringenin-chalcone supp; NAR – prolonged naringenin supp;
CHSTOP- short-term naringenin-chalcone supp; NARSTOP – short-term naringenin sup *Denotes differential expression.
Abbreviations: U91A1 UDP-Glycosyltransferase superfamily protein, AAT HXXXD-type acyl-transferase family protein, PRR1 pinoresinol reductase, AA Plant L-ascorbate
oxidase, DFR Dihydroflavonol-4-reductase, LAC14 laccase 14, LAC4 laccase 4, ATOMT1 O-methyltransferase 1, OMT-like O-methyltransferase family protein, HCT
hydroxycinnamoyl-CoA shikimate transferase, 4 CL 4 coumarate CoA ligase, CCR cinnamoyl-CoA reductase, CAD cinnamyl alcohol dehydrogenase.
generation biochemicals. In this case, Eucalyptus wood
could be employed as lignocellulosic biomass for biological fermentation [33,34].
With this objective, we designed the present work to
investigate the molecular basis of the differences in
wood observed in flavonoid-supplemented E. urograndis
trees. Additionally, in light of our previous findings, we
paid special attention to the expression of genes involved
with lignin and secondary cell wall formation and to the
possible association between gene expression and the
chemical composition of wood in Eucalyptus.
We analyzed the whole genome (44,974 genes) of
Eucalyptus plants following supplementation with different flavonoids. A total of 1,573 (3,5%) differentially
expressedgenes were identified, which were distributed
among the supplementation groups: 963 genes were
down-regulated and 610 genes were up-regulated. Most
of the differentially expressed genes were associated with
the prolonged supplementation groups (1,289 for NAR
and 917 for CH), while the short-term supplementation
groups displayed fewer differentially expressed genes (268
for CHSTOP and 47 for NARSTOP). Most of the differentially expressed genes in the CHSTOP and NARSTOP
groups were also differentially expressed in the NAR and
CH groups. Thus, naringenin supplementation appears to
have had a stronger but less durable effect, while
naringenin-chalcone supplementation has a longer-lasting
effect on gene expression.
GO enrichment analyses demonstrated that there were
several categories involved in cell wall formation that
were down-regulated in all of the supplemented groups,
including the phenylpropanoid pathway in the NARsupplemented samples. The up-regulated gene categories
included many responses to stress and the environment
as well as genes related to sugar alcohols, through being
involved in polyol, hexitol and alditol metabolism (minor
CHOs), in the CH group. This pattern could also be observed in the mapping analysis of differentially expressed
genes performed using MapMan software, in which
several pathways, most notably those associated with the
Lepikson-Neto et al. BMC Plant Biology 2014, 14:301
/>
Page 8 of 17
Table 3 Differentially expressed secondary cell wall genes
FPKM
Gene ID
Annotation
CT
CH
NAR
CHSTOP
NARSTOP
Eucgr.C03199.1
SUS4
1,532.75
66.91*
100.38*
132.04
213.15
Eucgr.C01715.1
SPS1F
3.32
63.28*
54.72
35.80*
28.00
Eucgr.F00464.1
SUT4
28.18
85.70
85.04
82.49*
36.89
Eucgr.D01765.2
CSLG3
0.07
3.26
6.28*
7.07*
1.24
Eucgr.F04010.1
CSLC05
7.51
0.11*
0.35
0.47*
3.06
Eucgr.J00420.1
CSLA2
41.08
2.63*
5.07*
5.87*
25.59
Eucgr.E00226.1
CSLD3
10.13
0.53
0.78
0.68
2.11
Eucgr.E00821.1
CSLG2
3.07
0.38*
0.35
0.78*
3.03
Eucgr.J02497.1
AMR1
1.00
5.25
6.14
6.11*
2.68
Eucgr.J02407.1
MUR1
74.28
18.89
17.82
19.95*
38.28
Eucgr.B03204.1
MUR2
13.62
55.51
54.92
47.91*
32.70
Eucgr.J01663.1
XTH5
97.41
1.21*
1.87*
3.31*
75.71
Eucgr.B03348.1
XTH33
26.89
0.21
0.15*
0.07*
9.47
Eucgr.K00883.2
XTH9
607.60
16.06*
29.74
37.61*
288.85
Eucgr.C00184.1
XTH23
45.26
0.45
0.72*
0.22*
37.20
Eucgr.H02634.1
XTH16
386.73
21.78*
47.14
72.69
396.09
Eucgr.D01294.1
XTH8
10.82
1.01
1.54
1.66*
7.36
Eucgr.J00827.1
GSL12
0.04
0.90*
1.56*
0.98*
0.76*
Eucgr.A02002.1
GSL7
0.20
1.24
2.13
1.38*
0.79
Eucgr.A02008.1
GSL7
0.16
1.07
1.89
1.66*
0.83
Eucgr.K02988.2
GH
16.20
90.51*
69.09*
53.94
47.27*
Eucgr.H00494.1
PWD
6.13
20.24
26.24*
27.22
7.21
Eucgr.H03767.1
BAM9
39.25
225.21
235.09*
217.12
115.07
Eucgr.E00460.1
TPS
0.08
5.75*
6.21*
4.26
0.34
Eucgr.K00387.1
SS
9.88
66.76*
54.46*
39.19
19.93
Eucgr.C04266.1
RafS
26.09
1,317.97*
1007.17
544.49
193.24
Eucgr.K03553.1
STS
0.04
4.11*
4.59*
2.83*
6.87*
Eucgr.H00997.1
STS
0.81
37.45*
29.83*
17.09*
7.06*
Eucgr.K03563.1
GoSL1
0.23
4.48
11.12*
12.00
8.48*
Eucgr.L00249.1
GoSL2
0.34
280.16*
135.36*
52.37*
1.25
Eucgr.L00243.1
GoSL2
0.02
29.83*
19.77*
9.75*
1.37*
Eucgr.L00251.1
GoSL2
0.21
325.56*
149.21*
61.46*
3.38
Eucgr.L03245.1
GoSL2
0.07
190.81*
124.71*
44.86*
2.79*
Eucgr.L00240.1
GoSL2
0.02
34.50*
22.77*
10.27*
0.66
Eucgr.L00248.1
GoSL2
0.17
162.07*
86.93*
32.28*
0.69
Eucgr.L03244.1
GoSL2
0.12
279.83*
137.40*
63.66*
2.99*
Eucgr.L00235.1
GoSL2
0.04
73.19*
38.88*
15.60*
0.03
Eucgr.L00245.1
GoSL2
1.83
287.87*
164.66
80.81*
5.28
Eucgr.F01661.1
Invertase
0.15
2.82*
2.16
2.39*
1.33
Lepikson-Neto et al. BMC Plant Biology 2014, 14:301
/>
Page 9 of 17
Table 3 Differentially expressed secondary cell wall genes (Continued)
Eucgr.J00457.2
Invertase
5.69
47.20*
42.83
33.08*
18.78
Eucgr.G01751.1
Invertase
4.83
0.23*
0.42
1.17*
2.23
Eucgr.A02888.1
Invertase
7.36
0.04*
0.08*
0.08*
1.55
FPKM -fragments per kilobase of exon per million fragments mapped. CT – control; CH – prolonged naringenin-chalcone supp; NAR – prolonged naringenin supp;
CHSTOP- short-term naringenin-chalcone supp; NARSTOP – short-term naringenin sup *Denotes differential expression.
Abbreviations: Sus4 sucrose synthase 4, SPS1F sucrose phosphate synthase 1 F, SUT4 sucrose transporter 4, CSLG3 cellulose synthase like G3, CSLD3 cellulose
synthase-like D3, CSLC05 Cellulose-synthase-like C5, CSLA2 cellulose synthase-like A02, CSLG2 cellulose synthase like G2, CSLG3 cellulose synthase like G3, CESA3
cellulose synthase family protein, AMR1 ascorbic acid mannose pathway regulator 1, MUR1 GDP-mannose 4,6 dehydratase 2, MUR2 fucosyltransferase 1, XTH5
xyloglucan endotransglucosylase/hydrolase 5, XTH33 xyloglucosyl transferase 33, XTH9 xyloglucan endotransglucosylase/hydrolase 9, XTH23 xyloglucan
endotransglycosylase 6, XTH16 xyloglucan endotransglucosylase/hydrolase 16, XTH8 xyloglucan endotransglucosylase/hydrolase 8, GSL12 glucan synthase-like 12,
GSL7 glucan synthase-like 7, GH glycoside hydrolase, PWD phosphoglucan water dikinases, BAM9 beta-amylase 9, TPS trehalose-6-phosphate synthase, SS starch
synthase, Rafs raafinose synthase, STS stachyose synthase, GoSL1 galactinol synthase 1, GoSL2 galactinol synthase 2.
cell wall and phenylpropanoids, were down-regulated,
while the metabolic pathways associated withminor CHOs,
flavonoids, sucrose and starch displayed up-regulated
genes. Furthermore, there was strong evidence that stress
may play a major role, as several stress-related gene categories were found to be enriched via GO analysis, even in
the groups subjected to short-term supplementation.
It was therefore clear that lignification and the phenylpropanoid pathway are affected by a great number of factors, and we believe that our work can help to clarify
some of these factors. The interdependence of the phenylpropanoid, flavonoid and lignin branches has been explored in other studies. For example, it has been reported
that 4CL activity is inhibited by some flavonoids, such as
naringenin-chalcone and naringenin, which are the products of the chalcone synthase (CHS) and chalcone isomerase (CHI) enzymes, respectively [31,35]. The same
study demonstrated that the administration of flavonoids
suppressed the growth of 20 plant species, although the
sensitivities of the plants to flavonoids were different.
In addition, the activation of the lignin precursor cinnamic acid (catalyzed by C4H) and p-coumaroyl-CoA
(catalyzed by 4CL) is, to some extent, regulated by the
activity of the CHS enzyme, which is involved in the first
step of flavonoid biosynthesis [35]. It has also been reported that CHS is associated with growth suppression
via the regulation of 4CL. This association has major importance in lignin biosynthesis in a great number of species [32,35].
As demonstrated by our results, several genes involved
in the phenylpropanoid pathway were differentially
expressed in plants subjected to supplementation with flavonoids (Table 2; Figure 3). Our most noteworthy findings
revealed the differential expression of genes directly related to lignin synthesis. The NAR-supplemented group
presented down-regulation of both the 4CL and CCR
genes, whereas the ATOMT1 and 2 CAD genes were upregulated. The CH-supplemented group exhibited HCT
down-regulation and 1 CAD gene that was up-regulated.
In the CHSTOP-supplemented group, 1 methyltransferase
was up-regulated. No genes from the phenylpropanoid
pathway were differentially expressed following supplementation with NARSTOP.
Surprisingly, the gene encoding F5H, which is one of
the key enzymes involved in the synthesis of the monolignol sinapyl alcohol and, ultimately, the S lignin moiety,
was not found to be differentially expressed on our analyses. This result is particularly interesting in light of our
finding that the S/G ratios in all of the flavonoidsupplemented groups were higher than that of the control
group. Thus, we expected a change in the expression of
F5H following flavonoid treatment. Because phenylpropanoid metabolism is complex, it is likely that the differential
regulation of other enzymatic steps, such as those encoded
by the 4CL, HCT, CCR, ATOM1 and CAD genes, may
underlie this response.
Some findings reported in the literature support this
possibility. For example, 4CL plays a major role in phenylpropanoid metabolism, as its product, p-coumaroylCoA, is a substrate that is common to the flavonoid and
lignin synthesis pathway. HCT silencing in Arabidopsis
represses lignin synthesis and plant growth, and the
metabolic flux is redirected toward flavonoids by chalcone synthase activity [24]. CCR catalyzes the reduction
of hydroxycinnamoyl-CoA thioesters to the corresponding aldehydes; this reaction is considered to be a potential control point that regulates the overall carbon flux
in favor of lignin [36]. Arabidopsis ATOMT1 knock-out
mutants lack S units [37], and CAD catalyzes the reduction of cinnamaldehydes to cinnamyl alcohols, which is
the last step in the biosynthesis of the monolignols, thus
playing a pivotal role in determining the lignin monomer
composition and increasing S contents [13].
There are also several laccases that have been demonstrated to be involved in lignification [38], and many
laccases were found to be down-regulated in the NAR-,
CH- and CHSTOP-supplemented samples.
Our results further corroborate those of [39], who suggested that Arabidopsis responds to the accumulation of
1 or more intermediates from the flavonoid pathway
by down-regulating either the whole phenylpropanoid
pathway or the specific branch leading to monocyclic
Lepikson-Neto et al. BMC Plant Biology 2014, 14:301
/>
Page 10 of 17
Table 4 Differentially expressed stress-related genes
FPKM
Gene ID
Annotation
CT
CH
NAR
CHSTOP
NARSTOP
Eucgr.H05081.4
ALDH3I1
4.84
0.93*
1.11*
1.60
5.34
Eucgr.C00112.1
CIA2
0.70
12.29*
14.05*
17.42*
3.57
Eucgr.K01387.2
COL9
3.33
26.78*
22.63*
18.02*
2.56
Eucgr.C03449.1
HSFA2
0.29
14.55*
12.98*
14.36*
18.58*
Eucgr.C03456.1
HSFA2
0.09
2.67*
3.64*
2.25*
1.45
Eucgr.C00873.1
HSFA2
1.92
24.38*
18.82*
14.75*
7.94
Eucgr.C03434.1
HSFA2
0.31
6.75*
6.22*
6.19*
2.03
Eucgr.C01043.1
HSFC1
2.92
122.26*
116.87*
96.98*
13.96
Eucgr.J01981.1
HSP18.2
2.00
34.43
50.34
69.86*
105.48*
Eucgr.J01980.1
HSP18.2
0.02
12.20*
11.59*
9.15*
26.39*
Eucgr.J01959.1
HSP18.2
3.19
142.90*
89.76*
58.22*
148.21*
Eucgr.J01958.1
HSP18.2
2.68
115.32*
90.34*
65.56
100.03
Eucgr.J01979.1
HSP18.2
0.34
17.61*
19.94*
14.63*
27.21*
Eucgr.J01958.1
HSP18.2
2.68
115.32*
90.34*
65.56
100.03
Eucgr.J01979.1
HSP18.2
0.34
17.61*
19.94*
14.63*
27.21*
Eucgr.J01977.1
HSP18.2
0.37
9.43*
8.59*
7.08
19.26*
Eucgr.J01964.1
HSP18.2
13.65
145.21*
119.05*
111.04
251.88*
Eucgr.J01985.1
HSP18.2
0.31
22.25*
16.62*
13.21*
33.33*
Eucgr.J01982.1
HSP18.2
0.21
8.65*
6.06*
4.24
13.03*
Eucgr.F04479.1
HSP20-like
0.12
35.55*
40.44*
23.84*
57.92*
Eucgr.I02136.1
HSP20-like
1.68
226.73*
147.43*
90.02*
259.35*
Eucgr.J01969.1
HSP20-like
4.89
192.23*
134.53*
103.09*
310.44*
Eucgr.G00061.1
HSP20-like
9.45
834.94*
858.21*
726.74*
814.87
Eucgr.E00433.1
HSP20-like
3.35
295.94
205.55*
185.03
165.89
Eucgr.F02898.1
HSP20-like
2.76
525.99*
343.17*
280.68*
342.59*
Eucgr.A01416.1
HSP21
0.08
12.40*
7.60*
4.34*
0.29
Eucgr.H04692.1
HSP21
2.97
83.31*
59.57*
43.11*
313.22*
Eucgr.J03127.1
Hsp70b
8.27
1576.75
1347.55*
881.92
925.42
Eucgr.H03518.1
HSP70T-2
6.06
282.04*
218.12*
152.91
249.47
Eucgr.K00295.1
HSP90-1
2.11
46.13*
38.25
35.52*
62.69*
Eucgr.F03704.1
MSL6
1.45
27.74
21.67*
11.53*
10.03
Eucgr.H02896.1
MYB305
0.07
6.57*
8.20*
6.34*
1.14
Eucgr.C00618.1
Oleosin
0.50
38.75*
24.66*
18.36*
2.85
Eucgr.F01003.1
PAT1
2.30
43.54*
47.40*
43.89*
6.02
Eucgr.K00237.1
PEBP
0.04
115.83*
64.41*
61.47*
11.49*
Eucgr.B00176.2
PIMT2
3.86
153.25*
109.01*
82.97*
57.39*
Eucgr.G01510.1
RLK
1.71
10.40*
11.17*
11.20*
6.80
Eucgr.F01854.1
TRX1
4.16
598.03*
295.93*
191.61*
25.01
Eucgr.G02440.1
UGT73B2
0.00
5.46*
5.80*
3.33*
4.06*
Eucgr.L03261.1
UGT73B3
1.44
47.41*
27.81*
19.98*
75.67*
Lepikson-Neto et al. BMC Plant Biology 2014, 14:301
/>
Page 11 of 17
Table 4 Differentially expressed stress-related genes (Continued)
Eucgr.G02259.1
UGT73B3
0.00
2.73*
2.14*
1.18*
3.10*
Eucgr.I00409.1
UGT73B3
0.06
3.27*
4.18*
2.91*
0.60
Eucgr.B02291.1
UGT76E11
10.86
52.79*
42.69*
39.45
45.69
Eucgr.K01389.2
XERICO
19.81
1,348.64*
796.35*
569.70*
120.14
FPKM -fragments per kilobase of exon per million fragments mapped. CT – control; CH – prolonged naringenin-chalcone supp; NAR – prolonged naringenin supp;
CHSTOP- short-term naringenin-chalcone supp; NARSTOP – short-term naringenin sup *Denotes differential expression.
Abbreviations: ALDH3I1 –aldehyde dehydrogenase 3I1, CIA2 chloroplast import apparatus 2, COL9 CONSTANS-like 9, HSFA2 heat shock transcription factor A2,
HSFC1 heat shock transcription factor C1, HSP18.2 heat shock protein 18.2, HSP20 like chaperones superfamily protein, HSP21 heat shock protein 21, Hsp70b heat
shock protein 70B, HSP70T-2 heat-shock protein 70 T-2, HSP90.1 heat shock protein 90.1, MSL6 mechanosensitive channel of small conductance-like 6, MYB305
myb domain protein 305, Oleosin family protein; PAT1 GRAS family transcription factor, PEBP –phosphatidylethanolamine-binding protein family protein, RLK
receptor lectin kinase, TRX1 thioredoxin H-type 1, UGT73B2 UDP-glucosyltransferase 73B2, UGT73B3 UDP-glucosyl transferase 73B3, UGT76E11 UDP-glucosyl
transferase 76E11, XERICO RING/U-box superfamily protein.
phenolic compounds. According to our results, it is possible that the accumulation of naringenin-chalcone and
naringenin, the products of CHS and CHI, respectively,
due to exogenous supplementation, results in the downregulation of genes from the phenylpropanoid pathway,
with the exception of 2 genes involved in the final steps
of sinapilic acid synthesis (ATOMT1 and CAD). This
down-regulation may at least partially explain the higher
S/G ratios observed in the supplemented samples and is
in agreement with the findings of [40] that the reduction
of total flux through the entire monolignol pathway affects G-lignin resulting in higher S/G ratio.
While the NARSTOP-supplemented plants did not
show differential expression of any genes that are related
to lignin synthesis according to our statistical analyses,
they exhibited FPKM values that were similar to those of
the NAR-, CH- and CHSTOP-supplemented groups, but
closer to the control values than the other groups. This
indicates that an early impact on gene expression may
be sufficient to promote the phenotypic differences observed in this group.
Another possibility is that factors other than the genes
from the lignification pathway per se influence the lignin
monomer composition. Cook and collaborators [41] reported that the levels of cellulose, xylan and lignin are
not completely dependent on the transcription of the
genes involved in these metabolic pathways. Thus, the
regulation of cell wall biosynthesis occurs at different
levels, not only at the transcriptional level [41].
Additionally, other genes that have not yet been discovered may be causing the observed differences, as
many no hits and unknown proteins were found among
the most differentially expressed genes following flavonoid treatment. The stress and environmental response
pathways were significantly enriched and associated with
lignification; thus, these pathways may play major roles
in the alterations of lignin composition after flavonoid
supplementation.
Stress and lignification are closely related. Many of the
products of the phenylpropanoid pathway are induced
by biotic and abiotic stress [42]. Both flavonoids and
sinapate esters, which are used for lignin synthesis, are
important for UV protection [39]. Arabidopsis mutants
with reduced levels of CHS and CHI activity show up to
60% higher levels of sinapate esters [39,42].
Moreover, a large number of phenylpropanoids are induced by stress, such as those derived from the C15 flavonoid skeleton that are synthesized via the chalcone
synthase (CHS)-mediated condensation of p-coumaroylcoenzyme A (CoA) and three molecules of malonyl-CoA
[43]. In most plant families, the initial product of CHS is
a tetrahydroxychalcone, which is further converted to
other flavonoid classes, such as flavones, flavanones, flavanols, anthocyanins and 3-deoxyanthocyanidins, all of
which are compounds that are important in the response
to stress [44].
The observation that several genes related to stress
responses are differentially expressed in flavonoid-
Table 5 Total sugar and glucose values
CT
n
Reduced sugars (mg/ml)
Reduced sugar yield %
Glucose (mg/ml)
7
1.17 (0.67)
5.69 (3.23)
0.39 (0.23)
CH
4
1.8 (0.33)
9.06 (1.83)
0.56 (0.07)
NAR
3
2.54 (0.005)**
12.72 (0.66)**
0.87 (0.10)**
CHSTOP
3
2.32 (0.24)*
11.81 (1.08)*
0.85 (0.29)*
NARSTOP
3
3 (0.85)**
14.59 (4.34)**
0.99 (0.09)**
Mean values and standard deviations (parentheses) for total sugar and glucose levels. n –number of biological replicates; CT – control; CH – prolonged naringenin-chalcone
supp; NAR – prolonged naringenin supp; CHSTOP –short-term naringenin-chalcone supp; NARSTOP – short-term naringenin supp. *p-value <0.05; **p-value <0.01.
Lepikson-Neto et al. BMC Plant Biology 2014, 14:301
/>
supplemented trees confirms the importance of stress
responses in defining Eucalyptus wood properties as has
been previously shown by our group [45]. In this work, a
comparison between three Eucalyptus species revealed differential expression of stress-related genes in E. urophylla,
which could explain the higher plasticity and adaptability
of this species compared to E. grandis and E. globulus, the
two other studied species.
In the present study, the stress-related genes that were
differentially expressed following flavonoid treatments included a noteworthy group composed of several UDPglucosyltransferases (UGTs), which were up-regulated in
all of our treatments. In plants, UGTs utilize UDP-glucose,
UDP-galactose, and UDP-rhamnose as sugar donors and
are involved in the modulation of plant architecture and
the water stress response in Arabidopsis [46]. The glucosylation of coniferyl aldehyde and sinapyl aldehyde may regulate both lignin biosynthesis and the metabolism of other
phenylpropanoids, such as ferulic acid, 5-hydroxyferulic
acid, sinapic acid and their derivatives [47]. Thus, the presence of up-regulated UGTs in all of the groups is another
interesting result that might help elucidate the chemical
differences present in the flavonoid-supplemented trees.
Another notable finding regarding cell wall formation
was the differential expression of genes involved in the
metabolism of sucrose, starch, CHOs and minor sugars.
Despite the down-regulation of sucrose synthase (Sus) and
cellulose synthase (CesA), there were several other enzymes
involved in this metabolic pathway that were up-regulated
in the prolonged flavonoid treatments, even in the shortterm treatments. Starting with galactinol synthase (GolS2),
Page 12 of 17
which was one of the most differentially expressed genes,
all of the downstream genes in this pathway were differentially expressed (up-regulated), most of which were
up-regulated after both the prolonged and short-term
treatments.
The most notable of these genes was stachyose synthase
(STS), which converts raafinose (a trisaccharide of galactose, fructose and glucose) into stachyose (a tetrasaccharide) by transferring a galactosyl moiety from galactinol,
[48]. Raafinose synthase (RafS) was also differentially
up-regulated. Additionally, sucrose phosphate synthase
(SPS1F), which catalyses the conversion of UDP-glucose
and D-fructose 6-phosphate into UDP and sucrose
6-phosphate [49], was also differentially up-regulated
(Figure 4).
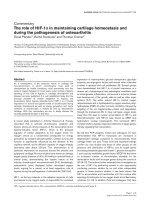
Starch synthase (SS) was up-regulated as well, as were
enzymes involved in the degradation of starch into maltose (beta-amylase; BAM) and glucose (glycoside hydrolase; GH and phosphoglucan water dikinases; PWD).
These results suggest a shift from sucrose and cellulose
production to the synthesis of starch and minor sugars
(galactinol, raffinose and stachyose).
Thus, to verify the possible effects of these transcriptional responses on cell wall formation and sugar accessibility, enzymatic hydrolysis was performed in wood
samples from all of the experimental and control plants.
The results revealed an increase in sugar contents (up to
250% in the NARSTOP group) and glucose yields of all
of the flavonoid-supplemented Eucalyptus plants.
This may be the result of the plants producing more
sugar or a result of the increased digestibility of lignin
Figure 4 Effects of flanonoid supplementantion on secondary cell wall related genes. The effects of flavonoid supplementation on the
expression of secondary cell wall-related genes. Sus –sucrose synthase; SPS –sucrose phosphate synthase; CesA –cellulose synthase;; GH –glycoside
hydrolase; PWD –phosphoglucan water dikinases; BAM –beta-amylase; TPS –trehalose-6-phosphate synthase; SS –starch synthase; Rafs – raafinose
synthase; STS –stachyose synthase; GoSL –galactinol synthase.
Lepikson-Neto et al. BMC Plant Biology 2014, 14:301
/>
due to modifications of lignin structure and other cell
wall components. The total values should increase exponentially with the use of pre-treatments and the extension of milling times [50,51].
Galactinol, raffinose and stachyose have been described
as being involved in freezing and stress tolerance [52,53].
The levels of galactinol and raffinose are increased in the
leaves of Arabidops is plants over-expressing HsfA2, a
heat shock factor, suggesting a possible role for these compounds in protection from oxidative damage [54]. Moreover, this factor may also constitute another link between
the stress response and cell wall formation in flavonoidsupplemented Eucalyptus plants because all of our treatment groups showed more than 1 up-regulated HsfA2
gene.
Our results are also in agreement with those of [55],
who verified that in poplar trees, the over-expression of
GolS and its product, galactinol, may serve as a molecular signal that initiates metabolic changes associated with
combating stress, culminating in the formation of tension wood and increased glucose contents. Additionally,
over-expression of raffinose synthase was found to result
in increased biomass and total cellulose contents, while
the total contents of lignin and xylose moieties were
slightly reduced. Furthermore, the total amount of glucose was commensurately increased in the transgenic
trees, by from ~1 to 4% [55]. Moreover, repression of
the flavonoid pathway in Arabidopsis increases starch
levels [56], and a chalcone isomerase-deficient Arabidopsis
mutant exhibits increased levels of starch and soluble
sugars in its leaves.
Based on our results, flavonoid supplementation causes
a stress response in E. urograndis, greatly affecting cell
wall development, modifying lignification by affecting the
expression of genes involved in the phenylpropanoid pathway and altering sugar metabolismin favor of starch and
minor sugar synthesis, resulting in increased sugar accessibility and saccharification.
Conclusions
The effects of flavonoid supplementation on cell wall development in Eucalyptus plants are most likely due to a
combination of transcriptional changes in several distinct
pathways. The down-regulation of the phenylpropanoid
pathway, combined with the up-regulation of ATOMT1
and CAD, results in a higher S/G ratio, which in turn, increases lignin solubility and facilitates access to cellulose
and hemicellulose. Subsequently, as a result of the stress
response, sugar metabolism is shifted towards starch and
minor sugars, culminating in the increased sugar and saccharification levels identified due to hydrolysis.
Given the importance of Eucalyptus in several industrial sectors, there is great interest in expanding the use
of these species as a resource for cellulose, paper and
Page 13 of 17
pulp production and as an alternative source of biomass
for second-generation biochemicals. Our results contribute not only to our understanding of the molecular
responses involved in wood formation but will also have
a significant impact on the use of Eucalyptus as biomass.
Finally, we expect our findings to guide future genetic
manipulation and nutritional supplementation analyses
of Eucalyptus trees aimed at achieving significant improvements in their productivity yields.
Methods
Plant materials and tissue harvesting
Plantlets of a 6-month-old commercial clone of Eucalyptus
urograndis were provided by International Paper (MogiGuaçu, Brazil) and grown in a greenhouse. The plantlets
were divided into 5 groups according to supplementation
conditions (apart from the standard nutritional solution
supplied to all groups), as follows: control group (CT);
experimental group 1 (CH), supplemented with 0.1 mmol
of naringenin-chalcone for 5 months; experimental group
2 (NAR), supplemented with 0.1 mmol of naringenin for
5 months; experimental group 3 (CHSTOP), supplemented with 0.1 mmol of naringenin-chalcone for only
the first month and then given the standard nutrition
solution for the next 5 months; and experimental group 4
(NARSTOP), supplemented with 0.1 mmol of naringenin
for only the first month and then given the standard nutrition solution for the next 5 months. Approximately
100–150 mL of each solution was administered via root
application daily. The treatments lasted 5 months. The
composition of the standard nutritional solution has been
described previously [57]. At the end of the experiment,
all 5 groups of plantlets were cut, and their stems were
debarked, immediately frozen in liquid nitrogen and kept
at −80°C for analysis; no growth differences were observed
between the control and treatment groups (Additional
file 4). All samples were analyzed 5 months after the
beginning of the experiment, regardless of the applied
supplementation.
Naringenin (4′-,5-,7-trihydroxyflavanone, 95%) and
naringenin-chalcone (1,3-diphenyl-2-propen-1-one, 97%)
were purchased from Sigma-Aldrich Co. (Tokyo, Japan)
and AcrosOrganics Co. (Tokyo, Japan), respectively.
Total RNA extraction
Total RNA was extracted according to the protocol described by [58], with the modifications proposed by [59].
The obtained RNA concentration and quality were verified using a Nanodrop 2000 spectrophotometer (Thermo
Scientific).
mRNA sequencing
mRNA sequencing was performed at the High-Throughput
Sequencing Facility of the Carolina Center for Genome
Lepikson-Neto et al. BMC Plant Biology 2014, 14:301
/>
Sciences (University of North Carolina, USA). From each
xylem sample, 10 μg of total RNA was used to prepare an
mRNAseq library according to the protocol provided by
Illumina. The gel extraction step was modified by dissolving excised gel slices at room temperature to avoid
underrepresentation of AT-rich sequences [60]. Quality
control and quantification of the libraries were performed
using a DNA 1000 series II Bioanalyzer Chip (Agilent).
For each library, single-end sequences of 36 or 50 bp were
generated in a single lane using an Illumina Genome
Analyzer IIx. A total of 8 libraries were generated: 3 biological replicates of the control group (CT); 2 biological
replicates of the 5-month naringenin-supplemented
groups (NAR); and 1 library for each remaining group
(subjected to 1 month of supplementation with naringenin (NARSTOP), 5 months of supplementation with
naringenin-chalcone (CH) or 1 month of supplementation
with naringenin-chalcone (CHSTOP). Each library was
constructed from a sample pooled from 3 individual trees.
The complete dataset of RNA-seq reads has been deposited in SRA under accession numbers SRS716289;
SRS716288, SRS716285; SRS716286; SRS716284.
Read alignment
The obtained Illumina reads were filtered to exclude ribosomal sequences (using the SILVA database [61] and low
quality reads (phred ≥20). The remaining reads were
aligned against the greater splice variants of E. grandis
transcripts from Phytozome 7.0 (44,974 sequences) available at ( [62] using the SOAP2
alignment software package [28]. To prepare the data for
Genebrowser analysis, the read were aligned to the E.
grandis genome using the TopHat aligner [63] to allow for
spliced alignments. Both programs were configured to
allow up two mismatches (because SNPs can generate mismatches in the alignments, especially in cases such as the
present analysis, where the sequences come from different
species), discard sequences with ambiguities (Ns) and return only reads with unique alignments.
Gene annotation
The Autofact program [64] was used to perform an automatic annotation of all E. grandis transcripts. The main
feature of Autofact is its ability to perform gene annotation based on sequence similarity searches of several databases. BLASTx [65] (e-value cutoff of 1e-5) was used to
align the obtained contigs against the following public
databases: the NCBI non-redundant (NR) database; the
Uniref90 and Uniref100 databases, which contain clustered
sets of proteins from Uniprot [66]; the KEGG database of
metabolic pathways [67]; and TAIR (version 10), an Arabidopsis proteins database. Functional annotation (GO) was
performed using BLAST2GO [68] and MaPMAN [69]
with the default parameters.
Page 14 of 17
Determination of gene expression levels
Gene expression was measured via the FPKM (fragments
per kilobase of exon per million fragments mapped)
method using only one read alignment for each transcript,
as described by [70]. The FPKM values for all transcripts
are available for searching in the EUCANEXT database
(www.lge.ibi.unicamp.br/eucalyptusdb).
Enzymatic hydrolysis
Substrate preparation
Samples from each Eucalyptus treatment were frozen in
liquid nitrogen and then dried in FreeZone6 (Labconco)
at - 51°C and 25 Pa for 48 hours. Subsequently, the
lignocellulosic material was reduced through 1 cycle of
5 minutes in a ball-milling reactor. The milled material
was used as a substrate for fungal growth and hydrolysis
assays.
Secretome production for enzymatic hydrolysis
The Neurospora crassa wide strain St.L. 74A (Missouri
University, Kansas City, was used for
secretome production. Conidia preparation was performed
by inoculating the fungus in 100 mL of minimal medium
plus Vogel’s salts supplemented with 143 μL of biotin
(biotin 5 mg, ethanol 50% (v/v), 143 μL of a trace element
solution (5 g monohydrate citric acid, 5 g of ZnSO4.7H2O,
1 g of Fe (NH4)2.6H2O, 0.25 g of CuSO4.5H2O, 0.05 g
MnSO4.H2O, 0.05 g H3BO3, 0.05 g Na2MoO4.2H2O, qsp
1,000 mL), 1.5% agar and 2% sucrose. The prepared samples were grown for 3 days at 30°C in the dark and then
for 7 days in the light at 25°C. A conidial suspension was
then inoculated in 100 mL of the same medium described
above without agar [71] containing as the only carbon
source 2% of a substrate blend of 3 Eucalyptus species:
E. grandis, E. urograndis and E. urophylla, in a ratio of
3:3:1, prepared as described above.
Eucalyptus hydrolysis
Hydrolysis was performed as described by [72] with the
following modifications: enzymatic hydrolysis was performed in 2 mL tubes shaken at 1,000 rpm at 30°C in a
Thermomixer (Eppendorf) for 48 hours. Approximately
10 mg of substrate from each substrate preparation was diluted in 400 μL of 50 mM sodium acetate buffer pH 5.5,
and 100 μL of the N. crassa secretome was then added.
The protein concentration of the secretome was 0.4 μg/μL,
as determined in a Bradford Kit assay (BioRad) with BSA
as a standard. This temperature and pH were optimal
for the hydrolysis of carboxymethyl cellulose, xylan and
ß-glucan, as determined by testing the temperatures of
25–40°C and pH levels of 4.0 − 9.0. All hydrolysis reactions were performed in triplicate. For determination of
the reducing sugar concentration and glucose production
in supernatants derived from Eucalyptus hydrolysis, 2 mL
Lepikson-Neto et al. BMC Plant Biology 2014, 14:301
/>
tubes were centrifuged at 20,000 × g for 10 minutes at
4°C. The supernatant was then recovered, and 100 μL of
each reaction was used to determine the content of reducing sugars by adding 100 μL of the dinitrosalicylic acid
(DNS) assay reagent [73] heated to 99°C. A 100 μl aliquot
of the sample was next transferred to an ELISA plate, and
its absorbance was measured at 540 nm using a Tecan
Infinite M200 microplate reader, referring to calibration
curves generated from glucose solutions. To calculate
glucose contents, 20 μL of the supernatant was added to
100 μL of a working solution from a Glucose Oxidase Kit
(Laborlab) in ELISA plates. The reaction was subsequently
incubated at 37°C for 10 minutes, and its absorbance and
measured at 505 nm (in a Tecan Infinite M200 microplate
reader). Glucose concentrations were calculated with a
factor referring to a standard solution of glucose at
1 mg/mL. A blank reaction containing only buffer and
substrate was subtracted from the measurements obtained
for each assay. To verify significant differences between
the controls and the flavonoid-supplemented groups, a
one way ANOVA test was performed between the control
and each supplemented group. The results were considered significant if p < 0.05 and were classified as follows:
*, p < 0.05; **, p < 0.01.
Supporting data
The data set(s) supporting the results of this article is (are)
included within the article (and its additional file (s)). The
complete dataset of RNA-seq reads has been deposited in
SRA under accession numbers: SRS716289; SRS716288,
SRS716285; SRS716286; SRS716284. The FPKM values
for all transcripts are available for searching in the EUCANEXT database (www.lge.ibi.unicamp.br/eucalyptusdb).
Additional files
Additional file 1: All expressed genes on any condition.
Additional file 2: All differential expressed genes on all conditions.
Additional file 3: Complete gene onthology analysis.
Additional file 4: Height and diameter of samples.
Competing interests
The authors declare that they have no competing interests.
Authors’ contributions
JLN designed and carried field experiments, analyzed RNA-seq data,
performed sacharification experiments, and wrote the manuscript. LCN
provided bioinformatic support, designed the database and automatic
annotation, and reviewed the manuscript. MMS helped with field experiment,
analyze RNA-seq data and reviewed the manuscript. ELOC designed and helped
with field experiments, participated on the manuscript conception and
reviewed the manuscript. JPFC designed and performed sacharification
experiments and reviewed the manuscript. PJT prepared libraries and
performed RNA sequencing. WLM helped with field experiments and sampling
of material and RNA. FMS designed and coordinated enzymatic hydrolysis
experiments. PM designed and coordinated RNA-seq experiments and data
acquisition. ACD supervised all experiments and helped draft and review the
manuscript with substantial contribution to data interpretation. GAGP
Page 15 of 17
conceived the study, and participated in its design and coordination and
helped to draft the manuscript and participated in data analysis. All authors
read and approved the final manuscript.
Acknowledgements
This project was funded by the Coordenação de Aperfeiçoamento de
Pessoal de Nível Superior (CAPES) and the Conselho Nacional de
Desenvolvimento Científico e Tecnológico (CNPQ) and Grant #2012/22652-7,
São Paulo Research Foundation (FAPESP). We would like to acknowledge the
contributions of the Center for Computational Engineering and Sciences at
UNICAMP SP Brazil (FAPESP/CEPID project #2013/08293-7), and we would
especially like to thank International Paper do Brasil for their assistance.
Author details
1
Departamento de Genética e Evolução, Laboratório de Genômica e
Expressão, Instituto de Biologia, Universidade Estadual de Campinas,
Campinas, São Paulo, Brazil. 2Laboratório Nacional de Ciência e Tecnologia
do Bioetanol, CTBE, Campinas, São Paulo, Brazil. 3Department of Genetics,
School of Medicine, University of North Carolina at Chapel Hill (UNC), Chapel
Hill, NC, USA.
Received: 22 May 2014 Accepted: 22 October 2014
References
1. Boudet AM, Kajita S, Grima-Pettenati J, Goffner D: Lignins and lignocellulosics:
a better control of synthesis for new and improved uses. Trends Plant Sci
2003, 8:576–581.
2. Plomion C, Leprovost G, Stokes A: Wood formation in trees. Plant Physiol
2001, 127:1513–1523.
3. Rengel D, San Clemente H, Servant F, Ladouce N, Paux E, Wincker P,
Couloux A, Sivadon P, Grima-Pettenati J: A new genomic resource
dedicated to wood formation in Eucalyptus. BMC Plant Biol 2009, 9:36.
4. Paiva JAP, Prat E, Vautrin S, Santos MD, San-Clemente H, Brommonschenkel
S, Fonseca PGS, Grattapaglia D, Song X, Ammiraju JSS, Kudrna D, Wing RA,
Freitas AT, Bergès H, Grima-Pettenati J: Advancing eucalyptus genomics:
identification and sequencing of lignin biosynthesis genes from
deep-coverage BAC libraries. BMC Genomics 2011, 12:137.
5. Grattapaglia D, Vaillancourt RE, Shepherd M, Thumma BR, Foley W, Külheim
C, Potts BM, Myburg AA: Progress in myrtaceae genetics and genomics:
eucalyptus as the pivotal genus. Tree Genet Genomes 2012, 8:463–508.
6. Fukuda H: Xylogenesis: initiation, progression, and cell death. Annu Rev
Plant Physiol Plant Mol Biol 1996, 47:299–325.
7. Paux E, Carocha V, Marques C, Mendes De Sousa A, Borralho N, Sivadon P,
Grima-Pettenati J: Transcript profiling of Eucalyptus xylem genes during
tension wood formation. New Phytol 2005, 167:89–100.
8. Kirst M, Myburg AA, De León JPG, Kirst ME, Scott J, Sederoff R: Coordinated
genetic regulation of growth and lignin revealed by quantitative trait
locus analysis of cDNA microarray data in an interspecific backcross of
eucalyptus. Plant Physiol 2004, 135:2368–2378.
9. Foucart C, Jauneau A, Gion J-M, Amelot N, Martinez Y, Panegos P,
Grima-Pettenati J, Sivadon P: Overexpression of EgROP1, a Eucalyptus
vascular-expressed Rac-like small GTPase, affects secondary xylem
formation in Arabidopsis thaliana. New Phytol 2009, 183:1014–1029.
10. Vanholme R, Demedts B, Morreel K, Ralph J, Boerjan W: Lignin biosynthesis
and structure. Plant Physiol 2010, 153:895–905.
11. Hu WJ, Harding SA, Lung J, Popko JL, Ralph J, Stokke DD, Tsai CJ, Chiang VL:
Repression of lignin biosynthesis promotes cellulose accumulation and
growth in transgenic trees. Nat Biotechnol 1999, 17:808–812.
12. Fu D, Mazza G, Tamaki Y: Lignin extraction from straw by ionic liquids
and enzymatic hydrolysis of the cellulosic residues. J Agric Food Chem
2010, 58:2915–2922.
13. Baucher M, Halpin C, Petit-conil M, Boerjan W: Lignin: genetic engineering
and impact on pulping. Crit Rev Biochem Mol Biol 2003, 38:305–350.
14. Li X, Ximenes E, Kim Y, Slininger M, Meilan R, Ladisch M, Chapple C: Lignin
monomer composition affects Arabidopsis cell-wall degradability after
liquid hot water pretreatment. Biotechnol Biofuels 2010, 3:27.
15. Boudet A-M: Lignins and lignification: selected issues. Plant Physiol
Biochem 2000, 38:81–96.
16. Dixon RA, Lamb CJ, Masoud S, Sewalt VJH, Paiva NL: Metabolic
engineering: prospects for crop improvement through the genetic
Lepikson-Neto et al. BMC Plant Biology 2014, 14:301
/>
17.
18.
19.
20.
21.
22.
23.
24.
25.
26.
27.
28.
29.
30.
31.
32.
33.
34.
35.
36.
37.
38.
39.
manipulation of phenylpropanoid biosynthesis and defense responses — a
review. Gene 1996, 179:61–71.
Guo D, Chen F, Inoue K, Blount JW, Dixon R a: Downregulation of caffeic
acid 3-O-methyltransferase and caffeoyl CoA 3-O-methyltransferase in
transgenic alfalfa. Impacts on lignin structure and implications for the
biosynthesis of G and S lignin. Plant Cell 2001, 13:73–88.
Ferrer J-L, Austin MB, Stewart C, Noel JP: Structure and function of
enzymes involved in the biosynthesis of phenylpropanoids. Plant Physiol
Biochem 2008, 46:356–370.
Rodrigues J, Meier D, Faix O, Pereira H: Determination of tree to tree
variation in syringyl/guaiacyl ratio of Eucalyptus globulus wood lignin by
analytical pyrolysis. J Anal Appl Pyrolysis 1999, 48:121–128.
Papermaking Properties of Eucalyptus Trees, Woods, and Pulp Fibers
Celso Foelkel. [ />Voo KS, Whetten RW, O’Malley DM, Sederoff RR: 4-coumarate:coenzyme a
ligase from loblolly pine xylem. Isolation, characterization, and
complementary DNA cloning. Plant Physiol 1995, 108:85–97.
Campbell MM, Sederoff RR: Variation in lignin content and composition
(mechanisms of control and implications for the genetic improvement
of plants). Plant Physiol 1996, 110:3–13.
Vogt T: Phenylpropanoid biosynthesis. Mol Plant 2010, 3:2–20.
Besseau S, Hoffmann L, Geoffroy P, Lapierre C, Pollet B, Legrand M:
Flavonoid accumulation in Arabidopsis repressed in lignin synthesis
affects auxin transport and plant growth. Plant Cell 2007, 19:148–162.
Moustafa E: Purification and properties of chalcone-flavanone isomerase
from soya bean seed. Phytochemistry 1967, 6:625–632.
Chen W-J, Yun M-S, Deng F, Yogo Y: Chalcone suppresses lignin
biosynthesis in illuminated soybean cells. Weed Biol Manag 2011,
11:49–56.
Lepikson-Neto J, Alves A, Deckmann AC, Camargo LO, Salazar MM, Carolina
Scatollin Rio M, Nascimento LC, Pereira GAG, Rodrigues JC: Flavonoid
supplementation reduces extractives content and increases S/G ratio on
Eucalyptus grandis x Eucalyptus urophylla hybrid trees. Bioresources 2013,
8:1–11.
Li R, Yu C, Li Y, Lam T-W, Yiu S-M, Kristiansen K, Wang J: SOAP2: an
improved ultrafast tool for short read alignment. Bioinformatics 2009,
25:1966–1967.
Shamir R, Maron-Katz A, Tanay A, Linhart C, Steinfeld I, Sharan R, Shiloh Y,
Elkon R: EXPANDER–an integrative program suite for microarray data
analysis. BMC Bioinformatics 2005, 6:232.
Hardcastle TJ, Kelly KA: BaySeq: empirical Bayesian methods for
identifying differential expression in sequence count data. BMC
Bioinformatics 2010, 11:422.
Chen W-J, Yun M-S, Deng F, Yogo Y, L S: Effects of root-applied naringenin
and chalcone on the growth of annual plants. Weed Biol Manag 2004,
238(August):235–238.
Deng F, Aoki M, Yogo Y: Effect of naringenin on the growth and lignin
biosynthesis of gramineous plants. Weed Biol Manag 2004, 4:49–55.
Mizrachi E, Mansfield SD, Myburg AA: Cellulose factories: advancing
bioenergy production from forest trees. New Phytol 2012, 194:54–62.
Mansfield SD, Kang K-Y, Chapple C: Designed for deconstruction–poplar
trees altered in cell wall lignification improve the efficacy of bioethanol
production. New Phytol 2012, 194:91–101.
Chen W, Yun M-S, Deng F, Yogo Y: The rates of maize growth and lignin
biosynthesis change after root-applied chalcone. Weed Biol Manag 2005,
5:118–122.
Lacombe E, Hawkins S, Van Doorsselaere J, Piquemal J, Goffner D,
Poeydomenge O, Boudet AM, Grima-Pettenati J: Cinnamoyl CoA reductase,
the first committed enzyme of the lignin branch biosynthetic pathway:
cloning, expression and phylogenetic relationships. Plant J 1997,
11:429–441.
Goujon T, Sibout R, Pollet B, Maba B, Nussaume L, Bechtold N, Lu F, Ralph J,
Mila I, Barrière Y, Lapierre C, Jouanin L: A new arabidopsis thaliana mutant
deficient in the expression of O-methyltransferase impacts lignins and
sinapoyl esters. Plant Mol Biol 2003, 51:973–989.
Berthet S, Demont-Caulet N, Pollet B, Bidzinski P, Cézard L, Le Bris P,
Borrega N, Hervé J, Blondet E, Balzergue S, Lapierre C, Jouanin L: Disruption
of LACCASE4 and 17 results in tissue-specific alterations to lignification
of Arabidopsis thaliana stems. Plant Cell 2011, 23:1124–1137.
Li J, Ou-Lee TM, Raba R, Amundson RG, Last RL: Arabidopsis flavonoid
mutants are hypersensitive to UV-B irradiation. Plant Cell 1993, 5:171–179.
Page 16 of 17
40. Wang JP, Naik PP, Chen H-C, Shi R, Lin C-Y, Liu J, Shuford CM, Li Q, Sun Y-H,
Tunlaya-Anukit S, Williams CM, Muddiman DC, Ducoste JJ, Sederoff RR, Chiang
VL: Complete proteomic-based enzyme reaction and inhibition kinetics
reveal how monolignol biosynthetic enzyme families affect metabolic flux
and lignin in populus trichocarpa. Plant Cell 2014, 26:894–914.
41. Cook CM, Daudi A, Millar DJ, Bindschedler LV, Khan S, Bolwell GP, Devoto A:
Transcriptional changes related to secondary wall formation in xylem of
transgenic lines of tobacco altered for lignin or xylan content which
show improved saccharification. Phytochemistry 2012, 74(null):79–89.
42. Dixon RA, Paiva NL: Stress-induced phenylpropanoid metabolism. Plant
Cell 1995, 7:1085–1097.
43. Harbone J: The Flavonoids: Advances in Research Since 1980. Chapman Hall:
Springer; 1988:621–624.
44. Holton TA, Cornish EC: Genetics and biochemistry of anthocyanin
biosynthesis. Plant Cell 1995, 7:1071–1083.
45. Salazar MM, Nascimento LC, Camargo EL, Gonçalves DC, Lepikson-Neto J,
Marques WL, Teixeira PJ, Mieczkowski P, Mondego JM, Carazzolle MF,
Deckmann AC, Pereira GA: Xylem transcription profiles indicate potential
metabolic responses for economically relevant characteristics of
Eucalyptus species. BMC Genomics 2013, 14:201.
46. Tognetti VB, Van Aken O, Morreel K, Vandenbroucke K, van de Cotte B,
De Clercq I, Chiwocha S, Fenske R, Prinsen E, Boerjan W, Genty B,
Stubbs KA, Inzé D, Van Breusegem F: Perturbation of indole-3-butyric
acid homeostasis by the UDP-glucosyltransferase UGT74E2 modulates
Arabidopsis architecture and water stress tolerance. Plant Cell 2010,
22:2660–2679.
47. Lim E-K, Jackson RG, Bowles DJ: Identification and characterisation of
Arabidopsis glycosyltransferases capable of glucosylating coniferyl
aldehyde and sinapyl aldehyde. FEBS Lett 2005, 579:2802–2806.
48. Peterbauer T, Mucha J, Mach L, Richter A: Chain Elongation of raffinose in
pea seeds. Isolation, characterization, and molecular cloning of
mutifunctional enzyme catalyzing the synthesis of stachyose and
verbascose. J Biol Chem 2002, 277:194–200.
49. Chua TK, Bujnicki JM, Tan T-C, Huynh F, Patel BK, Sivaraman J: The structure
of sucrose phosphate synthase from Halothermothrix orenii reveals its
mechanism of action and binding mode. Plant Cell 2008, 20:1059–1072.
50. Chen F, Dixon RA: Lignin modification improves fermentable sugar yields
for biofuel production. Nat Biotechnol 2007, 25:759–761.
51. Inoue H, Yano S, Endo T, Sakaki T, Sawayama S: Combining hot-compressed
water and ball milling pretreatments to improve the efficiency of the
enzymatic hydrolysis of eucalyptus. Biotechnol Biofuels 2008, 1:2.
52. Saravitz DM, Pharr DM, Carter TE: Galactinol synthase activity and soluble
sugars in developing seeds of four soybean genotypes. Plant Physiol
1987, 83:185–189.
53. Taji T, Ohsumi C, Iuchi S, Seki M, Kasuga M, Kobayashi M, YamaguchiShinozaki K, Shinozaki K: Important roles of drought- and cold-inducible
genes for galactinol synthase in stress tolerance in Arabidopsis thaliana.
Plant J 2002, 29:417–426.
54. Nishizawa A, Yabuta Y, Shigeoka S: Galactinol and raffinose constitute a
novel function to protect plants from oxidative damage. Plant Physiol
2008, 147:1251–1263.
55. Unda F, Canam T, Preston L, Mansfield SD: Isolation and characterization
of galactinol synthases from hybrid poplar. J Exp Bot 2012, 63:2059–2069.
56. Rubin G, Tohge T, Matsuda F, Saito K, Scheible W-R: Members of the
LBD family of transcription factors repress anthocyanin synthesis and
affect additional nitrogen responses in Arabidopsis. Plant Cell 2009,
21:3567–3584.
57. Sarruje J: Soluções nutritivas. Summa Phytopathol 1975, 1:231–233.
58. Zeng Y, Yang T: RNA isolation from highly viscous samples rich in
polyphenols and polysaccharides. Plant Mol Biol Rep 2002, 20:417–417.
59. Le Provost G, Paiva J, Pot D, Brach J, Plomion C: Seasonal variation in
transcript accumulation in wood-forming tissues of maritime pine (Pinus
pinaster Ait.) with emphasis on a cell wall glycine-rich protein. Planta
2003, 217:820–830.
60. Quail MA, Kozarewa I, Smith F, Scally A, Stephens PJ, Durbin R, Swerdlow H,
Turner DJ: A large genome center’s improvements to the Illumina
sequencing system. Nat Methods 2008, 5:1005–1010.
61. Pruesse E, Quast C, Knittel K, Fuchs BM, Ludwig W, Peplies J, Glöckner FO:
SILVA: a comprehensive online resource for quality checked and aligned
ribosomal RNA sequence data compatible with ARB. Nucleic Acids Res
2007, 35:7188–7196.
Lepikson-Neto et al. BMC Plant Biology 2014, 14:301
/>
Page 17 of 17
62. Myburg AA, Grattapaglia D, Tuskan GA, Hellsten U, Hayes RD, Grimwood J,
Jenkins J, Lindquist E, Tice H, Bauer D, Goodstein DM, Dubchak I, Poliakov A,
Mizrachi E, Kullan ARK, Hussey SG, Pinard D, van der Merwe K, Singh P, van
Jaarsveld I, Silva-Junior OB, Togawa RC, Pappas MR, Faria DA, Sansaloni CP,
Petroli CD, Yang X, Ranjan P, Tschaplinski TJ, Ye C-Y, et al: The genome of
Eucalyptus grandis. Nature 2014, 509:356–362.
63. Trapnell C, Pachter L, Salzberg SL: TopHat: discovering splice junctions
with RNA-Seq. Bioinformatics 2009, 25:1105–1111.
64. Koski LB, Gray MW, Lang BF, Burger G: AutoFACT: an automatic functional
annotation and classification tool. BMC Bioinformatics 2005, 6:151.
65. Altschul SF, Madden TL, Schäffer AA, Zhang J, Zhang Z, Miller W, Lipman DJ:
Gapped BLAST and PSI-BLAST: a new generation of protein database
search programs. Nucleic Acids Res 1997, 25:3389–3402.
66. Suzek BE, Huang H, McGarvey P, Mazumder R, Wu CH: UniRef:
comprehensive and non-redundant UniProt reference clusters.
Bioinformatics 2007, 23:1282–1288.
67. Kanehisa M: KEGG: kyoto encyclopedia of genes and genomes. Nucleic
Acids Res 2000, 28:27–30.
68. Conesa A, Götz S, García-Gómez JM, Terol J, Talón M, Robles M: Blast2GO: a
universal tool for annotation, visualization and analysis in functional
genomics research. Bioinformatics 2005, 21:3674–3676.
69. Thimm O, Bläsing O, Gibon Y, Nagel A, Meyer S, Krüger P, Selbig J, Müller
LA, Rhee SY, Stitt M: MAPMAN: a user-driven tool to display genomics
data sets onto diagrams of metabolic pathways and other biological
processes. Plant J 2004, 37:914–939.
70. Mortazavi A, Williams BA, McCue K, Schaeffer L, Wold B: Mapping and
quantifying mammalian transcriptomes by RNA-Seq. Nat Methods 2008,
5:621–628.
71. Phillips CM, Iavarone AT, Marletta MA: Quantitative proteomic approach
for cellulose degradation by Neurospora crassa. J Proteome Res 2011,
10:4177–4185.
72. Bragatto J, Segato F, Cota J, Mello DB, Oliveira MM, Buckeridge MS, Squina
FM, Driemeier C: Insights on how the activity of an endoglucanase is
affected by physical properties of insoluble celluloses. J Phys Chem B
2012, 116:6128–6136.
73. Miller G: Use of dinitrosalicylic acid reagent for determination of
reducing sugar. Analytical chemistry. Anal Chem 1959, 31:426–428.
doi:10.1186/s12870-014-0301-8
Cite this article as: Lepikson-Neto et al.: Flavonoid supplementation
affects the expression of genes involved in cell wall formation and
lignification metabolism and increases sugar content and
saccharification in the fast-growing eucalyptus hybrid E. urophylla x E.
grandis. BMC Plant Biology 2014 14:301.
Submit your next manuscript to BioMed Central
and take full advantage of:
• Convenient online submission
• Thorough peer review
• No space constraints or color figure charges
• Immediate publication on acceptance
• Inclusion in PubMed, CAS, Scopus and Google Scholar
• Research which is freely available for redistribution
Submit your manuscript at
www.biomedcentral.com/submit