Distinct transcriptional profiles of ozone stress in soybean (Glycine max) flowers and pods
Bạn đang xem bản rút gọn của tài liệu. Xem và tải ngay bản đầy đủ của tài liệu tại đây (1.38 MB, 13 trang )
Leisner et al. BMC Plant Biology 2014, 14:335
/>
RESEARCH ARTICLE
Open Access
Distinct transcriptional profiles of ozone stress in
soybean (Glycine max) flowers and pods
Courtney P Leisner1, Ray Ming1 and Elizabeth A Ainsworth1,2*
Abstract
Background: Tropospheric ozone (O3) is a secondary air pollutant and anthropogenic greenhouse gas.
Concentrations of tropospheric O3 ([O3] have more than doubled since the Industrial Revolution, and are high
enough to damage plant productivity. Soybean (Glycine max L. Merr.) is the world’s most important legume crop
and is sensitive to O3. Current ground-level [O3] are estimated to reduce global soybean yields by 6% to 16%. In
order to understand transcriptional mechanisms of yield loss in soybean, we examined the transcriptome of
soybean flower and pod tissues exposed to elevated [O3] using RNA-Sequencing.
Results: Elevated [O3] elicited a strong transcriptional response in flower and pod tissues, with increased expression of
genes involved in signaling in both tissues. Flower tissues also responded to elevated [O3] by increasing expression of
genes encoding matrix metalloproteinases (MMPs). MMPs are zinc- and calcium-dependent endopeptidases that have
roles in programmed cell death, senescence and stress response in plants. Pod tissues responded to elevated [O3] by
increasing expression of xyloglucan endotransglucosylase/hydrolase genes, which may be involved with increased pod
dehiscence in elevated [O3].
Conclusions: This study established that gene expression in reproductive tissues of soybean are impacted by elevated
[O3], and flowers and pods have distinct transcriptomic responses to elevated [O3].
Keywords: Oxidative stress, Glycine max, RNA-Sequencing, Matrix metalloproteinases, Cell wall modification
Background
Current tropospheric O3 concentrations ([O3]) are estimated to cost $14 to $26 billion in annual global crop
economic losses [1] and severely impact human health,
accounting for an estimated 0.7 million deaths per year
[2]. Ozone in the troposphere is formed through the
photochemical oxidation of volatile organic compounds
(VOCs), carbon monoxide and methane in the presence
of nitrogen oxides (NOx) [3]. Ozone is a dynamic pollutant and concentrations vary temporally and spatially,
with higher concentrations in the Northern Hemisphere
compared to the Southern Hemisphere, and typically
higher [O3] in the summer compared to the winter [3].
Background tropospheric [O3] have more than doubled
since the Industrial Revolution and are projected to increase by an additional ~20% by the year 2100 if current
* Correspondence:
1
Department of Plant Biology, University of Illinois, Urbana-Champaign,
Urbana, IL 61801, USA
2
USDA ARS Global Change and Photosynthesis Research Unit, 1201 W.
Gregory Drive, Urbana, IL 61801, USA
high emission rates continue [4]. In the crop growing
regions of the Northern Hemisphere, summer concentrations of O3 often exceed 40 ppb, which exceeds the
critical threshold for damage to sensitive crops, including soybean (Glycine max) [5].
When taken up by plants, O3 is converted into other
reactive oxygen species (ROS), and can induce signaling
pathways that lead to programmed cell death, especially
with exposure to very high [O3] [6]. At lower concentrations, chronic exposure to elevated [O3] decreases
photosynthetic carbon assimilation and stomatal conductance, and accelerates the process of senescence
[7,8]. In addition to leaf-level effects, O3 negatively impacts plant fitness and reproductive development, which
can be mediated through reduced carbon allocation
from source tissues and/or through direct effects on reproductive tissues [9,10]. A meta-analysis of published
studies from 1968 to 2010 of O3 effects on plant reproductive processes reported that exposure to elevated
[O3] decreased seed number and seed size, as well as
fruit number and fruit size when compared to plants
© 2014 Leisner et al.; licensee BioMed Central Ltd. This is an Open Access article distributed under the terms of the Creative
Commons Attribution License ( which permits unrestricted use, distribution, and
reproduction in any medium, provided the original work is properly credited. The Creative Commons Public Domain
Dedication waiver ( applies to the data made available in this article,
unless otherwise stated.
Leisner et al. BMC Plant Biology 2014, 14:335
/>
grown in charcoal-filtered, O3-free air [11]. However, the
meta-analysis also showed that elevated [O3] did not significantly alter inflorescence number, flower weight or
flower number [11]. This suggests that plants can compensate to some extent from O3 damage [12], and also
that the effects of O3 can be tissue-specific.
Soybeans have naturally high levels of floral and pod
loss, and subsequent seed and yield loss is greatest when
stress occurs during flower and early pod development
[13]. Flower and pod abscission can range from 32 to
82% in soybean [14-16], but this varies considerably with
Page 2 of 13
location on the plant [15-17], location in the canopy
[18], source-sink relations [19], hormone levels [13,20,21],
shade [22] and water status [13,23,24]. Ethylene promotes
flower and pod abscission in soybean [25], and elevated
[O3] can increase ethylene emission in plants [26].
Therefore, elevated [O3] has the potential to increase
flower and pod abscission. In field-grown soybean exposed to elevated [O3] for an entire growing season
[27], pod production was decreased by elevated [O3],
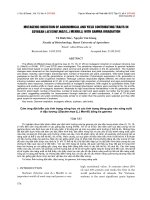
but flower number was not affected (Figure 1). Based on
this evidence from the field, it is hypothesized that the
Figure 1 The effect of O3 on the number of flowers and pods produced per node in field-grown soybean. (a) Linear regression of the
average number of pods per node for soybean plants grown under eight [O3] at the SoyFACE facility ( in
Champaign, Illinois in 2009 and 2010. Blue lines show the 95% confidence intervals. Experimental design, planting conditions, meteorological data
and harvesting methods are found in [27]. (b) Average flower number per node for soybean plants grown under ambient (44 ppb) and elevated
(100 ppb) [O3] at the SoyFACE facility in 2011. Flower number per node was monitored daily for five plants per ambient and elevated [O3] plot
(n = 2 for ambient, n = 4 for elevated [O3]).
Leisner et al. BMC Plant Biology 2014, 14:335
/>
transcriptional responses of soybean flowers and pods
to elevated [O3] would be distinct.
Previous studies have examined changes in transcript
abundance in plants in response to elevated [O3] [6,28-35];
however, most of these studies have focused on leaves. In
soybean, both flower and pod tissues also have stomata
through which O3 could enter and elicit a signaling response [36,37]. Next-generation sequencing technology
allows examination of changes to the entire transcriptome,
which could facilitate interpretation of the complex phenotypes that underpin O3 response in plants. By investigating how elevated [O3] affects the transcriptome of
reproductive tissues, we can begin to understand the distinct responses in different tissues and identify potential
targets for improving tolerance. Therefore, in this study,
the transcriptome of flower and pod tissue from chambergrown soybean plants at ambient (<20 ppb) and elevated
[O3] (150 ppb) was investigated. Both flower and pod tissues showed significant transcriptomic responses to elevated [O3]. While 277 transcripts were responsive to
elevated [O3] in both tissues, most of those transcripts did
not change in the same direction or at the same magnitude
in flowers and pods, indicating that the transcriptional response to O3 in different reproductive tissues was distinct.
Results and discussion
Overlapping effects of elevated [O3] on the transcriptome
of flower and pod tissue in soybean
Flower and pod development in soybean are sensitive
to environmental stress [23,24,38,39], and elevated [O3]
significantly impacted pod production, but not flower
production (Figure 1). In order to identify the genetic
mechanisms underpinning O3 response in soybean pods
and flowers, the transcriptome of flower and pod tissues
was compared using RNA-Sequencing (RNA-Seq). The
global transcriptional analysis showed the magnitude of
potential responses to elevated [O3] in flowers and pods
was similar, with genes showing approximately the same
range of both mean expression values in flowers and
pods, and similar potential log fold change responses to
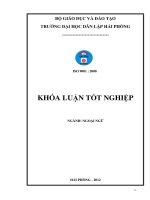
elevated [O3] in the two tissues (Figure 2). However,
more than three times as many genes were differentially
expressed in flower tissue (4,595 genes) than in pod tissue (1,375 genes; Figure 3) in response to elevated [O3],
and only 277 of those genes were differentially expressed
in both flowers and pods (Figure 3).
Differentially expressed genes in pods and flowers
were grouped into functional categories (Figure 4). Nine
of 15 total functional categories showed pod and flower
genes changing in the same direction in response to elevated [O3] (Figure 4). Transcripts involved in signaling,
development, transport, stress, protein and RNA were
expressed at greater levels on average in both pods and
flowers exposed to elevated [O3] compared to control
Page 3 of 13
Figure 2 Comparison of differential gene expression in flower
and pod tissue under elevated [O3]. The log fold change for all
genes differentially expressed in flower and pod tissue (p <0.05) was
plotted against the mean expression value for that gene measured
in both ambient and elevated [O3]. Black circles represent genes
differentially expressed in flowers and red circles represent genes
differentially expressed in pods. Green triangles represent MMP
genes differentially expressed in flowers. Yellow squares represent
XTH genes differentially expressed in pods. Reference line represents
a log fold change of zero. Values above the reference line are genes
increased in abundance compared to ambient [O3] and values
below the reference line are genes decreased in abundance
compared to ambient [O3].
(Figure 4). While average changes in expression based
on functional categories suggests that there was overlap
in the transcriptional response of flowers and pods to
elevated [O3], investigation of individual genes showed
that there was not good correspondence of the direction
or magnitude of the response (Figure 5). Less than half
of the 277 genes that were significantly affected by elevated [O3] in both flowers and pods responded in a similar direction, with 78 of the 277 genes increasing in both
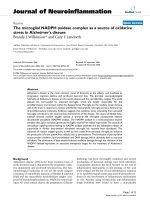
Figure 3 Venn diagram of differentially expressed genes in
flower and pod tissues in response to elevated [O3]. Numbers of
genes that were differentially expressed in response to elevated [O3]
in flowers (green), pods (purple) and in both tissues (overlapping).
Leisner et al. BMC Plant Biology 2014, 14:335
/>
Page 4 of 13
0.8
Average log fold-change
0.6
0.4
0.2
0.0
-0.2
-0.4
Flower
Pod
Signaling
Development
Stress
Transport
Protein
RNA
Cell
Miscellaneous enzyme families
Not assigned
Hormone metabolism
DNA
Redox
Amino acid metabolism
Nucleotide metabolism
Major Carbohydrates
-0.6
Figure 4 Average fold change of genes differentially expressed in both flowers and pods in response to elevated [O3]. Average log fold
change of all genes within a functional category that significantly responded to elevated [O3] in both flowers (black bars) and pods (red bars). A
positive log fold change indicates increased abundance in elevated [O3] compared to ambient [O3], while a negative log fold change indicates
decreased abundance in elevated [O3].
Figure 5 Comparison of expression changes in response to elevated [O3] in soybean flowers and pods. The log fold change of the 277
individual genes significantly changing in response to elevated [O3] in both pods vs. flowers is shown. Functional groups are represented by
different symbols/colors. The 1:1 line represents genes that have the same direction of fold change in flower and pod tissue.
Leisner et al. BMC Plant Biology 2014, 14:335
/>
tissues in response to elevated [O3] and 33 decreasing in
both tissues in response to elevated [O3] (Figure 5).
Many of the transcripts that fell on the 1:1 line in
Figure 5 were involved in signaling and RNA processing,
including 12 leucine-rich repeat receptor-like kinases
(RLKs) and 3 cysteine-rich Domain of Unknown Function 26 (DUF26) RLKs (also known as cysteine-rich
receptor-like kinases, CRK). Plant RLKs are transmembrane proteins involved in signal perception and form a
large multi-gene family with regulatory roles in development, abiotic and biotic stress responses in plants
[40,41]. Recent analysis of the response of Arabidopsis
DUF26 RLKs showed that many of the 44 RLKs were
specifically up-regulated in response to O3 stress in
leaves [42], including DUF26 30 (CRK 26), DUF26 29
(CRK 29) and DUF26 41 (CRK 2), which also had a
significant increase in expression in soybean pods and
flowers exposed to elevated [O3]. Wraczek et al. [42]
found that the general pattern of DUF26 expression responses to O3 was most similar to the transcriptional response to pathogen infection, which like O3 elicits an ROS
burst in the apolost. The transcriptional response to O3
however, was very different from expression responses to
high light treatments or chemical treatments that increased ROS production in chloroplasts or mitochondria
[42]. Thus, it was further suggested that the DUF26 domain, which has a conserved cysteine motif C-8X-C-2X-C,
could act as an apolastic ROS sensor [42].
A number of WRKY domain transcription factors also
showed significantly greater expression under elevated
[O3] in both soybean flowers and pods (Glyma04g40130,
Glyma06g14720, Glyma14g36430, Glyma14g36438, Glyma14g36446). The WRKY transcription factor family is
one of the largest families of transcription factors in
plants, with 133 members in the soybean genome [43].
WRKYs function in many plant processes including response to biotic and abiotic stresses, and senescence
[44]. Up-regulation of WRKY transcription factors in response to O3 stress has been previous reported, primarily in the leaves of trees [45-47]. Two of the WRKY
transcription factors with increased expression in both
flower and pod tissues in response to elevated [O3] (Glyma04g40130 and Glyma06g14720) were likely formed
through a segmental duplication event that is estimated
to have occurred 20 million years ago [43].
Distinct effects of elevated [O3] on the transcriptome of
flower and pod tissue in soybean
Although there was some overlap in transcriptional responses to elevated [O3] in flowers and pods, the vast
majority of genes changing in either tissue were distinct
(Figure 3), and even among the genes that were expressed
in both flower and pod tissues, the fold changes in expression were of different magnitudes or in the opposite
Page 5 of 13
direction (Figure 5). In flower tissue, the genes with the
greatest increase in abundance in response to elevated
[O3] included matrix metalloproteinase (MMP) genes
and genes related to hormone metabolism and signaling
(Table 1). Genes annotated as MMPs also had high mean
expression levels (Figure 2). While little is known about
their role in soybean flowers, in other tissues MMPs function in degradation of the extracellular matrix (ECM) in
response to senescence, stress and programmed cell death
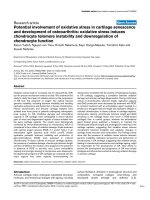
[48-51]. Domain analysis indicated that 7 of the 9 differentially expressed genes annotated as MMPs had both a
cysteine switch domain and a zinc-binding domain, both
of which are required for characterization as a MMP
(Figure 6) [52-54]. Those genes with both required domains were termed putative soybean flower MMP genes.
The putative MMP gene Glyma02g03301 had two identical cysteine switch domains and zinc-binding domains,
which was unique compared to the other putative flower
MMP genes. All putative flower MMP genes had a signal
peptide and transmembrane domain, with the exception
of Glyma02g03250 (Figure 6; Additional file 1). Several of
the putative flower MMP genes contained a GPI-anchor
modification site, which was similar to 3 Arabidopsis
MMP genes, At2-MMP, At4-MMP, At5-MMP [47], and
the known soybean MMP gene GmMMP2 (referred to as
Gm2-MMP) [42] (Figure 6). None of the putative flower
MMP genes or known soybean genes (Gm2-MMP or
SMEP1) [48,55,56] contained a furin cleavage site, which
was present in several Arabidopsis MMP genes. When
amino acid sequence similarity identity was compared between all putative flower MMP genes and Gm2-MMP using
Clustal W ( />page=/NPSA/npsa_server.html), little homology between
the flower MMP and leaf MMP genes was found, with the
exception of Glyma01g04350 which showed 99% sequence
similarity to Gm2-MMP (data not shown). All putative
flower MMP genes, with the exception of Glyma01g04350,
had an E (glutamate) to Q (glutamine) residue substitution
in the zinc-binding motif of the catalytic domain, which
has been identified in other legume species [51]. The
glutamate residue is required for functional protease activity [57], thus the amino acid switch in soybean flower
MMPs may render these inactive. Still, they may be important for O3 stress response because experiments with
Medicago truncatula have also demonstrated a functional role for proteolytically-inactive MMPs in biotic
stress response [51].
The responsiveness of putative soybean flower MMPs
to elevated [O3] is consistent with the ECM being the
primary point of O3 contact within plant cells and the
location where antioxidant metabolism begins to protect
cells from ROS damage [34,58]. Stress-responsive signaling pathways, including jasmonic acid, salicylic acid
and ethylene-dependent redox signaling are all triggered
Leisner et al. BMC Plant Biology 2014, 14:335
/>
Page 6 of 13
Table 1 Genes with the greatest log fold change in response to elevated [O3] in flower tissues
Gene
p- value
Log fold change
Functional group
Description
Glyma02g03250
0.018
2.63
Protein
Matrixin family protein
Glyma02g03301
0.019
2.51
Protein
Matrixin family protein
Glyma02g03320
0.023
2.43
Protein
Matrixin family protein
Glyma02g03230
0.021
2.42
Protein
Matrixin family protein
Glyma01g04370
0.024
2.37
Protein
Matrixin family protein
Glyma0420s50
0.024
2.32
Protein
Matrix metalloproteinase
Glyma02g03335
0.028
2.32
Protein
Matrix metalloproteinase
Glyma02g03280
0.026
2.14
NA
NA
Glyma02g03210
0.019
2.12
Protein
Matrix metalloproteinase
Glyma16g01990
0.019
2.09
Hormone metabolism
2-oxoglutarate (2OG) and Fe(II)-dependent oxygenase superfamily protein
Glyma07g32650
0.042
1.93
Protein
Cysteine proteinases superfamily protein
Glyma12g02410
0.024
1.83
Miscellaneous
Glycosyl hydrolase superfamily protein
Glyma01g04350
0.029
1.69
Protein
Matrix metalloproteinase
Glyma07g05420
0.017
1.67
Hormone metabolism
2-oxoglutarate (2OG) and Fe(II)-dependent oxygenase superfamily protein
Glyma08g21321
0.024
1.47
Signaling
Leucine-rich repeat receptor-like protein kinase
Glyma13g41330
0.015
1.46
Transport
ZIP Zinc transporter
Glyma15g04090
0.014
1.40
Transport
ZIP Zinc transporter
Glyma12g31250
0.028
1.37
NA
NA
Glyma16g28510
0.046
1.37
Signaling
Leucine-rich repeat receptor-like protein kinase
Glyma07g28940
0.038
1.33
Cell wall
BURP domain-containing protein
Glyma16g28530
0.030
1.32
Signaling
Leucine-rich repeat receptor-like protein kinase
Glyma14g37946
0.023
1.29
Cell
Exocyst subunit exo70 family protein B1
Glyma02g09181
0.041
1.27
Signaling
Leucine-rich repeat receptor-like protein kinase
Glyma16g28460
0.044
1.26
Signaling
Leucine-rich repeat receptor-like protein kinase
Glyma12g31280
0.025
1.21
NA
NA
‘NA’ indicated genes not assigned an annotation. FDR-adjusted p-values are shown.
by the redox sensing that occurs in the ECM [34]. The
soybean MMP gene Gm2-MMP was up-regulated consistently with the release of ROS during pathogenic infection [50], possibly linking ROS signaling and MMP
gene expression in soybean stress response. Previous
analysis of Arabidopsis MMP gene expression revealed
that At3-MMP was expressed at greater abundance in
response to O3 treatment, with a slight increase in At2MMP in response to O3 as well [59]. While the putative
MMP genes are present in high abundance in flower tissues exposed to elevated [O3], analysis of the expression
profiles of the putative MMP genes in soybean using
RNA-Seq Atlas ( found that
these genes were not present, or present in low abundance in other soybean tissues. Therefore, it is hypothesized that the increase in abundance of the putative
MMP genes identified in this study may represent a distinct flower response to O3 stress in soybean.
In pod tissue, cell wall modification and calcium signaling genes showed the greatest increase in abundance
in response to elevated [O3] (Table 2). Gene ontology
(GO) enrichment analysis of biological processes was
performed for genes differentially expressed only in pod
tissue. Apoptosis, signal transduction, ATP biosynthetic
processes, cellular glucan metabolic processes, protein
amino acid phosphorylation and innate immune responses were enriched in pod tissue (Additional file 2).
These activities are known to increase in plants in response to both abiotic and biotic stress [60-65], and the
possibility that O3 stress co-opts pathways involved in
biotic stress response has been previously proposed
[66,67]. The genes with the greatest increase in abundance in response to elevated [O3] were xyloglucan
endotransglucosylase/hydrolase family proteins (XTH)
(Table 2). Genes annotated as XTHs also had high mean
expression, along with the greatest increase in abundance in response to O3 in pod tissue (Figure 2). These
genes belong to the GO biological process of cellular
glucan metabolic processes, which is highly enriched in
pod tissues (Figure 7). Analysis of the putative XTH
Leisner et al. BMC Plant Biology 2014, 14:335
/>
Page 7 of 13
Figure 6 Domain analysis of plant matrix metalloproteinase (MMP) genes. General structure of known plant MMPs and putative MMPs
identified in soybean flowers. The cysteine switch and zinc binding domain sequence motifs are shown for all genes (when present). The E to Q
residue substitution in the zinc-binding motif of the catalytic domain is indicated in red.
genes in soybean using RNA-Seq Atlas (http://soybase.
org/soyseq/) showed that these genes were not present
or in low abundance in other tissues, indicating that
these genes may represent a distinct pod response to
elevated [O3].
XTH is a well-known cell wall-modifying enzyme that
plays a role in growth and differentiation in plants [68].
Genes in the XTH family are involved in cell elongation
in vascular cells [69,70], epidermal cells [71], inflorescence apices [72], primary roots [73] and during somatic
embryogenesis [74]. XTH also plays a role in floral
organ abscission [75,76]. Due to the similarity of flower
abscission and pod dehiscence zone [77] and the known
response of XTH genes to oxidative [78], water [79] and
biotic stress [80], it is hypothesized that XTH genes may
play a role in pod dehiscence in soybean exposed to elevated [O3].
Conclusion
Soybean is an O3-sensitive crop, with current tropospheric [O3] costing billions of dollars in lost production
annually. In this study, it was established that gene expression in reproductive tissues in soybean is altered by
elevated [O3]. There were 4,703 transcripts responsive to
elevated [O3] in both flower and pod tissues, yet those
genes did not respond consistently in the two tissues.
This indicates that reproductive tissues have more distinct than similar transcriptomic responses to elevated
[O3]. Flower tissues responded to elevated [O3] through
increased expression of MMP genes. It was notable that
these flower MMP genes may not be proteolytically
active based on amino acid composition, but they clearly
respond to O3 stress. Pod tissues responded to elevated [O3] through increased expression of cell expansion
genes. The increased transcript abundance of XTH
Leisner et al. BMC Plant Biology 2014, 14:335
/>
Page 8 of 13
Table 2 Genes with the greatest log fold change in response to elevated [O3] in pod tissues
Gene
p- value
Log2 fold change
Functional group
Description
Glyma17g07260
0.043
2.91
Cell wall
Xyloglucan endotransglucosylase/hydrolase family protein
Glyma17g07240
0.043
2.91
Cell wall
Xyloglucan endotransglucosylase/hydrolase family protein
Glyma13g01120
0.035
2.83
Cell wall
Xyloglucan endotransglucosylase/hydrolase family protein
Glyma17g07250
0.043
2.55
Cell wall
Xyloglucan endotransglucosylase/hydrolase family protein
Glyma17g07280
0.046
2.52
Cell wall
Xyloglucan endotransglucosylase/hydrolase family protein
Glyma01g03005
0.022
2.45
NA
NA
Glyma13g01131
0.038
2.36
Cell wall
Xyloglucan endotransglucosylase/hydrolase family protein
Glyma13g01140
0.042
2.33
Cell wall
Xyloglucan endotransglucosylase/hydrolase family protein
Glyma17g07220
0.039
2.32
Cell wall
Xyloglucan endotransglucosylase/hydrolase family protein
Glyma06g10700
0.043
2.23
Signaling
Phosphate-responsive 1 family protein
Glyma06g11700
0.038
2.20
RNA
AP2 domain
Glyma13g01110
0.043
2.20
Cell wall
Xyloglucan endotransglucosylase/hydrolase family protein
Glyma17g07270
0.043
2.13
Cell wall
Xyloglucan endotransglucosylase/hydrolase family protein
Glyma12g31150
0.050
2.09
Development
No apical meristem (NAM) protein
Glyma18g03066
0.026
2.06
Signaling
Leucine-rich repeat receptor-like protein kinase
Glyma13g05090
0.026
2.02
NA
NA
Glyma10g37510
0.014
2.02
Transport
Heavy metal associated protein
Glyma13g35950
0.027
2.00
Signaling
Calcium-binding EF hand family protein
Glyma08g04920
0.017
1.99
Signaling
Calcium binding protein-like
Glyma11g35334
0.022
1.96
Protein
Leucine-rich repeat receptor-like protein kinase
Glyma12g01420
0.021
1.95
Stress
NB-ARC domain-containing disease resistance protein
Glyma10g37500
0.021
1.94
NA
Heavy metal associated protein
Glyma14g22970
0.043
1.92
RNA
AP2 domain
Glyma12g34580
0.017
1.91
Signaling
Calcium-binding EF-hand family protein
Glyma02g04620
0.027
1.90
Transport
Mitochondrial carrier protein
‘NA’ indicated genes not assigned an annotation. FDR-adjusted p-values are shown.
genes supports a role of these genes in pod dehiscence
in soybean exposed to elevated [O3].
Plants were rotated among chambers once a week and
within chambers every two days to minimize chamber
effects.
Methods
Growth chamber experimental design and conditions
Tissue sampling and molecular analyses
Soybean (Glycine max L. Merr. cv. 93B15; Pioneer HiBreed) was grown in ambient air (<20 ppb) and elevated
ozone (150 ppb) in 14 h/10 h day/night schedules under
PPFD of ~650-750 μmol m−2 s−1; RH 60%; 25°C day/21°C
night conditions in 8 growth chambers (Conviron,
Winnipeg, Manitoba, Canada). Soybean plants were
grown in 6-L pots (Classic C600, Nursery Supplies,
Chambersburg PA, USA) in sterilized soil (LC-1 Sunshine
Mix (SunGro Horticulture Canada Ltd, Bellevue, WA,
USA)) and treated with 50% Long Ashton solution
supplemented with 3 mM NH4NO3 [81]. Two seeds
were planted per pot ~4 cm below the soil surface and
then thinned to one plant per pot once seeds successfully germinated. A total of 12 plants were grown per
chamber in a randomized complete block design (n = 4).
Tissue sampling for RNA was done during R2 (full
bloom) and R4 (full pod) for growth chamber grown
plants. Plants were considered at full bloom when there
was an open flower at one of the first two uppermost
nodes with a fully expanded leaf. Plants were considered
at full pod when there was a pod 2 cm in length present
on one of the four uppermost nodes with a fully expanded leaf. At each stage the appropriate tissue was
sampled (full open flowers at R2 and initiating pods at
R4). Sampling was done at the nodes 2–4 (from the top
of the plant) in order to avoid compensation and senescence effects on the upper and lowermost nodes. Tissue
from four plants was sampled per developmental stage
per block. Immediately after collection flower and pod
tissue was plunged into liquid N and stored at −80°C.
Leisner et al. BMC Plant Biology 2014, 14:335
/>
Page 9 of 13
Figure 7 Analysis of gene ontology (GO) term enrichment of biological processes containing XTH genes in pod tissues. Biological terms
with increasing overrepresentation in pod tissues exposed to elevated [O3] are represented by increasingly red colors. GO term enrichment was
performed using single enrichment analysis (SEA) tool on AgriGo ( />
Flower or pod tissue was ground to a fine power using a
mortar and pestle.
Total RNA was extracted from ground tissue using PureLink Plant RNA Reagent (Ambion, by Life Technologies
Corp., Grand Island, NY, USA) according to the manufacturer’s protocol. RNA quantity was determined with
a spectrophotometer (Nanodrop 1000, Thermo Fischer
Scientific, Waltham, MA, USA) and RNA quality was
Leisner et al. BMC Plant Biology 2014, 14:335
/>
assessed using the Agilent 2100 Bioanalyzer (Agilent
Technologies, Santa Clara, CA, USA) on an RNA Nano
chip. Genomic DNA contamination was removed from
RNA samples using Turbo DNase treatment (Applied
Biosystems/Ambion, Austin, TX, USA) according to the
manufacturer’s protocol. cDNA library preparation was
done using the Illumnina TruSeq Sample Prep kits (Illumina
Inc. San Diego, CA, USA). Each library fragment was barcoded during library preparation and multiplexed for sequencing. Tissue samples per block (4 subsamples) were
pooled for a total of 8 libraries prepared for each tissue
(16 libraries total).
RNA-sequencing (RNA-seq), bioinformatics and statistical
analysis
Sequencing was done at the Roy J. Carver Biotechnology
Center using the Illumina Genome HiSeq 2000 (Illumina
Inc. San Diego, CA, USA, ) and
Cassava pipeline 1.8 to obtain 100 nt single-end reads.
Samples were sequenced in groups of 4 across 4 lanes
and generated ~31-63 million reads per sample. All
FASTQ files from all sequencing runs are located in the
Small Read Archive ( />SRP035871, BioProject number PRJNA236472. Quality
control for reads generated from sequencing was performed
using FastQC ( />projects/fastqc/). Sequenced reads were aligned to the soybean reference genome (Gmax_189.fa, www.phytozome.
net) using Bowtie [82]. All valid alignments per read were
reported allowing up to three mismatches. Alignment
summary statistics are presented in Additional file 3.
Aligned sequence reads and a list of genomic features
(Gmax_189_gene.gff3, www.phytozome.net) were input
into HTSeq to generate read counts using the htseq-count
and –m union options. These counts were then input into
SAS (SAS Institute, Version 9.2, Cary, NC, USA) for
normalization and statistical analysis. Genes with counts
of 10 or less were removed from all subsequent statistical
analyses. Read counts were normalized using the natural
log of the upper quartile (ln_uq) [83,84]. All count data
can be found in Additional files 4 and 5. Differential
gene expression was determined using a mixed effects
linear model Yijkl = m + ti + γj + ρk + ɛijkl. Y is the normalized estimate of the expression for the fixed effect
of condition (i = ozone/ambient), the random effect of
block (j = 1,2,3,4) and the random effect of lane (k =
1,2,3,4). A log fold change represents the difference of
the ln_uq normalized count data for elevated [O3]
minus ambient [O3]. The assumptions of normality
were tested using the Shapiro-Wilk test [85] for each
gene. A multiple test correction was applied using the
linear step-up method of [86]. Analyses were conducted
in SAS (SAS Institute, Version 9.2, Cary, NC, USA).
Page 10 of 13
Availability of supporting data
The data set supporting the results of this article are included within the article (and its additional files). Additionally, all FASTQ files from all sequencing runs are located
in the Small Read Archive ( />sra), SRP035871, BioProject number PRJNA236472. .
Additional files
Additional file 1: Domain analysis of putative MMP genes found in
flower tissue. The general structure (domain analysis) of all members of
the Arabidopsis MMP family (At1-MMP to At5-MMP), and the two known
soybean MMPs (SMEP1 and GmMMP2) was found in [59]. Domain analysis
of the putative MMP genes found in flower tissue in our dataset was also
completed to compare with known MMP genes. The protein sequence for
each gene in our data set was determined using the Phytozome database
( and the amino acid length and the presence
of a signal peptide, transmembrane and catalytic domain was analyzed
using InterPro ( The signal peptide cleavage
site and C-terminal transmembrane domain were also analyzed using the
predictive software program SignalP 4.1 ( />SignalP/) [87] and Localizome ( />respectively. The presence of a furin cleavage site was analyzed using the
predictive software ProP 1.0 ( and the
presence of a GPI anchor domain was analyzed using the predictive
software big-PI Plant Predictor ( />html). The cysteine switch and zinc-binding motifs of putative soybean
flower MMP genes were determined using sequence alignment with known
Arabidopsis and soybean MMP genes and generated using PRALINE
( [88]. Percent identity of amino
acid sequence analysis was performed Network Protein Sequence Analysis
( />html) [89]. Modification sites (signal cleavage and GPI-anchor) are predicted
to occur between the given locations of the residues in the amino acid
sequence shown in the table. The domain of the GPI-anchor modification is
also given and predicted to occur at one of the two bolded and underlined
residues. The putative soybean MMP gene Glyma02g03301 has two cysteine
switch motifs and two zinc-binding motifs, which is indicated in the table.
Additional file 2: Gene ontology (GO) term enrichment of
biological processes in pod tissue only. GO term enrichment
performed using single enrichment analysis (SEA) tool on AgriGo
( />Additional file 3: Summary statistics for each FASTQ file aligned to
the soybean reference genome. The alignment statistics generated
from Bowtie are presented in this table.
Additional file 4: Differentially expressed genes in flower tissue,
including the fold change in elevated [O3], the FDR-adjusted
p-value and a description of the functional category.
Additional file 5: Differentially expressed genes in pod tissue,
including the fold change in elevated [O3], the FDR-adjusted
p-value and a description of the functional category.
Abbreviations
O3: Ozone; [O3]: Ozone concentration; ppb: Part per billion; ROS: Reactive
oxygen species; PPFD: Photosynthetic photon flux density; RH: Relative
humidity; ECM: Extra-cellular matrix; MMP: Matrix metalloproteinase;
XTH: Xyloglucan endotransglucosylase/hydrolase.
Competing interests
The authors declare that they have no competing interests.
Authors’ contributions
CPL collected field data from SoyFACE, designed and did the growth chamber
experiment, constructed the cDNA libraries for RNA-Seq, completed bioinformatics
and statistical analysis on the sequencing data, and wrote the manuscript. RM
participated in design of the experiments and provided technical support in
Leisner et al. BMC Plant Biology 2014, 14:335
/>
the cDNA library preparation. EAA designed the experiments, provided critical
input in the transcriptomic analysis and wrote the manuscript. All authors read
and approved the final manuscript.
Acknowledgements
We acknowledge Robert Van Buren for help with cDNA library preparation
for Illumina sequencing. This work was supported by a grant to EAA from
the USDA NIFA (Grant No. 2010-65114-20355) and to RM from the UIUC
Campus Research Board (Award No. 12265).
Received: 16 July 2014 Accepted: 14 November 2014
References
1. Van Dingenen R, Dentener FJ, Raes F, Krol MC, Emberson L, Cofala J: The
global impact of ozone on agricultural crop yields under current and
future air quality legislation. Atmos Environ 2009, 43:604–618.
2. Anenberg SC, Horowitz LW, Tong DQ, West JJ: An estimate of the global
burden of anthropogenic ozone and fine particulate matter on
premature human mortality using atmospheric modeling. Environ Health
Persp 2010, 118:1189–1195.
3. The Royal Society: Ground-level ozone in the 21st century: future trends,
impacts and policy implications. In Sci Policy Rep 15/08, R. Soc. London;
2008:1–132.
4. Young PJ, Archibald AT, Bowman KW, Lamarque J-F, Naik V, Stevenson DS,
Tilmes S, Voulgarakis A, Wild O, Bergmann D, Cameron-Smith P, Cionni I,
Collins WJ, Dalsoren SB, Doherty RM, Eyring V, Faluvegi G, Horowitz LW,
Josse B, Lee YH, MacKenzie IA, Nagashima T, Plummer DA, Righi M,
Rumbold ST, Skeie RB, Shindell DT, Strode SA, Sudo K, Szopa S, et al:
Pre-industrial to end 21st century projections of tropospheric ozone from
the Atmospheric Chemistry and Climate Model Intercomparison Project
(ACCMIP). Atmos Chem Phys 2013, 13:2063–2090.
5. Emberson LD, Buker P, Ashmore MR, Mills G, Jackson LS, Agrawal M,
Atikuzzaman MD, Cinderby S, Engardt M, Jamir C, Kobayashi K, Oanh NTK,
Quadir QF, Wahid A: A comparison of North American and Asian
exposure-response data for ozone effects on crop yields. Atmos Environ
2009, 43:1945–1953.
6. Kangasjarvi J, Jaspers P, Kollist H: Signalling and cell death in ozoneexposed plants. Plant Cell Environ 2005, 28:1021–1036.
7. Ainsworth EA, Yendrek CR, Sitch S, Collins WJ, Emberson LD: The effects of
tropospheric ozone on net primary productivity and implications for
climate change. Annu Rev Plant Biol 2012, 63:637–661.
8. Wilkinson S, Mills G, Illidge R, Davies WJ: How is ozone pollution reducing
our food supply? J Exp Bot 2012, 63:527–536.
9. Black VJ, Black CR, Roberts JA, Stewart CA: Impact of ozone on the
reproductive development of plants. New Phytol 2000, 147:421–447.
10. Ashmore MR: Assessing the future global impacts of ozone on
vegetation. Plant Cell Environ 2005, 28:949–964.
11. Leisner CP, Ainsworth EA: Quantifying the effects of ozone on plant
reproductive growth and development. Global Change Biol 2012,
18:606–616.
12. Stewart CA, Black VJ, Black CR, Roberts JA: Direct effects of ozone on the
reproductive development of Brassica species. J Plant Physiol 1996,
148:172–178.
13. Liu FL, Andersen MN, Jensen CR: Loss of pod set caused by drought stress
is associated with water status and ABA content of reproductive
structures in soybean. Funct Plant Biol 2003, 30:271–280.
14. van Schaik PH, Probst AH: Effects of some environmental factors on
flower production and reproductive efficiency in soybeans. Agron J 1958,
50:192–197.
15. Hansen WR, Shibles R: Seasonal log of flowering and podding activity of
field-grown soybeans. Agron J 1978, 70:47–50.
16. Wiebold WJ, Ashley DA, Boerma HR: Reproductive abscission levels and
patterns for eleven determinate soybean cultivars. Agron J 1981,
73:43–46.
17. Huff A, Dybing CD: Factors affecting shedding of flowers in soybean
(Glycine max (L.) Merrill). J Exp Bot 1980, 31:751–762.
18. Heindl JC, Brun WA: Patterns of reproductive abscission, seed yield, and
yield components in soybean. Crop Sci 1984, 24:542–545.
19. Brun WA, Betts KJ: Source/sink relations of abscising and nonabscising
soybean flowers. Plant Physiol 1984, 75:187–191.
Page 11 of 13
20. Carlson DR, Dyer DJ, Cotterman CD, Durley RC: The physiological basis for
cytokinin induced increases in pod set in IX93-100 soybeans. Plant
Physiol 1987, 84:233–239.
21. Nagel L, Brewster R, Riedell WE, Reese RN: Cytokinin regulation of flower
and pod set in soybeans (Glycine max (L.) Merr.). Ann Bot London 2001,
88:27–31.
22. Jiang HF, Egli DB: Shade induced changes in flower and pod number and
flower and fruit abscission in soybean. Agron J 1993, 85:221–225.
23. Westgate ME, Peterson CM: Flower and pod development in waterdeficient soybeans (Glycine max L. Merr.). J Exp Bot 1993, 44:109–117.
24. Kokubun M, Shimada S, Takahashi M: Flower abortion caused by
preanthesis water deficit is not attributed to impairment of pollen in
soybean. Crop Sci 2001, 41:1517–1521.
25. Cheng Y-Q, Liu J-F, Yang X, Ma R, Liu C, Liu Q: RNA-seq analysis reveals
ethylene-mediated reproductive organ development and abscission in
soybean (Glycine max L. Merr.). Plant Mol Biol Rep 2013, 31:607–619.
26. Tuomainen J, Betz C, Kangasjarvi J, Ernst D, Yin Z-H, Langebartels C,
Sangermann H: Ozone induction of ethylene emission in tomato plants:
regulation by differential accumulation of transcripts for the biosynthetic
enzymes. Plant J 1997, 12:1151–1162.
27. Betzelberger AM, Yendrek CR, Sun J, Leisner CP, Nelson RL, Ort DR,
Ainsworth EA: Ozone exposure response for U.S. soybean cultivars: Linear
reductions in photosynthetic potential, biomass and yield. Plant Physiol
2012, 160:1827–1839.
28. Sharma YK, Davis KR: Ozone-induced expression of stress-related genes in
Arabidopsis thaliana. Plant Physiol 1994, 105:1089–1096.
29. Sharma YK, Leon J, Raskin I, Davis KR: Ozone-induced responses in
Arabidopsis thaliana: The role of salicylic acid in the accumulation of
defense-related transcripts and induced resistance. Proc Natl Acad Sci U S A
1996, 93:5099–5104.
30. Eckey-Kaltenbach H, Kiefer E, Grosskopf E, Ernst D, Sandermann H:
Differential transcript induction of parsley pathogenesis-related proteins
and of a small heat shock protein by ozone and heat shock. Plant Mol
Biol 1997, 33:343–350.
31. Miller JD, Arteca RN, Pell EJ: Senescence-associated gene expression
during ozone-induced leaf senescence in Arabidopsis. Plant Physiol 1999,
120:1015–1023.
32. Mahalingam R, Gomez-Buitrago A, Eckardt N, Shah N, Guevara-Garcia A, Day
P, Raina R, Fedoroff NV: Characterizing the stress/defense transcriptome
of Arabidopsis. Genome Biol 2003, 4:R20.
33. Tamaoki M, Nakajima N, Kubo A, Aono M, Matsuyama T, Saji H:
Transcriptome analysis of O3-exposed Arabidopsis reveals that multiple
signal pathways act mutually antagonistically to induce gene expression.
Plant Mol Biol 2003, 53:443–456.
34. Baier M, Kandlbinder A, Golldack D, Dietz KJ: Oxidative stress and ozone:
perception, signalling and response. Plant Cell Environ 2005, 28:1012–1020.
35. Gillespie KM, Xu FX, Richter KT, McGrath JM, Markelz RJC, Ort DR, Leakey
ADB, Ainsworth EA: Greater antioxidant and respiratory metabolism in
field-grown soybean exposed to elevated O3 under both ambient and
elevated CO2. Plant Cell Environ 2012, 35:169–184.
36. Andrews AD, Svec LV: Photosynthetic activity of soybean pods at different
growth stages compared to leaves. Can J Plant Sci 1975, 55:501–505.
37. Horner HT, Healy RA, Cervantes-Martinez T, Palmer RG: Floral nectary fine
structure and development in Glycine max L. (Fabaceae). Int J Plant Sci
2003, 164:675–690.
38. Mann JD, Jaworski EG: Comparison of stresses which may limit soybean
yields. Crop Sci 1970, 10:620–624.
39. Sionit N, Kramer PJ: Effect of water stress during different stages of
growth of soybean. Agron J 1977, 69:274–278.
40. Shiu SH, Bleecker AB: Receptor-like kinases from Arabidopsis form a
monophyletic gene family related to animal receptor kinases. Proc Natl
Acad Sci U S A 2001, 98:10763–10768.
41. Shiu SH, Bleecker AB: Expansion of the receptor-like kinase/Pelle gene
family and receptor-like proteins in Arabidopsis. Plant Physiol 2003,
132:530–543.
42. Wrzaczek M, Brosche M, Salojarvi J, Kangasjarvi S, Idanheimo N, Mersmann
S, Robatzek S, Karpinski S, Karpinska B, Kangasjarvi J: Transcriptional
regulation of the CRK/DUF26 group of receptor-like protein kinases
by ozone and plant hormones in Arabidopsis. BMC Plant Biol 2010, 10:95.
43. Yin G, Xu H, Xiao S, Qin Y, Li Y, Yan Y, Hu Y: The large soybean (Glycine
max) WRKY TF family expanded by segmental duplication events and
Leisner et al. BMC Plant Biology 2014, 14:335
/>
44.
45.
46.
47.
48.
49.
50.
51.
52.
53.
54.
55.
56.
57.
58.
59.
60.
61.
62.
63.
64.
65.
subsequent divergent selection among subgroups. BMC Plant Biol 2013,
13:148.
Llorca CM, Potschin M, Zentgraf U: bZIPs and WRKYs: two large
transcription factor families executing two different functional strategies.
Front Plant Sci 2014, 5:169.
Olbrich M, Betz G, Gerstner E, Langebartels C, Sandermann H, Ernst D:
Transcriptome analysis of ozone-responsive genes in leaves of European
beech (Fagus sylvatica L.). Plant Biol 2005, 7:670–676.
Rizzo M, Bernardi R, Salvini M, Nali C, Lorenzini G, Durante M: Identification
of differentially expressed genes induced by ozone stress in sensitive
and tolerant poplar hybrids. J Plant Physiol 2007, 164:945–949.
Pandey V, Haikio E, Lehesranta S, Koistinen K, Karenlampi S, Oksanen E:
Proteomic analysis of two hybrid aspen clones subjected to long-term
chronic ozone exposure in open field. Curr Proteomics 2013, 10:67–74.
Pak JH, Liu CY, Huangpu J, Graham JS: Construction and characterization
of the soybean leaf metalloproteinase cDNA. FEBS Lett 1997,
404:283–288.
Delorme VGR, McCabe PF, Kim DJ, Leaver CJ: A matrix metalloproteinase
gene is expressed at the boundary of senescence and programmed cell
death in cucumber. Plant Physiol 2000, 123:917–927.
Liu YQ, Dammann C, Bhattacharyya MK: The matrix metalloproteinase
gene GmMMP2 is activated in response to pathogenic infections in
soybean. Plant Physiol 2001, 127:1788–1797.
Combier JP, Vernie T, de Billy F, El Yahyaoui F, Mathis R, Gamas P: The
MtMMPL1 early nodulin is a novel member of the matrix
metalloendoproteinase family with a role in Medicago truncatula
infection by Sinorhizobium meliloti. Plant Physiol 2007, 144:703–716.
Jiang WP, Bond JS: Families of metalloendopeptidases and their
relationships. FEBS Lett 1992, 312:110–114.
Bode W, Gomisruth FX, Stockler W: Astacins, serralysins, snake-venom and
matrix metalloproteinases exhibit identical zinc-binding environments
(HEXXHXXGXXH and Met-Turn) and topologies and should be grouped
into a common family, the metzincins. FEBS Lett 1993, 331:134–140.
Hooper NM: Families of zinc metalloproteases. FEBS Lett 1994, 354:1–6.
Graham JS, Xiong J, Gillikin JW: Purification and developmental analysis of
a metalloendoproteinase from the leaves of Glycine max. Plant Physiol
1991, 97:786–792.
McGeehan G, Burkhart W, Anderegg R, Becherer JD, Gillikin JW, Graham JS:
Sequencing and characterization of the soybean leaf metalloproteinase structural and functional similarity to the matrix metalloproteinase
family. Plant Physiol 1992, 99:1179–1183.
Rowsell S, Hawtin P, Minshull CA, Jepson H, Brockbank SMV, Barratt DG,
Slater AM, McPheat WL, Waterson D, Henney AM, Pauptit RA: Crystal
structure of human MMP9 in complex with a reverse hydroxamate
inhibitor. J Mol Biol 2002, 319:173–181.
Ranieri A, Castagna A, Pacini J, Baldan B, Mensuali-Sodi A, Soldatini GF:
Early production and scavenging of hydrogen peroxide in the
apoplast of sunflower plants exposed to ozone. J Exp Bot 2003,
54:2529–2540.
Flinn BS: Plant extracellular matrix metalloproteinases. Funct Plant Biol
2008, 35:1183–1193.
Afzal AJ, Wood AJ, Lightfoot DA: Plant receptor-like serine threonine
kinases: Roles in signaling and plant defense. Mol Plant Microbe 2008,
21:507–517.
ten Hove CA, Bochdanovits Z, Jansweijer VMA, Koning FG, Berke L,
Sanchez-Perez GF, Scheres B, Heidstra R: Probing the roles of LRR RLK
genes in Arabidopsis thaliana roots using a custom T-DNA insertion set.
Plant Mol Biol 2011, 76:69–83.
Greeff C, Roux M, Mundy J, Petersen M: Receptor-like kinase complexes in
plant innate immunity. Front Plant Sci 2012, 3:A209.
Tanaka H, Osakabe Y, Katsura S, Mizuno S, Maruyama K, Kusakabe K, Mizoi J,
Shinozaki K, Yamaguchi-Shinozaki K: Abiotic stress-inducible receptor-like
kinases negatively control ABA signaling in Arabidopsis. Plant J 2012,
70:599–613.
Zhang XJ, Yang GY, Shi R, Han XM, Qi LW, Wang RG, Xiong LM, Li GJ:
Arabidopsis cysteine-rich receptor-like kinase 45 functions in the
responses to abscisic acid and abiotic stresses. Plant Physiol Bioch 2013,
67:189–198.
Yang L, Wu KC, Gao P, Liu XJ, Li GP, Wu ZJ: GsLRPK, a novel cold-activated
leucine-rich repeat receptor-like protein kinase from Glycine soja, is a
positive regulator to cold stress tolerance. Plant Sci 2014, 215:19–28.
Page 12 of 13
66. Babosha AV: Inducible lectins and plant resistance to pathogens and
abiotic stress. Biochem Mosc 2008, 73:812–825.
67. Osakabe Y, Yamaguchi-Shinozaki K, Shinozaki K, Tran LSP: Sensing the
environment: key roles of membrane-localized kinases in plant
perception and response to abiotic stress. J Exp Bot 2013, 64:445–458.
68. Nishitani K: Implication of xyloglucan related protein (XRP) family in
regulation of plant growth and development. Trends Glycosci Glycotech
1997, 9:233–234.
69. Matsui A, Yokoyama R, Seki M, Ito T, Shinozaki K, Takahashi T, Komeda Y,
Nishitani K: AtXTH27 plays an essential role in cell wall modification
during the development of tracheary elements. Plant J 2005,
42:525–534.
70. Jimenez T, Martin I, Labrador E, Dopico B: The immunolocation of
xyloglucan endotransglucosylase/hydrolase specific to elongating tissues
in Cicer arietinum suggests a role in the elongation of vascular cells.
J Exp Bot 2006, 57:3979–3988.
71. Romo S, Jimenez T, Labrador E, Dopico B: The gene for a xyloglucan
endotransglucosylase/hydrolase from Cicer arietinum is strongly
expressed in elongating tissues. Plant Physiol Biochem 2005, 43:169–176.
72. Hyodo H, Yamakawa S, Takeda Y, Tsuduki M, Yokota A, Nishitani K, Kohchi T:
Active gene expression of a xyloglucan endotransglucosylase/hydrolase
gene, XTH9, in inflorescence apices is related to cell elongation in
Arabidopsis thaliana. Plant Mol Biol 2003, 52:473–482.
73. Liu YB, Lu SM, Zhang JF, Liu S, Lu YT: A xyloglucan endotransglucosylase/
hydrolase involves in growth of primary root and alters the deposition
of cellulose in Arabidopsis. Planta 2007, 226:1547–1560.
74. Malinowski R, Filipecki M, Tagashira N, Wisniewska A, Gaj P, Plader W,
Malepszy S: Xyloglucan endotransglucosylase/hydrolase genes in
cucumber (Cucumis sativus) - differential expression during somatic
embryogenesis. Physiol Plant 2004, 120:678–685.
75. Singh AP, Tripathi SK, Nath P, Sane AP: Petal abscission in rose is
associated with the differential expression of two ethylene-responsive
xyloglucan endotransglucosylase/ hydrolase genes, RbXTH1 and
RbXTH2. J Exp Bot 2011, 62:5091–5103.
76. Kumpf RP, Shi CL, Larrieu A, Sto IM, Butenko MA, Peret B, Riiser ES, Bennett
MJ, Aalen RB: Floral organ abscission peptide IDA and its HAE/HSL2
receptors control cell separation during lateral root emergence. Proc Natl
Acad Sci U S A 2013, 110:5235–5240.
77. Jinn TL, Stone JM, Walker JC: HAESA, an Arabidopsis leucine-rich repeat
receptor kinase, controls floral organ abscission. Gene Dev 2000,
14:108–117.
78. Olbrich M, Gerstner E, Welzl G, Winkler JB, Ernst D: Transcript responses in
leaves of ozone-treated beech saplings seasons at an outdoor free air
model fumigation site over two growing seasons. Plant Soil 2009,
323:61–74.
79. Wu YJ, Jeong BR, Fry SC, Boyer JS: Change in XET activities, cell wall
extensibility and hypocotyl elongation of soybean seedlings at low
water potential. Planta 2005, 220:593–601.
80. Broekgaarden C, Poelman EH, Steenhuis G, Voorrips RE, Dicke M, Vosman B:
Responses of Brassica oleracea cultivars to infestation by the aphid
Brevicoryne brassicae: an ecological and molecular approach. Plant Cell
Environ 2008, 31:1592–1605.
81. Hewitt EJ: Sand and water culture methods used in the study of plant
nutrition. London: Commonwealth Agricultural Bureau; 1952.
82. Langmead B, Trapnell C, Pop M, Salzberg SL: Ultrafast and memoryefficient alignment of short DNA sequences to the human genome.
Genome Biol 2009, 10:R25.
83. Bullard JH, Purdom E, Hansen KD, Dudoit S: Evaluation of statistical
methods for normalization and differential expression in mRNA-Seq
experiments. BMC Bioinformatics 2010, 11:94.
84. Dillies MA, Rau A, Aubert J, Hennequet-Antier C, Jeanmougin M, Servant N,
Keime C, Marot G, Castel D, Estelle J, Guernec G, Jagla B, Jouneau L,
Laloë D, Le Gall C, Schaëffer B, Le Crom S, Guedj M, Jaffrézic F: A
comprehensive evaluation of normalization methods for Illumina
high-throughput RNA sequencing data analysis. Brief Bioinform 2013,
14:671–683.
85. Shapiro SS, Wilk MB: An analysis of variance test for normality (complete
samples). Biometrika 1965, 52:591–611.
86. Benjamini Y, Hochberg Y: Controlling the false discovery rate – a practical
and powerful approach to multiple testing. J Royal Stat Soc Series B
Method 1995, 57:289–300.
Leisner et al. BMC Plant Biology 2014, 14:335
/>
Page 13 of 13
87. Petersen TN, Brunak S, von Heijne G, Nielsen H: SignalP 4.0: discriminating
signal peptides from transmembrane regions. Nat Methods 2011,
8:785–786.
88. Simossis VA, Heringa J: PRALINE: a multiple sequence alignment
toolbox that integrates homology-extended and secondary structure
information. Nucleic Acids Res 2005, 33:289–294.
89. Combet C, Blanchet C, Geourjon C, Deleage G: NPS@: Network protein
sequence analysis. Trends Biochem Sci 2000, 25:147–150.
doi:10.1186/s12870-014-0335-y
Cite this article as: Leisner et al.: Distinct transcriptional profiles of
ozone stress in soybean (Glycine max) flowers and pods. BMC Plant
Biology 2014 14:335.
Submit your next manuscript to BioMed Central
and take full advantage of:
• Convenient online submission
• Thorough peer review
• No space constraints or color figure charges
• Immediate publication on acceptance
• Inclusion in PubMed, CAS, Scopus and Google Scholar
• Research which is freely available for redistribution
Submit your manuscript at
www.biomedcentral.com/submit