Genetic, metabolite and developmental determinism of fruit friction discolouration in pear
Bạn đang xem bản rút gọn của tài liệu. Xem và tải ngay bản đầy đủ của tài liệu tại đây (909.9 KB, 18 trang )
Saeed et al. BMC Plant Biology 2014, 14:241
/>
RESEARCH ARTICLE
Open Access
Genetic, metabolite and developmental
determinism of fruit friction discolouration in
pear
Munazza Saeed1,2, Lester Brewer3, Jason Johnston4, Tony K McGhie2, Susan E Gardiner2, Julian A Heyes1
and David Chagné2*
Abstract
Background: The unattractive appearance of the surface of pear fruit caused by the postharvest disorder friction
discolouration (FD) is responsible for significant consumer dissatisfaction in markets, leading to lower returns to
growers. Developing an understanding of the genetic control of FD is essential to enable the full application of
genomics-informed breeding for the development of new pear cultivars. Biochemical constituents [phenolic
compounds and ascorbic acid (AsA)], polyphenol oxidase (PPO) activity, as well as skin anatomy, have been proposed
to play important roles in FD susceptibility in studies on a limited number of cultivars. However, to date there has been
no investigation on the biochemical and genetic control of FD, employing segregating populations. In this study,
we used 250 seedlings from two segregating populations (POP369 and POP356) derived from interspecific crosses
between Asian (Pyrus pyrifolia Nakai and P. bretschneideri Rehd.) and European (P. communis) pears to identify genetic
factors associated with susceptibility to FD.
Results: Single nucleotide polymorphism (SNP)-based linkage maps suitable for QTL analysis were developed for the
parents of both populations. The maps for population POP369 comprised 174 and 265 SNP markers for the male and
female parent, respectively, while POP356 maps comprised 353 and 398 SNP markers for the male and female parent,
respectively. Phenotypic data for 22 variables were measured over two successive years (2011 and 2012) for POP369
and one year (2011) only for POP356. A total of 221 QTLs were identified that were linked to 22 phenotyped variables,
including QTLs associated with FD for both populations that were stable over the successive years. In addition, clear
evidence of the influence of developmental factors (fruit maturity) on FD and other variables was also recorded.
Conclusions: The QTLs associated with fruit firmness, PPO activity, AsA concentration and concentration of polyphenol
compounds as well as FD are the first reported for pear. We conclude that the postharvest disorder FD is controlled by
multiple small effect QTLs and that it will be very challenging to apply marker-assisted selection based on these QTLs.
However, genomic selection could be employed to select elite genotypes with lower or no susceptibility to FD early in
the breeding cycle.
Keywords: Friction discolouration, Postharvest, QTL, SNP, PPO, Pyrus
* Correspondence:
2
The New Zealand Institute for Plant & Food Research Limited (Plant & Food
Research), Private Bag 11600, Palmerston North 4442, New Zealand
Full list of author information is available at the end of the article
© 2014 Saeed et al.; licensee BioMed Central Ltd. This is an Open Access article distributed under the terms of the Creative
Commons Attribution License ( which permits unrestricted use, distribution, and
reproduction in any medium, provided the original work is properly credited. The Creative Commons Public Domain
Dedication waiver ( applies to the data made available in this article,
unless otherwise stated.
Saeed et al. BMC Plant Biology 2014, 14:241
/>
Background
Consumer awareness of the long-term health benefit of
fruit consumption has significantly increased the demand for high-quality fresh fruit. Postharvest disorders
of fresh fruits are a major factor contributing to product
deterioration and crop losses. Many such disorders are
physiological in origin and may be related to time of
harvest (maturity), season and growing region, as well as
cultivar (genotype). A range of postharvest treatments is
traditionally employed to minimise disorders and typically
a single treatment is not enough to control a postharvest
disorder. However, new technologies in molecular genetics
and metabolomics now enable us to dissect the control of
fruit postharvest disorders into fine-scale determinants
that include biochemical and genetic controls and provide
some hope for development of more targeted solutions.
Friction discolouration (FD) is a serious postharvest
disorder in pear generally categorised by diffuse brown
skin marks that occur as a result of mechanical damage
and lead to the enzymatic browning of the fruit skin.
Mechanical damage can occur at any step during picking,
sorting, processing or transportation [1,2]. FD is different
from bruising as it is confined only to epidermal layers,
with no damage to flesh. Although nutritive value and flavour is not affected by FD, the unattractive appearance of
the fruit results in consumer dissatisfaction and reduced
prices, which can lead to severe market losses [3,4]. Mechanical injury also enhances respiration and moisture loss
from the injured area, as well as ethylene production, a
combination that may speed ripening and reduce shelf life.
The underlying mechanism behind FD involves a combination of physical stress and biochemical reactions, in
particular the enzymatic oxidation of polyphenols by
polyphenol oxidase (PPO) [5]. Polyphenols are the specific substrates for the underlying browning reaction in
FD, with cholorogenic acid being the most abundant
phenolic compound in pears and generally believed to
play the most crucial role in enzymatic browning [5].
Other factors may also contribute to differential FD susceptibility, such as the activity of PPO and the concentration of ascorbic acid (AsA) as a key inhibitor to
enzymatic browning [6,7]. Additionally, the nature of the
skin surface may influence its susceptibility to physical
damage [8]. Some varieties of pear are known to be
more or less susceptible to FD, indicating underlying
genetic determination, but still, fruit susceptibility can
vary with the maturation stage of a single cultivar. It also
has been noted that European species are less susceptible than Asian species in general [9-13]. The Plant &
Food Research (PFR) pear breeding programme ([14])
applies strong selection pressure against FD [15] and this
process would be greatly benefitted by the application of
marker-assisted selection (MAS) at the seedling stage, to
enable selection of genotypes with low genetic potential
Page 2 of 18
to develop FD. However, the detailed phenotypic analysis
required for trait association with genetic markers has
seldom been undertaken in pear for any fruit quality parameters, let alone one as complex as FD.
Quantitative trait loci (QTLs) for fruit traits, such as
fruit shape, sugar content, acid content, vitamin C content, maturity, and fruit skin composition have been
mapped in a range of fruit crops, including tomato
[1,16-18], peach [19-21], apple [22-27], strawberry [28],
sweet cherry [29,30], apricot [31,32] and papaya [33],
among others. There is a single report on QTL analysis
of pear fruit characters by Zhang et al. [34], in which
QTLs for traits such as fruit weight, diameter, length,
soluble solid content, fruit shape index, and maturity
date were identified in Chinese pear (P. bretschneideri)
cultivars ‘Bayuehong’ and ‘Dangshansuli’. There are two
reports in apple [35,36] and one in melon [37] evaluating the QTLs associated to fruit physiological disorders,
however, none of them has used systematic approach to
evaluate the genomic regions (QTLs) linked to disorder
as well as characters influencing fruit. Also, our study is
the first focusing on genetic solution to a postharvest
disorder in pear.
A number of genetic maps for pear have been developed
for the purpose of trait mapping, using a range of molecular markers, including RAPDs (random amplified polymorphic DNA) [38], AFLPs (amplified fragment length
polymorphism), SSRs (simple sequence repeats) [39-43]
and sequence-related amplified polymorphisms (SRAPs)
[44]. However, none of these maps has been developed
directly from Pyrus genome sequences. Recently, Wu
et al. [45] used next generation sequencing to develop a
dense interspecific genetic map of ‘Bayuehong’ (P. bretschneideri × P. communis) × ‘Dangshansuli’ (P. bretschneideri)
comprising 2005 SNP (single nucleotide polymorphism)
markers, to anchor the Chinese pear genome. However,
there are no reports to date of trait mapping in this
population using these 2005 SNPs. More recently,
the International RosBREED SNP Consortium (IRSC)
Illumina Infinium® II 9K apple and pear SNP chip [46,47]
was developed for genetic mapping of traits in five segregating populations of pear, including two interspecific
populations segregating for FD.
Although there are previous studies on postharvest
aspects of FD [4,48-51], there has been no attempt to
explore systematically the genetic basis and control of
this disorder. Hence we have focussed first on developing an in-depth understanding of the variation of phenotypes that might be associated with FD development
(FD intensity, firmness, total soluble solids, PPO activity, and concentration AsA and seventeen polyphenols)
among the different genotypes in our mapping populations. Here the goal is to identify factors that might influence the development of FD and hence differential
Saeed et al. BMC Plant Biology 2014, 14:241
/>
susceptibility to this disorder. Breeders have reported
a high narrow sense heritability (0.72) among interspecific pear breeding populations, including both
populations under study, which suggested that comprehensive genetic gain could be obtained for FD [15].
Our strategy utilises this phenotypic analysis for subsequent QTL analysis to identify genetic loci associated with
FD, utilising two related populations in which individuals
segregated for susceptibility to FD. Our study is the first
report of the use of a SNP-based dense genetic linkage
map for QTL analysis in pear, as well as the first systematic investigation of the genetic control of a postharvest disorder in pear.
Methods
Plant material and fruit sampling
Two full-sib families (POP356 and POP369) resulting
from interspecific crosses between Asian (P. pyrifolia
Nakai and P. bretschneideri Rehd.) and European pears
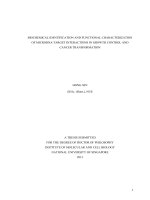
(P. communis L.) (Figure 1) were grown at the Motueka
Research Centre, PFR, Motueka, New Zealand. POP369
is a population of 1028 full-sib genotypes from a cross
between POP369-female and POP369-male. Both families were planted on their own roots into the orchard in
2007 at row spacing of 3 m and in row spacing of 0.75
m. Plants received a standard fertiliser programme and
any branches at least one meter above the wire trellis at
a height of 1.8m were bent down to the wire in January
each year. Trees that had not commenced fruiting were
girdled in December with a Vaca cane girdler, which removed a 4 mm horizontal strip of vascular tissue below
the 1.8 m wire. Fruit from 98 seedlings from the
POP369 population were harvested for phenotype and
QTL analysis in 2011 and 2012. POP356 was a population totaling 1285 full-sib genotypes from a cross between POP356-female and POP356-male parent. Fruit
from 143 seedlings from the POP356 population were
collected for phenotype and QTL analysis in 2011. Fruit
harvest for each genotype began when fruit had a greenyellow background colour and were harvested every 7–
Page 3 of 18
12 days until fruit ran out. Fruit was stored for 90 to 100
days at 3°C for initiation of ripening, and then transported to PFR Palmerston North by refrigerated truck
for further analysis.
Friction discolouration assessment
To assess FD, four random fruit were selected per seedling, removed from the cool store and kept overnight at
room temperature. FD was induced the next day by rubbing the fruit twice against a fiber tray cup surface [15,52].
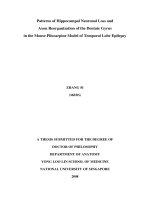
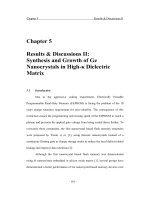
After another 24 h at room temperature, browning area
and intensity was recorded on a 0–9 scale, where 0 is absence of FD and 9 is the highest FD score (Figure 2). FD
was scored by the same single assessor in 2011 and 2012
to reduce experimental error. FD score was averaged
across all four fruit for each seedling and harvest date.
Total soluble solids and firmness
Total soluble solids content (TSS) and fruit firmness were
measured using two of the same fruit on which FD was
determined. Equal amounts of juice from both ends of the
fruit were used to assess TSS (°Brix) using a digital refractometer (Atago, Japan). Compression firmness was measured in Newton (N) at two points separated by 180°
around each fruit equator, using a texture analyser TA-XT
Plus (Stable Micro System, Godalming, UK) fitted with a
7.9 mm probe. TSS and fruit firmness was averaged across
both fruits and harvest date for each seedling.
Peel sample preparation and extraction for polyphenol
and AsA quantification
Peel of 1 mm thickness, consisting of fruit skin with
underlying flesh was removed from the equatorial area
of 4–5 fruit per genotype (preferably same fruits that
were used for FD assessment), snap frozen and then
ground together with a pellet of dry ice, using a coffee
grinder. Ground peel tissue was stored frozen at −80°C
until further analysis. Extraction solution (80:20:1 EtOH:
H2O: formic acid; 5 ml) was added to 1 g of finely
ground peel and left for 24 h at 4°C. After 24 h, culture
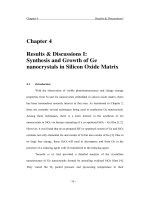
Figure 1 Genetic information and friction discolouration (FD) potential concerning the parents of POP369 and POP356 pear populations.
Saeed et al. BMC Plant Biology 2014, 14:241
/>
Page 4 of 18
Figure 2 Visual scale for friction discolouration (FD) score assessment in pear.
tubes containing the extract were centrifuged (1000 g,
15 min) at 20 ± 2°C and the extracts were sampled directly into high performance liquid chromatography
(HPLC) vials. Aliquots of the extracts were diluted in
cold solvent (50:50:1 MeOH: H2O: formic acid) prior to
polyphenol analysis.
Polyphenol quantification in pear peel
Polyphenol content of these extracts was analysed using a
liquid chromatography mass spectrometry (LC-MS) system that comprised a Dionex Ultimate® 3000 Rapid Separation LC system and a micrOTOF-QII mass spectrometer
(Bruker Daltonics, Bremen, Germany) fitted with an electrospray source operated in negative mode. The analytical
column was Zorbax™ SB-C18 HD, 2.1 × 150 mm, 1.8 μm
(Agilent, Melbourne, Australia). Solvents used in 2011
were A = 90% methanol, and B = 0.5% formic acid in water
(v/v), with a gradient of 5% A, 95% B for 0–0.5 min; gradient to 40% A, 60% B from 0.5-8 min; gradient to 75% A,
25% B from 8–11 min; and gradient to 100% A, 0.0% B
from 11–12 min. The composition was then held at 100%
A from 12–14 min; decreased down to 5.0% A, 95% B
between 14–14.2 min. The gradient of 5% A, 95% B was
maintained until injection of the next sample. Total run
time for each sample was 17 minutes.
Solvents used in 2012 were A = 100% acetonitrile and
B = 0.1% formic acid with a gradient of 5% A, 95% B for
0–0.5 min; gradient to 30% A, 70% B from 0.5-10 min;
gradient to 100% A, 0.0% B from 10–14.50 min. The
composition was then held at 100% A from 14.5-16.50
min; decreased to 5.0% A, 95% B between16.5-17 min,
and maintained until the next sample was injected. Total
run time for each sample was 20 minutes.
Polyphenolic components were quantified using QuantAnalysis (Bruker Daltonics, Bremen, Germany) by extracting
accurate (±10 mDa) mass ion chromatograms. As external
standards were not available for all the detected compounds, we used peak area (response/min) for calculations
involving phenolic concentrations for all the compounds.
Polyphenol oxidase activity quantification in pear peel
PPO activity was measured spectrophotometrically as
described in [50,53] with a few modifications. Extraction
solution (0.05 M phosphate buffer, 1MKCl, pH 7) and 1
g polyvinylpolypyrrolidone (PVPP) was added to 1 g
finely ground frozen peel. This mixture was homogenised and centrifuged (14 000 g) for 15 minutes at 4°C.
Each sample contained 25 μl extract, 220 μl reaction
buffer (0.2 M phosphate, 0.1 M citrate, pH 6.5) and 55
μl standard catechol solution (0.5 M catechol in a 10fold dilution of the reaction buffer). The assay procedure
was carried out at 20°C with initial shaking for 2 sec.
The increase in absorbance at 420 nm was then recorded by spectrophotometer (Molecular Devices Spectra Max Plus, Sunnyvale, CA, USA) with readings at 2
sec intervals, and eight samples read simultaneously. Enzyme activity was calculated from the initial 20 sec gradient of curves in 2011, and initial 30 sec in 2012. PPO
activity is presented as the change in absorbance at 420
nm per gram fresh pear peel per minute (change in
A420/ g/minute).
Ascorbic acid quantification in pear peel
AsA content in pear fruit peel was quantified on an Alliance 2690 HPLC (Waters, Milford, MA, USA). Solventbased peel extracts (prepared for polyphenol quantification) were diluted 1:4 with tris-(2-carboxyethyl) phosphine and incubated in the dark for 90 minutes. AsA
was resolved using a Synergi 4 μm Hydro 4.6 × 250 mm
(Phenomenex, Torrance, CA) reversed phase column
protected with a guard column of the same packing.
Column temperature was set at 40°C. The solvents used
were A = 0.5% v/v phosphoric acid (98%) and C = 70:30
methanol/Milli-Q water (2%) with proportions remaining
the same throughout the run. Sample injection volume
was 10 μL and flow rate was 0.8 mL per minute. Total
run time for each sample was set at 9 min isocratic run
time. An external calibration curve was constructed
for AsA based on three standards with concentrations
10 μg/mL, 20 μg/mL and 50 μg/mL, respectively.
Quantification of AsA was based on peak areas determined at 240 nm in 2011, and 250 nm in 2012. Chromatographic data were collected and manipulated
using a Chromeleon® Chromatography Management
System version 6.8. The AsA concentration derived
from the HPLC analysis was transformed from μg/mL
Saeed et al. BMC Plant Biology 2014, 14:241
/>
(Cv) to μg/g (Cw) of fresh weight by dividing Cv by the
fresh weight of the sample.
Statistical analysis
Minitab® version 16.1.1 was used to test the trait distribution, to calculate the Pearson correlation of the traits,
and to perform analysis of variance (ANOVA).
DNA extraction and SNP screening
For the POP369 population, DNA from 94 full-sibs and
the pollen parent was purified from young leaves using a
CTAB (hexadecyltrimethylammonium bromide) extraction method [54], followed by column purification using
the NucleoSpin® kit (Macherey-Nagel GmbH & Co. KG).
For the POP356 population, DNA from 123 full-sibs and
the pollen parent was extracted using the QIAGEN
DNeasy Plant Kit (QIAGEN GmbH, Hilden, Germany).
DNA could not be prepared from the female parent of
POP369 and POP356 common to both populations as
trees of this genotype no longer existed in the field.
DNA quantifications were carried out using a NanoDrop™
2000c spectrophotometer (Thermo Fisher Scientific Inc.).
Genomic DNA (200 ng) from progeny and male parents was amplified and hybridised to the apple and pear
IRSC 9K SNP array [46,47] following the Illumina Infinium® HD Assay Ultra protocol (Illumina Inc., San
Diego, CA, USA) and scanned with the Illumina iScan.
Data was analysed using Illumina’s GenomeStudio v1.0
software Genotyping Module, setting a GenCall Threshold of 0.15. The software automatically determines the
cluster positions of the AA/AB/BB genotypes for each
SNP and displays them in normalised graphs. A systematic method was used for evaluating the SNP array data
using quality metrics extracted from GenomeStudio (Illumina): GenTrain score ≥ 0.50, minor allelic frequency
(MAF) ≥ 0.15 and call rate > 80%. The genotype of the female parent was inferred manually on the basis of the
genotype of the other parent and progeny. SNPs that were
highly distorted or which had the genotype of one or both
parents missing were manually edited in GenomeStudio.
Furthermore, the SNPs for which 25% and 50% of the individuals were not called in clusters were manually edited,
since this could be due to null allele segregation.
Genetic map construction and QTL mapping
The genetic maps of the four parents of the two populations were constructed using double pseudo test cross
methodology [55] and JoinMap v3.0 software [56] based
on the SNP data for the individuals in each population.
Linkage groups were determined with a LOD score of 5
or higher for grouping and the Kosambi mapping function was used for genetic distance calculation.
Linkage group numbering was determined using apple
SNPs [46] anchored to the reference genome of ‘Golden
Page 5 of 18
Delicious’. Furthermore POP369 shares a common parent with a population published earlier in [47] that has
54 simple sequence repeats mapped to enable LG numbering that is consistent with previously published pear
and apple maps. The alignment of male parental maps
from both populations is provided in Additional file 1:
Figure S1.
The four parental maps were drawn and aligned using
MapChart v2.2 [57] and QTL analysis was performed
using MapQTL 5.0 [58]. For individual seedlings with
more than one fruit harvest, both average and maximum
score of the data were used as phenotypic data, where
FD score was expressed for each individual as maximum
FD and average FD. The data distribution for each compound was verified before the QTL analysis. QTLs were
identified using the Kruskal-Wallis Test (KW) because
most of the traits were not normally distributed. SNPs
are presented using the NCBI dbSNP accession number
(ss #) and SNPs with null alleles are represented with
the prefix ‘null’.
Results
Friction discoloration variation in the pear segregating
populations
Fruit from 241 individual genotypes were harvested in
2011 with some genotypes sampled multiple times – 206
fruit samples from 143 genotypes of family POP356 and
125 fruit samples from 98 genotypes of family POP369.
In 2012, 177 fruit samples from 98 genotypes of the
POP369 population were harvested, with multiple harvests
where possible. In both years, fruit were assessed for FD,
firmness, TSS, PPO activity, AsA and polyphenolic compounds concentrations. Means, medians, maxima and
minima information for phenotypic traits averaged across
multiple fruits and harvest date for each seedling are provided in Table 1. Both populations displayed a range of FD
scores, from no FD observed for some genotypes, to high
FD scores observed in other genotypes (Figure 2).
Having more than one harvest from some genotypes
provided the opportunity for comparison of the FD susceptibility between fruit at different stages of maturity.
FD susceptibility showed substantial variation between
different harvests, genotypes and even between fruit of
the same genotype (Figure 3A,B,C). Both populations
showed a variety of trends for FD incidence with different harvest dates for same genotypes. Of 23 genotypes
with multiple harvests in 2011, five genotypes of the
POP369 population exhibited low FD at early harvests
and high FD at later harvests. However, within the same
segregating population, two genotypes exhibited a decrease in FD susceptibility later in the season. There
were 16 genotypes that did not show any variation of FD
score between the harvest dates, with 14 genotypes scoring consistently low, and two exhibiting a consistently
Saeed et al. BMC Plant Biology 2014, 14:241
/>
Page 6 of 18
Table 1 Ranges in trait data collected form pear populations POP369 and POP356
POP369 (2011)
POP369 (2012)
POP356 (2011)
Trait
Min
Max
Median Mean
Min
Max
Median Mean
Min
Max
Median Mean
Friction discolouration
0
9
4
0.1
9
4.7
0
9
2
Total soluble solids
9.8
15.6
11.8
11.9
9
15.3
11.9
11.9
9.2
15.2
11.7
11.7
Firmness
10.3
54.2
31.5
31.7
13.9
48.6
23
23.9
14.2
55.8
29.5
29.8
Polyphenol oxidase
191.1
1424.7
761.1
779.1
24.2
258.1
77.2
93.4
103.3 1989
706.7
761.6
Ascorbic Acid
3.2
167.9
60.6
59.6
23.8
217.1
74.4
76.8
0
26.1
35.1
Chlorogenic acid
5341.8 112476.8 19664.6
24912.0 29503.7 175530.7 71581.6
78099.2 0
Cryptochlorogenic acid
0
6330.3
1315.8
1539.8
1757
21934.2
6592.4
7739.5
104.4 10501.5
2390.3
2992
Neochlorogenic acid
0
3358.8
315.9
422.6
0
14282.5
1640.2
2000.4
0
4789.7
810.6
957.6
Catechin
0
2571
256.7
426.3
0
13644.8
1686.4
2514.4
0
4712.2
401.7
721.3
Epicatechin
1078
39207.9
7224.7
10392.7 11661.4 132773.5 38185.6
42373.9 0
111592.7 7709.7
14260.4
Procyanidin dimer B2
0
18355.3
4766.4
5366.5
22486.3 0
46723.1
5424.3
8059.3
63829.6
10176.8
13770.6 1410.6
10913.7 0
90793.3
10818.2
17741.6
Isorhamnetin 3-galactoside 493.3
3.7
Isorhamnetin 3-glucoside
4133.3
55342.1
20882
49696.3
8429.4
4.6
6114.4
121846.6 26221.3
31505.4
142.4
208083.1 42485.9
2.6
53134.6
Isorhamnetin rutinoside
788.7
18269.3
5258.3
6260.5
2649.5
36273.8
13589.1
14579.6 0
109860.2 11466.2
17960.3
p-coumaryl quinic acid
0
3507.2
0
297.1
0
10184.7
1067.1
1715.6
73981.9
3709
Quercetin arabinoside
0
63039.5
7531.1
10031.2 58.5
75916.5
16686.7
19980.9 0
47628.8
6607.7
9347.8
Quercetin galactoside
0
14337.2
1033.1
2098
889.9
32231
6415.8
8207.6
0
41149.9
1449.9
3059.2
Quercetin glucoside
0
24575.7
5073.7
6732.8
4485.9
76754.7
19285
24123.3 0
79820.1
5774.5
8791
Quercetin rutinoside
0
4748.4
1042.4
1226.5
263.6
13591.8
3295.2
4033.3
27078.8
2159.5
3698.7
Quercetin rhamnoside
0
48041.9
222
1331
0
69621.9
234.1
14208.5 0
6158.7
189.6
475.9
Quercetin
0
3380.2
944
1046.6
0
74.7
0
12.7
3484.5
639.8
732.5
comp_417.12(1)
0
72548.3
6036.8
9254.7
0
62882.9
11794.7
14270.2 0
60209.4
7794.5
10971.6
comp_417.12(2)
0
32815.3
2874.7
4656.9
0
95921.3
18958.1
24810
25253.4
3469.8
4843.4
0
0
0
0
1045.3
Data from POP369 were collected in two successive years (2011 and 2012) while POP356 was analysed in 2011 only. Ranges are collected from genotypes scores
averaged across the harvests. Units for trait studied are following: FD (scale), TSS (°Brix), Firmness (N: newton), PPO (change in A420/g/minute), AsA and
polyphenols compounds (concentration). N.B.: comp_417.12 (1) and comp_417.12 (2) are unknown polyphenols compounds identified from LC-MS quantification
analysis, represented by their molecular weight.
high score (Figure 3A). In 2012, 63 genotypes from
POP369 with multiple harvests exhibited different trends
for FD scores, comprising 23 increasing, seven decreasing, 19 stable high and 14 stable low FD genotypes, as
the season advanced (Figure 3B). POP356 in 2011 had
48 genotypes with multiple harvest, also exhibited four
different trends where seven genotypes exhibited increasing, 12 genotypes decreasing and 29 genotypes did
not show any variation of FD score between the harvest
dates, with 24 genotypes scoring consistently low, and
five exhibiting a consistently high score (Figure 3C).
Over all in both populations across the years, over 50%
genotypes were consistent in their trend of susceptibility
either consistently low or consistently high.
In the POP369 population, weak correlations of r =
0.357 (P < 0.0001) and r = 0.27 (P < 0.0001) were observed between FD and harvest date in 2011 and 2012,
respectively, although no such significant correlation
was found in the POP356 population in 2011. Analysis
of variance in the POP369 population indicated a significant effect of year, explaining 4% of the phenotypic variation in FD (P < 0.001), whilst the effect of genotype and
harvest date accounted for a higher proportion of the
phenotypic variation, at 54% (P < 0.0001) and 23% (P <
0.0001), respectively. Although interaction between genetics and harvest date was not significant, the effect of
the genetics x year interaction accounted for 22% of the
phenotypic variation in FD (P < 0.05).
Fruit firmness and TSS
In 2011, TSS for both populations ranged from 10 to
13.5 °Brix. In 2012, TSS ranged from 9 to 14 °Brix for
POP369. However, no significant correlation was observed between FD and TSS (Table 2). Fruit firmness
ranged from 15 to 45 N for both populations in 2011,
while in 2012 the fruit from the POP369 population had
a slightly narrower range of 15 to 36 N. In 2012, fruit firmness showed a weak but significant (P < 0.01) correlation
Saeed et al. BMC Plant Biology 2014, 14:241
/>
Figure 3 (See legend on next page.)
Page 7 of 18
Saeed et al. BMC Plant Biology 2014, 14:241
/>
Page 8 of 18
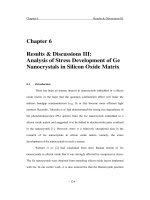
(See figure on previous page.)
Figure 3 Mean friction discolouration (FD) scores arranged by harvest dates for multiple harvests of genotypes. A) Mean FD scores
arranged by harvest date for POP369 in 2011, B) Mean FD scores arranged by harvest date for POP369 in 2012, C) Mean FD scores arranged by
harvest date for POP356 in 2011. Genotypes with multiple harvests for individual tree were divided into four distinct groups a) represents the
seedlings with increasing FD trend during the season b) represents seedlings with decreasing trends c) represents seedlings with consistent high
FD susceptibility d) represents consistent low FD susceptibility.
with FD for POP3569, however neither population
POP369 or POP356 showed any significant correlation
between FD and fruit firmness in 2011 (Table 2).
Polyphenolic compound, AsA concentration and PPO
activity in pear segregating populations
A subset of 17 polyphenol compounds was identified by
using the QuantAnalysis software. This subset included
flavanols, flavonols, procyanidins, two unknown compounds [417.12 (1) and 417.12 (2)] and chlorogenic acid.
Chlorogenic acid was the most abundant polyphenol
found in pear fruit peel in both populations in both years.
The concentration of all 17 polyphenolic compounds varied among individual progeny in both populations, and
showed significant correlation with FD for some compounds, however none showed high correlation values
with FD (Table 2). Overall these compounds are negatively
correlated with FD, as is clear in Table 2.
Although individual progeny exhibited a wide range of
PPO activity in fruit for both years, PPO activity was
weakly correlated with FD for POP369 in 2012 only. A
weak yet significant negative correlation between concentration of some of the polyphenol compounds and PPO
activity was observed in the 2012 data from population
Table 2 Correlation table (r) for all trait data in relation to harvest date, friction discolouration, total soluble solids and
firmness
POP369 (2011)
Trait
Harvest date FD
TSS
Friction discolouration
0.36**
Total soluble solids
ns
ns
Firmness
ns
ns
0.29**
Polyphenol oxidase
−0.36**
ns
ns
Ascorbic acid
0.31**
ns
ns
Chlorogenic acid
−0.19*
Cryptochlorogenic acid
ns
Neochlorogenic acid
Catechin
POP369 (2012)
Firmness Harvest FD
date
POP356 (2011)
TSS
Firmness Harvest FD
date
0.27**
TSS Firmness
ns
−0.34**
0.16*
ns
ns
−0.14*
−0.21** 0.16*
ns
ns
ns
ns
0.15*
0.20**
0.28** ns
−0.25**
ns
ns
ns
ns
ns
ns
ns
−0.15*
0.54**
ns
ns
ns
−0.27** 0.18*
ns
−0.31**
ns
0.2**
ns
−0.18**
−0.12*
ns
0.27**
−0.27** ns
ns
−0.25**
ns
ns
ns
−0.2 **
ns
ns
0.21**
ns
ns
ns
ns
−0.20**
ns
ns
ns
ns
ns
ns
0.22**
ns
ns
0.21*
0.44**
−0.19**
−0.21** 0.15*
0.30**
ns
−0.20** ns
0.27**
Epicatechin
ns
ns
ns
0.42**
ns
−0.15*
0.30** 0.40**
ns
−0.18** ns
0.15*
Procyanidin B2
ns
−0.23** 0.19*
0.27**
−0.18*
ns
0.19** 0.22**
ns
−0.24** ns
0.21**
ns
−0.15*
Isorhamnetin 3-galactoside −0.22*
ns
ns
−0.21**
Isorhamnetin rutinoside
−0.37**
−0.25** ns
ns
−0.30 ** ns
p-coumaryl quinic acid
−0.21*
−0.2*
0.27** 0.23**
−0.23**
ns
0.20** ns
ns
ns
ns
ns
Quercetin galactoside
−0.17*
ns
ns
ns
−0.18**
−0.15*
ns
−0.13*
ns
ns
ns
Quercetin glucoside
−0.25**
ns
ns
ns
−0.32**
−0.20** 0.19** 0.25**
−0.20**
ns
ns
ns
Quercetin arabinoside
−0.22**
−0.21*
ns
ns
−0.24**
ns
ns
ns
ns
ns
0.16**
ns
ns
ns
ns
ns
ns
0.19**
ns
ns
ns
ns
ns
0.23**
0.23**
ns
Quercetin rhamnoside
−0.25**
−0.19*
ns
ns
ns
ns
ns
ns
ns
ns
ns
Quercetin rutinoside
−0.28**
ns
ns
ns
−0.27**
−0.19** ns
0.16*
−0.20**
ns
ns
ns
Quercetin
0.34**
0.22**
ns
ns
ns
−0.17*
ns
ns
0.16**
ns
ns
0.37**
comp_417.12 (1)
−0.20*
−0.21*
ns
ns
−0.24**
ns
ns
ns
ns
ns
ns
0.17**
comp_417.12 (2)
ns
−0.22** ns
ns
−0.24**
ns
ns
ns
ns
ns
ns
0.15*
Data from POP369 were collected in two successive years (2011 and 2012) while POP356 was analysed in 2011 only. N.B.: comp_417.12 (1) and comp_417.12 (2)
are unknown compounds identified from LC-MS quantification analysis, represented by their molecular weight. Units for trait studied are following: FD (scale), TSS
(°Brix), Firmness (N: newton), PPO (change in A420/ g/minute), AsA and polyphenols compounds (concentration). comp_417.12 (1) and comp_417.12 (2) are unknown
polyphenol compounds identified from LC-MS quantification analysis, represented by their molecular weight.
Note: * = P < 0.05 ** = P < 0.01 and ns = non-significant.
Saeed et al. BMC Plant Biology 2014, 14:241
/>
Page 9 of 18
population (Additional file 4: Table S2). The largest cluster, which comprised 22 QTLs associated with fruit firmness, PPO activity, concentration of AsA and five
polyphenolic compounds (catechin, epicatechin, procyanidin B2, isorhamnetin rutinoside and quercetin), was
identified on LG3 in POP369 for both parents. The largest cluster for both parents of population POP356 is located on LG5, with 11 QTLs associated with the
concentration of polyphenolic compounds [isorhamnetin
galactoside/glucoside, quercetin arabinose/rhamnoside
and compounds 417.12(1) and 417.12(2)].
POP369, where PPO activity and epicatechin concentration exhibited a significant (P < 0.01) correlation
(r = −0.28). AsA concentration showed a significant
correlation with harvest date for both populations in
2011 and no correlation in 2012 for POP369 (Table 2).
No significant correlation was observed between FD
and AsA concentration.
Genetic map construction
Parental genetic maps were constructed for POP369 and
POP356 populations using a subset of 1144 and 1357
polymorphic SNPs, respectively. The genetic maps for
QTL analysis were modified from the maps described in
[47], by removing dominant markers with the segregation ratio 3:1 in order to improve their utility for QTL
mapping. Numbers and segregation types of polymorphic, mapped, and revised for QTL map markers are
provided in Table 3 and for detailed maps used for QTL
analysis see Additional file 2: Figure S2. The revised parental maps of the POP369 population comprised 173
and 265 markers for the male and female parents, respectively. The POP369-male parental map spanned
858.2 cM (one SNP every 4.9 cM) over 23 groups across
the 17 LGs, of which LGs 2, 9, 11, 12, 13, 14 and 17
were split into two parts. The POP-369 female parental
map spanned 1027.9 cM (one SNP every 3.3 cM) over
20 groups across the 17 LGs, of which LGs 10 and 13
were split into two, and LG5 into three parts. The map
of POP356-female consisted of 398 markers covering
885.9 cM and had 28 groups across the17 LGs, with 202
markers in common with the POP369-female map. The
POP356-male map comprised 353 SNPs covering 1114.6
cM and spanned 23 groups across the 17LGs (Additional
file 2: Figure S2a, b).
QTL for friction discolouration of fruit
As FD was non-normally distributed in both populations
(Additional file 5: Figure S3), the Kruskal-Wallis test was
used for QTL analysis. A total of 27 QTLs over 10
chromosomal regions (LGs 2, 3, 4, 7, 9, 10, 13, 14, 15
and 16) were detected for FD, using the average and
maximum score of multiple harvests in 2011 and 2012
for population POP369 (Table 4), with the proportion of
genotype explained by each QTL ranging from 3.5% to
13%. In general, the QTLs in common were for average
and maximum FD scores (Table 4). The QTL detected
on LG14 derived from the POP369-female parent was
stable between years when either the maximum or average FD score data classes were used, with the homozygous AA genotype for marker ss527788030 linked to
low FD score (Figure 4A). The QTL on LG7 of the
POP369-male parent was not stable between years, as it
only exhibited a strong effect in 2012, however a weaker
effect QTL in 2011 was identified in another location of
the same LG for the same parent. The homozygous AA
genotype for marker nullss475876200 from LG7 was
linked to low FD score in 2012 (Figure 4B). The marker
information from QTLs on LG7 and LG14 from POP369
was combined into four possible genotypic combinations
(Table 5) and compared with phenotype data from those
multi-harvest date seedlings categorised into the four FD
groups shown in Figure 3A,B (i.e. consistently high and
low FD score, increasing and decreasing FD score with advancing harvest). In 2012, seedlings lacking both LG7 and
LG14 QTLs (AB genotype for both SNP markers) exhibited a consistently high FD score (10), increasing (22) or
Scope of QTLs identified for genetic control of fruit traits
QTLs were detected for 22 fruit traits, including FD
score (Table 4), TSS, fruit firmness, PPO activity, AsA
concentration and LC-MS peak area (response/min) for
17 polyphenolic compounds. A total of 105 QTLs with
significance of P < 0.005 were detected for the 22 traits
over two years for the POP369 population (Additional
file 3: Table S1), and 77 QTLs for the POP356
Table 3 Number and segregation type of markers in QTL maps of the POP369 and POP356 pear populations
POP369
POP356
Marker
segregation
Pear
SNPs
Apple
SNPs
Total
Marker
segregation
Pear
SNPs
Apple
SNPs
Total
Marker
segregation
Pear
SNPs
Apple
SNPs
Total
ABxAA/BB
144
69
213
00xA0/00xB0/BBxB0
18
96
114
ABxAA/BB
90
95
185
ABxAB
16
37
53
A0xA0/B0xB0
3
31
34
ABxAB
92
51
143
BB/AAxAB
8
37
45
A0x B0
1
2
3
BB/AAxAB
97
127
224
A0x AB/B0xAB/ABxB0
3
2
5
Total
168
143
311
Total
25
131
156
Total
279
273
552
Saeed et al. BMC Plant Biology 2014, 14:241
/>
Page 10 of 18
Table 4 Quantitative Trait Loci (QTL) detected for friction discolouration (FD) in POP369 and POP356 pear populations
Year
Data type
Parent
LG
Position
SNP marker
Kruskal-Wallis (K*)
Significance
(%) Variance
2011
average
POP369- female
2
59.44
nullss475883075
8.9
P < 0.005
11.37%
2011
average
POP369- female
15
6
ss527788075
6.3
P < 0.05
10.26%
2011
average
POP369- female
14
4.93
ss527788030
6.1
P < 0.05
6.22%
2011
average
POP369- female
3
48.09
ss527788418
5.8
P < 0.05
8.30%
2011
max
POP369- female
2
59.44
nullss475883075
10.1
P < 0.005
12.09%
2011
max
POP369- female
16
42.79
nullss475878310
6.7
P < 0.01
7.30%
2011
max
POP369- female
14
4.93
ss527788030
5.1
P < 0.05
5.50%
2011
max
POP369- female
3
48.09
ss527788418
5.0
P < 0.05
6.86%
2012
average
POP369- female
3
26.02
ss527788282
6.2
P < 0.05
8.74%
2012
average
POP369- female
14
8.8
ss527788968
3.7
P < 0.1
8.16%
2012
max
POP369- female
3
26.02
ss527788282
9.0
P < 0.005
12.85%
2012
max
POP369- female
14
4.93
ss527788030
3.8
P < 0.1
5.72%
2012
max
POP369- female
10
36
nullss475879653
3.5
P < 0.1
3.48%
2011
average
POP369- male
2
12.09
nullss475877109
8.2
P < 0.005
10.05%
2011
average
POP369- male
14
3.4
ss527789200
6.9
P < 0.01
8.92%
2011
average
POP369- male
13
2.75
ss475882576
5.1
P < 0.05
6.07%
2011
max
POP369- male
2
12.09
nullss475877109
9.1
P < 0.005
10.70%
2011
max
POP369- male
14
3.4
ss527789200
7.1
P < 0.01
9.15%
2011
max
POP369- male
16
16.29
nullss475878313
5.7
P < 0.05
6.29%
2011
max
POP369- male
13
2.75
ss475882576
5.3
P < 0.05
6.74%
2011
max
POP369- male
7
16.79
ss475878863
5.2
P < 0.1
9.07%
2012
average
POP369- male
7
42.04
nullss475876200
8.0
P < 0.005
8.34%
2012
average
POP369- male
4
25.6
ss475876768
7.3
P < 0.01
8.68%
2012
max
POP369- male
7
42.04
nullss475876200
7.0
P < 0.01
8.67%
2012
max
POP369- male
2
20.08
ss475877562
6.7
P < 0.05
8.34%
2012
max
POP369- male
4
25.59
ss475876768
6.7
P < 0.01
7.16%
2012
max
POP369- male
9
9
ss527787770
4.3
P < 0.05
5.02%
2011
average
POP356- female
11
23.60
ss527788944
12.6
P < 0.005
9.70%
2011
average
POP356- female
15
3.44
ss527789584
8.34
P < 0.05
8.89%
2011
average
POP356- female
5
0
ss475879840
6.8
P < 0.01
4.37%
2011
max
POP356- female
11
2.96
ss475880309
13.3
P < 0.005
10.46%
2011
max
POP356- female
15
3.44
ss527789584
8.62
P < 0.05
8.33%
2011
average
POP356- male
11
20.60
ss527788944
12.6
P < 0.005
9.70%
2011
average
POP356- male
2
3.17
ss527788737
8.52
P < 0.005
6.00%
2011
average
POP356- male
15
85.81
ss527789303
8.3
P < 0.05
8.89%
2011
average
POP356- male
16
104.88
ss527789436
7.4
P < 0.01
6.94%
2011
max
POP356- male
11
20.60
ss527788944
13.4
P < 0.005
10.17%
2011
max
POP356- male
2
3.17
ss527788737
8.7
P < 0.005
7.52%
2011
max
POP356- male
15
85.81
ss527789303
8.6
P < 0.05
8.33%
QTLs were identified using average and maximum FD score from multiple harvests of the same seedling. SNPs are presented using the NCBI dbSNP accession
number (ss#). Apple SNPs are represented with an accession number starting with ‘4’ while pear SNPs accessions start with ‘5’.
decreasing (4) with late harvest date, with none that
showed a consistently low FD. However, the seedlings with
genotypes associated with low FD for both QTLs (AA
genotype for both markers) had consistently low (6),
decreasing (6) and increasing (9) FD scores during the season, while there were no seedlings with consistently high
FD. The trend was not as clear in 2011, probably due to
the weaker effect of the LG7 QTL in this year however,
Saeed et al. BMC Plant Biology 2014, 14:241
/>
Page 11 of 18
Figure 4 Graphical representation of stable QTL controlling fiction discolouration (FD) across the years. A) represents stable QTL for
POP369-female parent on LG14 and B) represents QTL on LG7 from POP369-male parent.
four seedlings having consistently high FD scores also
lacked the low FD QTL genotypes for both LG7 and
LG14. Another FD QTL for POP369-female was located
on LG3, however, the allelic trend was inconsistent between years (Figure 5).
In total, 12 QTLs over five chromosomal regions (LGs
2, 5, 11, 15 and 16) were detected in the POP356 population using the average and maximum FD score, with
genotypic variation explained ranging from 4.4% to
10.5% (Table 4). The QTLs on LGs 11 and 15 were common to both parental maps in the POP356 population.
Common QTLs between populations are located on
LG2 of the POP356-male parent and both parents of
population POP369, however, for POP369-female parent
this QTL was observed in 2011 only (Table 4).
QTLs for fruit firmness, TSS, PPO activity and AsA
concentration
A QTL linked to fruit firmness identified at the top of LG3
for both parents of both populations was stable between
2011 and 2012 for the POP369-male parent. Although TSS
exhibited no stable QTL between years, TSS QTLs on LGs
2 and 16 were detected for both parents of POP369 in
2012. A QTL associated with PPO activity identified on
LG3 of POP369-male was stable across the years and was
detected only in 2012 in the POP369-female parent. The
POP356 population had a QTL for PPO activity on LG2
for both parents, however, no QTL was detected on LG3 as
for POP369 (Additional file 3: Table S1). Other QTLs associated with PPO activity that were unstable between years
were located on LGs 5, 9 and 14 for POP369, and LGs 6
and 17 for POP356. QTLs influencing fruit AsA concentration were identified on LG3 of all four parental maps in
2011 only (Additional file 3: Table S1 and Additional file 4:
Table S2).
QTLs for polyphenolic compound concentration
A total of 86 and 64 QTLs were detected that were associated with the concentration of 17 polyphenolic compounds
in pear fruit for POP369 and POP356, respectively. QTLs
detected for polyphenols were identified on all LGs, except
LG 4, 6 and 10 for population POP369, and LG 4, 13 and
16 for population POP356 (Additional file 3: Table S1 and
Additional file 4: Table S2). The largest clusters of QTLs
Table 5 Genotypic effect of the friction discolouration (FD) QTLs detected in the POP369 population in 2011 and 2012
2012
2011
LG14
LG7
Consistent high
Consistent low
Increasing
Decreasing
Consistent high
Consistent low
Increasing
Decreasing
AA (+)
AA (+)
0
6
9
6
0
2
2
0
AA (+)
AB
23
16
16
0
0
11
4
2
AB
AA (+)
6
10
9
2
0
8
0
0
AB
AB
10
0
22
4
4
8
2
2
Seedlings are grouped according to their seasonal trend for FD susceptibility as illustrated in Figure 3. The markers with the most significant Kruskal-Wallis value
were used (Table 4): ss527788030 and nullss475876200 for LG14 and LG7, respectively. Alleles favourable for a low FD score are marked with a “+”.
Saeed et al. BMC Plant Biology 2014, 14:241
/>
Page 12 of 18
Figure 5 Friction discolouration (FD) QTL on LG3 for parent POP369-female; opposing allelic trend in 2011 and 2012.
associated with polyphenol concentration were located on
LG3 of POP369 and LG5 of POP356.
QTL stability between years and parents
Additional file 3: Table S1 and Additional file 6: Figure S4
show that major stable QTLs exhibited across the years for
the POP369-male parent were for control of fruit firmness, and PPO activity on LG3, as well as concentration
of chlorogenic acid on LG9, catechin on LG3 and LG9,
epicatechin on LG3, quercetin arabinose and unknown
compounds 417.12(1) and 417.12(2) on LG5. QTLs
that were stable across 2011 and 2012 in the POP369female parent were associated with concentration of
chlorogenic acid and cryptochlorogenic acid on LG1,
catechin on LG17, epicatechin on LG3 and LG14, and
procyanidin B2 on LG14. Although QTLs for chlorogenic acid and cryptochlorogenic acid were identified
in both years at the same location, in 2011 the K value
(P < 0.01) was lower than the set threshhold (P < 0.005).
Clusters of QTLs that were identified on LG3 and associated with fruit firmness and epicatechin concentration
were stable between 2011 and 2012, and between parents
of each of the two populations as well as across these populations. In addition, for population POP369, several other
QTLs were conserved between parents, however, were
identified in one year only. Examples for 2012 include:
QTLs on LG2 and LG16 for control of TSS, chlorogenic
acid concentration on LG9, catechin on LG3, and procyanidin B2 on LG3. QTLs associated with iso-rhamnetin galactoside/glucoside concentration were observed on LG2
Saeed et al. BMC Plant Biology 2014, 14:241
/>
Page 13 of 18
in 2011 only, as well as quercetin on LG3 and LG15.
Population POP356 also exhibited QTLs conserved between the parents: control of fruit firmness on LG3, PPO
activity on LG2, concentration of AsA on LG3, concentration of cryptochlorogenic acid on LG9, catechin and epicatechin on LG3, procyanidin on LG15, iso-rhamnetin
galactoside/glucoside on LG5 and LG6, iso-rhamnetin
rutinoside, quercetin galactoside and quercetin arabinose
on LG5, quercetin rhamnoside on LG3, quercetin rutinoside on LG2 and LG7, quercetin on LG12, and unknown
compounds 417.12(1) and (2) on LG5.
QTL co-location between traits
In total, 10 genomic regions exhibited QTLs for different
fruit traits that co-located (Additional file 3: Table S1 and
Additional file 4: Table S2; Additional file 6: Figure S4). A
QTL located on LG14 of POP369-female was for FD, PPO
activity and chlorogenic acid concentration in 2011
(Figure 6). For POP369-male parent stable QTL for epicatechin and procyanidin B2 is also located at the same location of LG14. For POP369-male, QTLs associated with
firmness, PPO activity, and concentration of catechin and
epicatechin in both years and procyanidin B2 in 2011 only,
co-located on LG3 for both 2011 and 2012. For the
POP356-female parent, QTLs co-locating at LG3 are associated with fruit firmness and concentration of AsA, catechin, epicatechin and quercetin rhamnoside. Similar
group of QTLs was also detected for POP356-male parent
on LG3 (Additional file 6: Figure S4). QTLs controlling
concentration of the flavanols isomers (catechin and epicatechin) were identified on LG3 in the same genomic location across the populations and between the two years
of the study, except for POP369-female, where a potential
QTL identified for catechin in 2011 was lower than the set
threshold (i.e. P < 0.01). This parent also exhibited stable
QTLs on LG14 for epicatechin and procyanidin B2 between the two years. Parent POP369-male exhibited
QTLs for catechin and epicatechin on LG3 across both
years, and for procyanidin B2 only in 2012 on LG3,
while the POP369-female parent exhibited QTLs on
LG3 for epicatechin in both years, and in 2012 only for
epicatechin and procyanidin B2. Potential QTLs associated with concentration of catechin and procyanidin
on LG3 were detected in 2011, however, the significance was lower than the set threshold (P < 0.01) (data
not shown). In POP356, both parents exhibited QTLs
on LG3 associated with concentration of catechin and
epicatechin, but not for procyanidin B2.
Discussion
The relationship of FD to fruit maturity
FD in pear is recognised as a complex postharvest disorder that is highly influenced by both genetic and environmental factors (growing area, season etc.), as well as
those related to development (harvest maturity). Our
study supports this view, based on clear variation in susceptibility to FD, not only among the seedlings of the
two segregating populations but also among fruit from
the same seedling. This indicates that, while the genetic
component of FD control is significant, there is also a
substantial non-genetic effect. The significant correlation
of FD to harvest date in population POP369 emphasizes
the role of fruit maturity in the development of this disorder. Harvest of fruit both before and after optimal maturity can increase the potential for development of FD.
Kvåle [48] reported that fruit harvested before the climacteric peak are more susceptible to FD than are late
harvested fruit. However, this hypothesis was later contradicted by Burger et al. and Mitcham et al. [50,53],
who found that late harvested fruit were more
60000
9
1400
7
FD (S core)
6
5
4
3
2
50000
1200
Chlorogenic acid (conc.)
PPO activity ( A420 g-1minute-1)
8
1000
800
600
400
40000
30000
20000
10000
1
200
0
0
AA
AB
AA
AB
AA
ss527788030
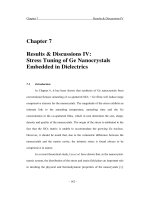
Figure 6 Common QTLs controlling friction discolouration (FD) and other variables on LG14 in 2011.
AB
Saeed et al. BMC Plant Biology 2014, 14:241
/>
susceptible to FD. We noted these opposing trends in
the interspecific segregating populations in our own
study, as results from POP369 backed up the observation that late harvested fruits are more prone to FD,
whereas POP356 exhibited the opposite trend, indicating
that the effect of fruit maturity is a variable that is based
on genetics. Our study hence confirms the hypothesis by
Burger et al. [50] that the relationship between FD and
fruit maturity is not always consistent among genotypes.
In their study involving two pear genotypes only, ‘Packham’s Triumph’ showed greater susceptibility to FD at
late harvest compared with earlier harvest, while ‘Comice’ exhibited the opposite trend. Our analysis using the
variation among hundreds of individual genotypes has
highlighted even more clearly the complexity of the relationship between FD and fruit maturity.
Pear maturity indices are complex and generally not reliable across the species as European and Asian pear cultivars have different indices [59], which are not reliable for
interspecific progeny between Asian and European type
pear. The issue of optimum time of harvest is especially
challenging for breeding populations obtained from interspecific Asian x European hybridisation. Although the
indices currently employed to determine maturity for harvest (firmness, total soluble solid contents and ground
colour) are the same as for apple, these indices may well
differ between genotypes, orchards and/or seasons. In this
study, fruit firmness and TSS were measured in an attempt to evaluate fruit maturity of selected genotypes.
While these traits segregated in both progenies, no relationship with susceptibility to FD was identified. This finding underlines the need for development of accurate fruit
maturity descriptors in pear, especially for individual new
cultivars of interspecific hybrids.
The potential relationship between FD and fruit
polyphenol content
Polyphenols are specific substrates for PPO and participate
in the browning mechanism underlying FD. Chlorogenic
acid has been found to be the most abundant polyphenol
present in pears [60–62] and we confirmed this finding in
both segregating populations. Neither this nor any other of
the fruit polyphenolic compounds quantified over two years
in two segregating populations totaling 250 seedlings
showed strong phenotypic correlation to FD (Table 2). This
finding conflicts with previous reports, which demonstrated
in a small number of commercial European pear cultivars
that certain phenolic compounds, such as chlorogenic acid,
act as a rate-limiting factor in FD incidence [4,48]. However, our experimental conditions utilising over 250 individual genotypes of a mixed P. bretschneideri, P. pyrifolia and
P. communis heritage are very different to these earlier
studies utilising a few commercial cultivars with known
maturity and a much narrower P. communis species
Page 14 of 18
background. Pear has very distinct cultivar variation for
susceptibility to FD, as some varieties are recognized to be
more susceptible to FD than others that have lower or almost no tendency to develop FD [13]. Our statistical analysis of a large number of traits in over 250 individual
genotypes from interspecific crosses strengthens the hypothesis that the relationship between FD and rate-limiting
polyphenols cannot be generalised and therefore cannot be
used as a selection criterion for new cultivar breeding.
However, although the relationship between polyphenol
compounds and FD may not hold true at the global phenotype concentration, it may be valid at the concentration of
a QTL explaining part of the variation in a specific genetic
background, justifying our decision to dissect and compare
the genetic control of FD and other fruit traits by QTL analysis. Indeed, we found that FD QTLs co-located with
QTLs governing other traits that had been suggested previously to be associated with susceptibility to FD.
QTL co-location
Co-location of QTLs associated with different traits may
mean that the QTLs for both traits are tightly linked, or
even that the same gene controls both. In the second
situation this helps provide a clue to as to the nature of
the molecular control underlying both traits.
An example is the QTL located on LG14 of POP369female parent that was common for FD, PPO activity and
chlorogenic acid concentration (Figure 6; Additional file 3:
Table S1) along with epicatechin and procyanidin B2.
However QTL for PPO and chlorogenic acid were detected in 2011 only but this could explain the relationship
between FD, enzyme (PPO) and substrate (chlorogenic
acid). Although we did not identify any strong statistical
correlation among the phenotypes considered as a whole
(Table 2), when considering only the QTL cluster on
LG14 of POP369-female, we observed that individuals in
POP369 carrying the low FD allele exhibited both low
PPO activity and a high concentration of chlorogenic acid
(Figure 6). An opposing trend between chlorogenic acid
and FD indicates that although the substrate amount is
not crucial in terms of browning in interspecific pears, the
PPO activity may play an important role. In this case, we
could hypothesise that a candidate gene influencing PPO
activity located in this genomic region of POP369-female
parent, but not in POP369-male or POP356-male, might
contribute to FD susceptibility via a stimulation of enzymatic browning in pear.
A second example is the QTL cluster for firmness, PPO,
catechin and epicatechin detected between 0 and13 cM on
LG3 of parent POP369-male (Additional file 3: Table S1;
Figure S4). Polyphenols, such as catechin and epicatechin,
are substrates for PPO during the enzymatic browning that
characterises FD. Clearly, there are opportunities for further
analysis, including mining the European [63] and Chinese
Saeed et al. BMC Plant Biology 2014, 14:241
/>
[45] pear genome sequences in the QTL region to identify
candidate genes. Although no candidate gene for the control of such compounds has been identified in the syntenic
region on LG3 in the apple genome [22] to date, the apple
genome is another clear source of information.
Polyphenol content of fruits and vegetables is dependent
on fruit maturity, pre- and post-harvest operations as
well as genetic characteristics [64,65], and firmness is
one of the most reliable indicators of maturity in commercial European pear cultivars [66]. Our identification
of a stable QTL on LG3 across years and populations,
and in common for control of fruit firmness, PPO activity and polyphenol concentration, confirms reports of
the physiological relationship between firmness and maturity in the accumulation of polyphenols [5,49,53].
Procyanidin B2 is an oligomeric compound, formed
from catechin and epicatechin molecules and hence
might be predicted to exhibit QTLs in the same region
as catechin and epicatechin. Parent POP369-female exhibits similarly located QTLs for epicatechin and procyanidin B2 on LG14.
Significance of stability of detected QTLs
Despite the complexity of the FD disorder and strong influence of environmental and developmental factors, we
were able to identify 27 and 12 QTLs for POP369 and
POP356, respectively (Table 4) by using average and
maximum FD score. None of these QTLs can be
regarded as a major QTL, as the strongest among them
explains only 12.48% of the phenotypic variation. As we
collected phenotypic data for the POP369 population in
two consecutive seasons (2011 and 2012), QTLs could
be verified for their stability across years. A stable QTL
across the years 2011 and 2012 was identified on LG14
for parent POP369-female (Figure 4). Although the suggested FD QTL on LG7 was below the threshold of detection (Figure 4B) in 2011, a likely reason for lower
significance could be the large environmental and developmental effect on FD incidence. Although a FD QTL
is located on LG3 for POP369-female parent, the allelic
trend is different between years (Figure 5), which implies
that this QTL is an artefact. Population POP356 had
only one year (2011) of phenotypic data, so it is not possible to verify QTL stability across years. However, this
rather inbred population exhibits genomic regions on
LG11 and LG15 that are conserved between its parents
(Table 3).
Our QTL analysis indicated that FD is a polygenic trait
controlled by many small effect QTLs, of which only a
subset are stable across years. The QTLs on LG7 and
LG14 provide closely linked markers, which are candidates
that might be theoretically used for MAS. However, these
QTLs individually explain only 8% of the phenotypic variation, which would provide only limited genetic gain if
Page 15 of 18
they were used for selection in a breeding population.
Also, when the QTLs are considered in combination, none
of the seedlings with the marker genotype associated with
low FD exhibited a consistently high score for FD in 2012
and 2011. No seedlings with the other homozygous AB
type allelic pair appeared to have a consistently low FD
score in 2012, but in 2011, eight seedlings of this group
exhibited a consistently low score (Table 5). These results
point towards the possibility of using these QTLs in combination for MAS in bi-parental populations.
The polygenic control of FD by small effect QTLs suggests that genomic selection may be a more suitable approach to cull susceptible seedlings early in the breeding
cycle. Genomic selection makes use of genome wide
markers to predict total genetic value instead of phenotype and has been evaluated recently in apple [67]. In genomic selection, a prediction equation is established from
genotype and phenotype data collected from the ‘training
population’ and this prediction equation is used later to
estimate genomic estimated breeding values (GEBVs) of
individual progeny in the ‘selection population’ [68].
A number of QTLs for other fruit traits were stable
between years. Parent POP369-male exhibited stable
QTLs across years associated with fruit firmness, PPO
activity and concentration of chlorogenic acid, cryptochlorogenic acid, catechin, epicatechin, quercetin arabinose, as well as the unknown compounds 417.12(1)
and 417.12(2) (Additional file 3: Table S1). Some QTLs
were stable across the years for population POP369 and
were detected in both parents. For example, a stable
QTL controlling fruit firmness was located on LG3 and
was stable across years and detected in the same location
in both parents of POP369 and POP356. Likewise,
another QTL associated with chlorogenic acid concentration was identified on LG9 for parents of both populations and was stable across both years (Additional
file 3: Table S1 and Additional file 4: Table S2).
From epidemiological studies, there is evidence that
consumption of dietary anti-oxidants through eating
polyphenol-rich fruits and vegetables can enhance cellular defence and help to guard against diseases, such as
cancer, coronary heart disease and osteoporosis. Chlorogenic acid has strong anti-oxidant properties and is the
most abundant type of polyphenol in pear. Breeders
could use this QTL associated to chlorogenic acid to select genotypes rich in this compound. Furthermore, candidate genes controlling fruit firmness in pear might be
identified by utilising the stable QTL on LG3, to identify
candidate genes in the aligned genome sequences of
both Chinese and European pear, as well apple.
QTLs orthologous between apple and pear
Pear belongs to the Pyreae subfamily of the Rosaceae,
which also includes apple, and their genomes are syntenic
Saeed et al. BMC Plant Biology 2014, 14:241
/>
[69]. Syntenic species conserve QTLs for similar traits and
this synteny information opens new possibilities for identification of candidate genes controlling similar traits across
species. QTLs associated with concentration of chlorogenic acid and its isoforms, i.e. cryptochlorogenic acid and
neochlorogenic acid, located on LG17 of the POP356female parent are orthologous to a QTL identified for
control of chlorogenic acid concentration in apple [22].
Interestingly, in the POP369 population both parents have
QTLs for the same variables on LG9, which is homeologous to LG17 in apple [70] and pear [45]. This homology
in the Malus and Pyrus genomes indicates that these
QTLs may be derived from paralogous gene copies from
the Pyreae whole genome duplication [70]. In apple, a
QTL for chlorogenic acid is also located at the bottom of
LG17, where the HCT/HQT (hydroxy cinnamate transferase/hydroxy quinate transferase) gene is located [22]. The
Pyrus HCT/HQT gene is therefore a strong candidate gene
for the LG17 QTL from POP369-female.
A stable QTL governing pear fruit firmness is located
on LG3 in the same region where a QTL for apple firmness has been detected previously [71], however, no apple
candidate gene has yet been proposed for this QTL.
Conclusions
Unlike other more studied fruit species, such as tomato
and apple, genetic information about the control of expression of pear fruit characters has been scanty to date.
Of four reported QTL mapping studies in pear (two
European, one Chinese and one interspecific between
European and Chinese pear), only one concerns fruit
traits [34]. None of these studies employed gene-rich
and SNP-based genetic maps. These new generation
maps provide advantages as they are derived from the
Pyrus genome sequence and hence identified QTLs can
be used to detect the candidate genes for these traits in
the genome sequence. We have utilised the first SNPbased genetic maps in pear [47] to identify QTLs for 22
variables, including FD, using two interspecific segregating populations (POP369 and POP356). QTL clusters
were found for all 22 variables with a number of QTLs
being stable across years, parents and populations. Our
QTLs associated with fruit firmness and concentration
of AsA and polyphenolic metabolites are the first reported for pear. Most notably, the QTLs we detected
that influence susceptibility to FD are the first fruit disorder QTLs to be reported in a tree species. This study
clearly demonstrates that this postharvest disorder is
controlled by multiple small effect QTLs, unlike fruit
quality attributes, such as firmness and skin biochemical
composition that are controlled by small and medium effect QTLs. In future, candidate genes for QTLs controlling firmness, PPO activity, and polyphenolic compound
concentration will be identified utilising the reference
Page 16 of 18
genome sequences of pears ‘Bartlett’, ‘Dangshansuli’ and
syntenic apple ‘Golden Delicious’. This will assist fruit
biologists, postharvest scientists and pear breeders to
develop an understanding of the genetic control of this
highly challenging postharvest disorder. The polygenic nature of FD genetic control indicates that it will be difficult
to apply marker-assisted selection, however, genomic selection could be employed to select elite genotypes with
lower or no susceptibility to FD early in the breeding
cycle. Our results also point towards the need for better
fruit maturity estimation to avoid the noise in phenotypic
data.
Additional files
Additional file 1: Figure S1. Alignment of male parent from POP369
and POP356 to reference map with simple sequence repeat markers.
Linkage group with notation ‘n’ represents reference map, SSR markers
are represented by red colour.
Additional file 2: Figure S2. Genetic linkage maps of POP369 and
POP356 used for QTL analysis (Word file). Figure S2a. Genetic linkage
maps of male and female parents of POP369. Figure S2b. Genetic
linkage maps of male and female parents of POP356.
Additional file 3: Table S1. List of QTLs controlling fruit traits except
FD, for POP369. The Kruskal Wallis test was adopted to identify the QTLs,
as almost all traits were non-normal in distribution. QTLs for each trait are
given for each parent and for both years. SNPs are presented using the
NCBI dbSNP accession number (ss #). Apple SNPs are represented with
an accession number starting ‘4’ while pear SNPs accessions start with ‘5’.
Additional file 4: Table S2. List of QTLs controlling fruit traits except
FD, for POP356. The Kruskal Wallis test was adopted to identify the QTLs
as almost all traits were non-normal in distribution. QTLs for each trait are
given for each parent and for both years. SNPs are presented using the
NCBI dbSNP accession number (ss #). Apple SNPs are represented with
an accession number starting ‘4’ while pear SNPs accessions start with ‘5’.
Additional file 5: Figure S3a. Graphical representation of distribution
of trait data for POP369 in 2011 (Word file). Figure S3b. Graphical
representation of distribution of trait data of POP369 in 2012. Figure S3c.
Graphical representation of distribution of trait data of POP356 in 2011.
Additional file 6: Figure S4. Linkage groups with stable QTLs in
POP369 and POP356.
Competing interests
The authors declare that they have no competing interests.
Authors’ contributions
Designed the experiments: MS JEH DC. Performed the experiments: MS.
Analyzed the data: MS DC. Contributed reagents/experimental material/
analysis tools: DC JJ TMC LB. Wrote the manuscript: MS DC SEG. All authors
have read and approved the paper before submission.
Acknowledgements
This work was partially supported by a grant from the New Zealand Ministry
of Business Innovation and Employment and Prevar™ Limited. MS was
supported by a Massey University doctoral scholarship. We thank Sara
Montanari for providing a reference map, Andrew McLachlan (PFR) for
advice in statistical analysis, Chris Morgan and Marlene Aldworth (PFR) for
picking fruit and Dr Richard Volz (PFR) for critical comments on the
manuscript.
Author details
Centre for Postharvest & Refrigeration Research, Massey University, Private
Bag 11 222, Palmerston North 4442, New Zealand. 2The New Zealand
Institute for Plant & Food Research Limited (Plant & Food Research), Private
1
Saeed et al. BMC Plant Biology 2014, 14:241
/>
Bag 11600, Palmerston North 4442, New Zealand. 3Plant & Food Research,
Motueka Research Centre, Old Mill Road, Motueka 7198, New Zealand. 4Plant
& Food Research, Hawkes Bay Research Centre, Private Bag 1401, Havelock
North, New Zealand.
Page 17 of 18
21.
Received: 23 April 2014 Accepted: 5 September 2014
22.
References
1. Feng X, Biasi B, Mitcham EJ: Effects of various coatings and antioxidants
on peel browning of ‘Bartlett’ pears. J Sci Food Agric 2004, 84:595–600.
2. Agar I, Mitcham E: Commercial handling influences quality and ripening
of Bartlett pears. California Agriculture 2000, 54:34–37.
3. Raese JT: Physiological disorders and maladies of pear fruit. Horticultural
Rev 1989, 11:357–411.
4. Wang CY, Mellenthin WM: Relationship of friction discolouration to
phenolic compounds in ‘d’Anjou’ pears. HortScience 1973, 8:321–323.
5. Mellenthin WH, Wang CY: Friction discolouration of ‘d’Anjou’ pears in
relation to fruit size, maturity, storage and polyphenoloxidase activities.
HortScience 1974, 9:592–593.
6. Arias E, González J, Oria R, Lopez-Buesa P: Ascorbic acid and 4hexylresorcinol effects on pear PPO and PPO catalyzed browning
reaction. J Food Sci 2007, 72:C422–C429.
7. Robards K, Prenzler PD, Tucker G, Swatsitang P, Glover W: Phenolic
compounds and their role in oxidative processes in fruits. Food Chemistry
1999, 66:401–436.
8. Amarante C, Banks NH, Ganesh S: Effects of coating concentration,
ripening stage, water status and fruit temperature on pear susceptibility
to friction discolouration. Postharvest Biol Technol 2001, 21:283–290.
9. Amiot MJ, Tacchini M, Aubert SY, Oleszek W: Influence of cultivar, maturity
stage, and storage conditions on phenolic composition and enzymic
browning of pear fruits. J Agric Food Chem 1995, 43:1132–1137.
10. Bertolini P, Trufelli B: Prevenzione dei danni da sfregamento nelle pere
durante la lavorazione in magazzino–Risultati preliminari [Prevention of the
damage due to friction in pears during storehouse working–Preliminary
results]. Qualità e conservabilità della frutta [Quality and preservability of
fruits]. Notiziario Tecnico CRPV 2002, 65:9–12.
11. Burger GE, Griessel HM, Huysamer M: The effect of fruit maturity and
storage duration on friction discolouration of ‘Packham’s Triumph’ and
‘Doyenne du Comice’ pears. Acta Horticultural 2005, 671:377–384.
12. Hamauzu Y, Hanakawa T: Relation of highly polymerised procyanidin to
the potential browning susceptibility in pear fruits. J Jpn Soc Horticulture
Sci 2003, 72:415–421.
13. Meheriuk M, Prange RK, Lidster PD, Porritt SW: Postharvest disorders of
apples and pears. Ottawa, Ont: Agriculture Canada Publication 1737/E
(revised) 67 pp; 1994.
14. White AG, Brewer LR: The New Zealand pear breeding project. Acta
Horticultural 2002, 596:239–242.
15. Brewer LR, Morgan CGT, Alspach PA, Volz RK: Heritability and parental
breeding value estimates of abrasion-induced skin discolouration on
pear fruit. Acta Horticultural 2011, 909:127–135.
16. Chapman NH, Bonnet J, Grivet L, Lynn J, Graham N, Smith R, Sun G, Walley
PG, Poole M, Causse M, King GJ, Baxter C, Seymour GB: High-resolution
mapping of a fruit firmness-related quantitative trait locus in tomato
reveals epistatic interactions associated with a complex combinatorial
locus. Plant Physiol 2012, 159:1644–1657.
17. Chen FQ, Foolad MR, Hyman J, St. Clair DA, Beelaman RB: Mapping of QTLs
for lycopene and other fruit traits in a Lycopersicon esculentum × L.
pimpinellifolium cross and comparison of QTLs across tomato species.
Mol Breed 1999, 5:283–299.
18. Frary A, Nesbitt TC, Frary A, Grandillo S, Knaap E, Cong B, Liu J, Meller J,
Elber R, Alpert KB, Tanksley SD: fw2.2: a quantitative trait locus key to the
evolution of tomato fruit size. Science 2000, 289:85–88.
19. Dirlewanger E, Cosson P, Boudehri K, Renaud C, Capdeville G, Tauzin Y,
Laigret F, Moing A: Development of a second-generation genetic linkage
map for peach [Prunus persica (L.) Batsch] and characterization of
morphological traits affecting flower and fruit. Tree Genet Genomes 2006,
3:1–13.
20. Etienne C, Rothan C, Moing A, Plomion C, Bodénès C, Svanella-Dumas L,
Cosson P, Pronier V, Monet R, Dirlewanger E: Candidate genes and QTLs
23.
24.
25.
26.
27.
28.
29.
30.
31.
32.
33.
34.
35.
36.
37.
38.
for sugar and organic acid content in peach [Prunus persica (L.) Batsch].
Theor Appl Genet 2002, 105:145–159.
Martínez-García PJ, Parfitt DE, Ogundiwin EA, Fass J, Chan HM, Ahmad R,
Lurie S, Dandekar A, Gradziel TM, Crisosto CH: High density SNP mapping
and QTL analysis for fruit quality characteristics in peach (Prunus persica
L.). Tree Genet Genomes 2013, 9:19–36.
Chagné D, Krieger C, Rassam M, Sullivan M, Fraser J, Andre C, Pindo M,
Troggio M, Gardiner SE, Henry RA, Allan AC, McGhie TK, Laing WA: QTL and
candidate gene mapping for polyphenolic composition in apple fruit.
BMC Plant Biol 2012, 12:12.
Costa F, Cappellin L, Zini E, Patocchi A, Kellerhals M, Komjanc M, Gessler C,
Biasioli F: QTL validation and stability for volatile organic compounds
(VOCs) in apple. Plant Sci 2013, 211:1–7.
Dunemann F, Ulrich D, Boudichevskaia A, Grafe C, Weber W: QTL mapping
of aroma compounds analysed by headspace solid-phase microextraction
gas chromatography in the apple progeny ‘Discovery’בPrima’. Mol Breed
2009, 23:501–521.
Kenis K, Keulemans J, Davey MW: Identification and stability of
QTLs for fruit quality traits in apple. Tree Genet Genomes 2008,
4:647–661.
King GJ, Maliepaard C, Lynn JR, Alston FH, Durel CE, Evans KM, Griffon B,
Laurens F, Manganaris AG, Schrevens E, Tartarini S, Verhaegh J: Quantitative
genetic analysis and comparison of physical and sensory descriptors
relating to fruit flesh firmness in apple (Malus pumila Mill.). Theor Appl
Genet 2000, 100:1074–1084.
Longhi S, Hamblin MT, Trainotti L, Peace CP, Velasco R, Costa F: A candidate
gene based approach validates Md-PG1 as the main responsible for a QTL
impacting fruit texture in apple (Malus x domestica Borkh). BMC Plant Biol
2013, 13:37.
Zorrilla-Fontanesi Y, Rambla J-L, Cabeza A, Medina JJ, Sánchez-Sevilla JF,
Valpuesta V, Botella MA, Granell A, Amaya I: Genetic analysis of strawberry
fruit aroma and identification of O-methyltransferase FaOMT as the locus
controlling natural variation in mesifurane content. Plant Physiol 2012,
159:851–870.
Sooriyapathirana S, Khan A, Sebolt A, Wang D, Bushakra J, Lin-Wang K,
Allan A, Gardiner S, Chagné D, Iezzoni A: QTL analysis and candidate gene
mapping for skin and flesh color in sweet cherry fruit (Prunus avium L.).
Tree Genet Genomes 2010, 6:821–832.
Zhang G, Sebolt AM, Sooriyapathirana SS, Wang D, Bink MC, Olmstead JW,
Iezzoni AF: Fruit size QTL analysis of an F1 population derived from a
cross between a domesticated sweet cherry cultivar and a wild forest
sweet cherry. Tree Genet Genomes 2010, 6:25–36.
Salazar J, Ruiz D, Egea J, Martínez-Gómez P: Transmission of fruit quality
traits in apricot (Prunus armeniaca L.) and analysis of linked quantitative
trait loci (QTLs) using simple sequence repeat (SSR) markers. Plant Mol
Biol Rep 2013, 31:1506–1517.
Socquet-Juglard D, Christen D, Devènes G, Gessler C, Duffy B, Patocchi A:
Mapping architectural, phenological, and fruit quality QTLs in apricot.
Plant Mol Biol Rep 2013, 31:387–397.
Blas A, Yu Q, Veatch O, Paull R, Moore P, Ming R: Genetic mapping of
quantitative trait loci controlling fruit size and shape in papaya.
Mol Breed 2012, 29:457–466.
Zhang R-p, Wu J, Li X-g, Khan MA, Chen H, Korban SS, Zhang S-l: An AFLP,
SRAP, and SSR genetic linkage map and identification of QTLs for fruit
traits in pear (Pyrus L.). Plant Mol Biol Rep 2012, 31(3):678–687. doi:10.1007/
s11105-012-0544-1.
Di Guardo M, Tadiello A, Farneti B, Lorenz G, Masuero D, Vrhovsek U,
Costa G, Velasco R, Costa F: A multidisciplinary approach providing new
insight into fruit flesh browning physiology in Apple (Malus x domestica
Borkh.). PLoS One 2013, 8:e78004.
Kumar S, Garrick D, Bink M, Whitworth C, Chagne D, Volz R: Novel genomic
approaches unravel genetic architecture of complex traits in apple.
BMC Genomics 2013, 14:393.
Fernández-Trujillo JP, Obando J, Martínez JA, Alarcón AL, Eduardo I, Arús P,
Monforte AJ: Mapping fruit susceptibility to postharvest physiological
disorders and decay using a collection of near-isogenic lines of melon.
J Am Soc Horticultural Sci 2007, 132:739–748.
Iketani H, Abe K, Yamamoto T, Kotobuki K, Sato Y, Saito T, Terai O,
Matsuta N, Hayashi T: Mapping of disease-related genes in Japanese
pear using a molecular linkage map with RAPD markers. Breed Sci 2001,
51:179–184.
Saeed et al. BMC Plant Biology 2014, 14:241
/>
39. Pierantoni L, Cho K-H, Shin I-S, Chiodini R, Tartarini S, Dondini L, Kang S-J,
Sansavini S: Characterisation and transferability of apple SSRs to two
European pear F1 populations. Theor Appl Genet 2004, 109:1519–1524.
40. Pierantoni L, Dondini L, Cho KH, Shin IS, Gennari F, Chiodini R, Tartarini S,
Kang SJ, Sansavini S: Pear scab resistance QTLs via a European pear
(Pyrus communis) linkage map. Tree Genet Genomes 2007, 3:311–317.
41. Sun W, Zhang Y, Le W, Zhang H: Construction of a genetic linkage map
and QTL analysis for some leaf traits in pear (Pyrus L.). Front Agric China
2009, 3:67–74.
42. Yamamoto T, Kimura T, Saito T, Kotobuki K, Matsuta N, Liebhard R, Gessler C,
Van de Weg W, Hayashi T: Genetic linkage maps of Japanese and
European pears aligned to the apple consensus map. Acta Horticutural
2004, 663:51–56.
43. Yamamoto T, Kimura T, Shoda M, Ban Y, Hayashi T, Matsuta N:
Development of microsatellite markers in the Japanese pear
(Pyrus pyrifolia Nakai). Mol Ecol Notes 2002, 2:14–16.
44. Zhao Y, Hong L, Yinshan G, Zhendong L, Xiuwu G, Kun L: Genetic linkage
maps of pear based on SRAP markers. Pak J Bo 2013, 45:1265–1271.
45. Wu J, Wang Z, Shi Z, Zhang S, Ming R, Zhu S, Khan MA, Tao S, Korban SS,
Wang H, Chen NJ, Nishio T, Xu X, Cong L, Qi K, Huang X, Wang Y, Zhao X,
Wu J, Deng C, Gou C, Zhou W, Yin H, Qin G, Sha Y, Tao Y, Chen H, Yang Y,
Song Y, Zhan D, et al: The genome of the pear (Pyrus bretschneideri
Rehd.). Genome Res 2013, 23:396–408.
46. Chagné D, Crowhurst RN, Troggio M, Davey MW, Gilmore B, Lawley C,
Vanderzande S, Hellens RP, Kumar S, Cestaro A, Velasco R, Main D, Rees JD,
Iezzoni A, Mockler T, Wilhelm L, Van de Weg E, Gardiner SE, Bassil N, Peace
C: Genome-wide SNP detection, validation, and development of an 8K
SNP array for apple. PLoS One 2012, 7:e31745.
47. Montanari S, Saeed M, Knäbel M, Kim Y, Troggio M, Malnoy M, Velasco R,
Fontana P, Won K, Durel CE, Perchepied L, Schaffer R, Wiedow C, Bus V,
Brewer L, Gardiner SE, Crowhurst RN, Chagné D: Identification of Pyrus
single nucleotide polymorphisms (SNPs) and evaluation for genetic
mapping in European pear and interspecific Pyrus hybrids. PLoS One
2013, 8:e77022.
48. Kvåle A: Friction discolouration of two pear cultivars in relation to date
of harvest and phenolic compounds in the fruit. Acta Agric Scand 1979,
29:29–32.
49. Kvåle A: Skin discolouration of four pear cultivars in relation to maturity,
degree of ripening and duration of storage. Norwegian J Agric Sci 1988,
2:139–142.
50. Burger GE: Factors affecting shrivelling and friction discolouration of
pears (Pyrus communis L.). In University of Stellenbosch, Department of
Horticultural Science; 2004.
51. Gomila T, Calvo G, Candan AP: Factors affecting sensitivity of ‘Abate fetel’
pears to friction discoloration. Acta Horticultural 2011, 909:687–692.
52. Saeed M, Heyes JA, McGie T, Gardiner S, Chagné S, Brewer L:
Characterization of determinants of friction discolouration in pears.
Acta Horticultural 2012, 1012:1111–1118.
53. Mitcham EJ, Feng X, Biasi B: Susceptibility to and the control of skin
browning in ‘Bartlett’ pears. In Report to the California Pear Advisory Board
December 2001. UC Davis: Department of Pomology; 2001.
54. Doyle JJ, Doyle JL: A rapid DNA isolation procedure for small quantities
of fresh leaf tissue. Phytochemistry Bull 1987, 19:11–15.
55. Grattapaglia D, Sederoff R: Genetic linkage maps of Eucalyptus grandis
and Eucalyptus urophylla using a pseudo-testcross: mapping strategy
and RAPD markers. Genetics 1994, 137:1121–1137.
56. Van Ooijen JW, Voorrips RE: JoinMap: Version 3.0: Software for the Calculation
of Genetic Linkage Maps. Wageningen, Netherland: University and Research
Center; 2001.
57. Voorrips RE: MapChart: Software for the graphical presentation of linkage
maps and QTLs. J Hered 2002, 93:77–78.
58. Van Ooijen JW: MapQTL® 5, software for the mapping of quantitative trait
loci in experimental populations. In Wageningen, The Netherlands: 2004.
59. Tvergyak PJ: Pear maturity indexes used to time harvest date. Post Harvest
Pomology Newsl 1985, 3:3.
60. Galvis Sánchez AC, Gil-Izquierdo A, Gil MI: Comparative study of six
pear cultivars in terms of their phenolic and vitamin C contents and
antioxidant capacity. J Sci Food Agric 2003, 83:995–1003.
61. Li X, Gao W-Y, Huang L-J, Zhang J-Y, Guo X-H: Antioxidant and
antiinflammation capacities of some pear cultivars. J Food Sci 2011,
76:C985–C990.
Page 18 of 18
62. Tanrıöven D, Ekşi A: Phenolic compounds in pear juice from different
cultivars. Food Chem 2005, 93:89–93.
63. Chagné D, Crowhurst RN, Pindo M, Thrimawithana A, Deng C, Ireland H,
Fiers M, Dzierzon H, Cestaro A, Fontana P, Bianco L, Lu A, Storey R, Knäbel
M, Saeed M, Montanari S, Kim YK, Nicolini D, Larger S, Stefani E, Allan AC,
Bowen J, Harvey I, Johnston J, Malnoy M, Troggio M, Perchepied L, Sawyer
G, Wiedow C, Won K, et al: The draft genome sequence of European pear
(Pyrus communis L. ‘Bartlett’). PLoS One 2014, 9:e92644.
64. Amiot MJ, Tacchini M, Aubert S, Nicolas J: Phenolic composition and
browning susceptibility of various apple cultivars at maturity. J Food Sci
1992, 57:958–962.
65. Herrmann K: Flavonols and flavones in food plants: a review. Int J Food
Sci Technol 1976, 11:433–448.
66. Kingston C: Maturity indices for apple and pear. Horticultural Rev 1992,
13:407–432.
67. Kumar S, Bink MAM, Volz R, Bus VM, Chagné D: Towards genomic selection
in apple (Malus × domestica Borkh.) breeding programmes: Prospects,
challenges and strategies. Tree Genet Genomes 2012, 8:1–14.
68. Meuwissen TH, Hayes BJ, Goddard ME: Prediction of total genetic value
using genome-wide dense marker maps. Genetics 2001, 157:1819–1829.
69. Celton J-M, Chagne D, Tustin S, Terakami S, Nishitani C, Yamamoto T,
Gardiner S: Update on comparative genome mapping between Malus
and Pyrus. BMC Res Notes 2009, 2:182.
70. Velasco R, Zharkikh A, Affourtit J, Dhingra A, Cestaro A, Kalyanaraman A,
Fontana P, Bhatnagar SK, Troggio M, Pruss D: The genome of the
domesticated apple (Malus x domestica Borkh.). Nat Genet 2010,
42:833–839.
71. Liebhard R, Kellerhals M, Pfammatter W, Jertmini M, Gessler C: Mapping
quantitative physiological traits in apple (Malus × domestica Borkh.).
Plant Mol Biol 2003, 52:511–526.
doi:10.1186/s12870-014-0241-3
Cite this article as: Saeed et al.: Genetic, metabolite and developmental
determinism of fruit friction discolouration in pear. BMC Plant Biology
2014 14:241.
Submit your next manuscript to BioMed Central
and take full advantage of:
• Convenient online submission
• Thorough peer review
• No space constraints or color figure charges
• Immediate publication on acceptance
• Inclusion in PubMed, CAS, Scopus and Google Scholar
• Research which is freely available for redistribution
Submit your manuscript at
www.biomedcentral.com/submit