A deep survey of alternative splicing in grape reveals changes in the splicing machinery related to tissue, stress condition and genotype
Bạn đang xem bản rút gọn của tài liệu. Xem và tải ngay bản đầy đủ của tài liệu tại đây (1.36 MB, 16 trang )
Vitulo et al. BMC Plant Biology 2014, 14:99
/>
RESEARCH ARTICLE
Open Access
A deep survey of alternative splicing in grape
reveals changes in the splicing machinery related
to tissue, stress condition and genotype
Nicola Vitulo1, Claudio Forcato1, Elisa Corteggiani Carpinelli1, Andrea Telatin1, Davide Campagna4, Michela D'Angelo1,
Rosanna Zimbello1, Massimiliano Corso2, Alessandro Vannozzi2, Claudio Bonghi2, Margherita Lucchin2,3
and Giorgio Valle1,4*
Abstract
Background: Alternative splicing (AS) significantly enhances transcriptome complexity. It is differentially regulated in a
wide variety of cell types and plays a role in several cellular processes. Here we describe a detailed survey of alternative
splicing in grape based on 124 SOLiD RNAseq analyses from different tissues, stress conditions and genotypes.
Results: We used the RNAseq data to update the existing grape gene prediction with 2,258 new coding genes
and 3,336 putative long non-coding RNAs. Several gene structures have been improved and alternative splicing
was described for about 30% of the genes. A link between AS and miRNAs was shown in 139 genes where we
found that AS affects the miRNA target site. A quantitative analysis of the isoforms indicated that most of the
spliced genes have one major isoform and tend to simultaneously co-express a low number of isoforms, typically
two, with intron retention being the most frequent alternative splicing event.
Conclusions: As described in Arabidopsis, also grape displays a marked AS tissue-specificity, while stress conditions
produce splicing changes to a minor extent. Surprisingly, some distinctive splicing features were also observed
between genotypes. This was further supported by the observation that the panel of Serine/Arginine-rich splicing
factors show a few, but very marked differences between genotypes. The finding that a part the splicing machinery
can change in closely related organisms can lead to some interesting hypotheses for evolutionary adaptation, that
could be particularly relevant in the response to sudden and strong selective pressures.
Keywords: Alternative splicing, Transcriptome, RNAseq, Grapevine
Background
Several reasons make grapevine particularly interesting: it
is the most cultivated fruit plant covering approximately
7.5 million hectares in 2012 (), with a
long history of domestication, as well as a useful model
organism since it seems to have maintained the ancestral
genomic structure of the primordial flowering plants.
The complete genome sequence was obtained in 2007
by two independent projects [1,2]. The availability of
the genomic sequence gave the opportunity to conduct
several genome-wide studies focused on different aspects
* Correspondence:
1
CRIBI Biotechnology Centre, University of Padua, Padua, Italy
4
Department of Biology, University of Padua, Padua, Italy
Full list of author information is available at the end of the article
of grape biology such as berry development and response
to different biotic and abiotic stresses [3-10].
However the eukaryotic transcriptome, and in particular the plant transcriptome, is far more complex than
previously believed, alternative splicing and non coding
transcripts being amongst the major causes contributing
to this complexity. Recent works pointed out the extensive
diffusion of these phenomena in plants and their importance in gene expression and stress response [11-14].
Alternative splicing (AS) is one of the main mechanisms
that forge transcriptome plasticity and proteome diversity
[15]. Different studies based on computational analysis on
both expressed sequence tags and high-throughput RNA
sequencing provide an estimate of the frequency of these
events. For example, 20–30% of transcripts were found to
© 2014 Vitulo et al.; licensee BioMed Central Ltd. This is an Open Access article distributed under the terms of the Creative
Commons Attribution License ( which permits unrestricted use, distribution, and
reproduction in any medium, provided the original work is properly credited. The Creative Commons Public Domain
Dedication waiver ( applies to the data made available in this article,
unless otherwise stated.
Vitulo et al. BMC Plant Biology 2014, 14:99
/>
be alternatively spliced in both Arabidopsis thaliana and
rice (Oryza sativa) by employing large-scale EST-genome
alignments [15,16]. Recently, deep sequencing of the
transcriptome using high-throughput RNA sequencing
(RNAseq) increased this estimate showing that more
that 60% of intron-containing genes in Arabidopsis are
alternatively spliced [12]. Although most AS events of
plants have not yet been characterized, there is a strong
evidence indicating that they are spatially and developmentally regulated, playing important roles in many
plant functions such as stress response [17]. Moreover,
since AS events are different at intraspecific level in
several plant species, it was suggested that they may be
correlated with niche specialization resulting from domestication in different geographical regions [18,19].
Recently, the human cell transcriptional landscape was
extensively investigated by the Encode Project [20] revealing that most genes tend to express several isoforms at the
same time, with one isoform being predominant across
different cell types. Moreover a recent study confirmed
these observations, showing that for 80% of the expressed
genes in primary tissue cultures, the major transcript is
expressed at a considerably higher level (at least twice)
than any other isoform [21]. Similar extensive studies are
still missing in plants.
Some emerging evidence indicates that a large fraction
of the eukaryotic genome is transcribed [22-24] and that
a considerable amount of the transcriptome is composed
by non-coding RNA (ncRNA) that may play a key role as a
regulator in many cellular processes. A poorly characterized
class of plant ncRNA is composed of long non-coding
RNA (lncRNAs), mRNA-like transcripts greater than 200
bases transcribed by RNA polymerase II, polyadenylated,
spliced and mostly localized in the nucleus [25]. In plants
a systematic identification of long non coding transcripts has only been done for a few species [13,14,26,27].
In Arabidopsis for example, using a tailing-array based
method Liu et al. identified 6480 long intergenic noncoding transcripts, 2708 of which were confirmed by RNA
sequencing experiments [13]. Based on their characteristics, lncRNAs can be classified as natural antisense transcripts (NATs), long intronic noncoding RNAs and long
intergenic noncoding RNAs (lincRNAs). Some of these
transcripts have been shown to be involved in important
biological processes such as developmental regulation
and stress response, although the detailed mechanisms by
which they operate are mostly unknown [25]. Moreover,
several lncRNAs were found to be involved in plant reproductive development [28] and responses to pathogen invasion [13,14]. Furthermore it has been observed both in
plant [13,14] and in vertebrate [29,30] that lncRNAs have
both tissue and temporal-dependent expression patterns.
The extent and complexity of the transcriptional landscape in plants is not yet well characterized. Recent
Page 2 of 16
advances in high-throughput DNA sequencing technologies
applied to transcriptome analyses have opened new and
exciting possibilities of investigation [31]. RNAseq has
been successfully applied in several studies including
gene prediction improvement [32,33], isoform identification [11,12,34], isoform quantification [35,36], non-coding
transcript discovery [29,30,37].
Here we present a deep survey on the grape transcriptome, based on 124 RNAseq SOLiD libraries from leaf,
root and berry, from different genotypes under different
physiological and stress conditions.
The high coverage of our samples allowed us to review
the Vitis vinifera gene annotation and to extend it to
include alternative spliced isoforms. The impact of alternative splicing on miRNA target sites was also investigated.
Our data showed that alternative splicing is correlated to
tissue as well as genotypes. Finally, we developed a stringent
pipeline to identify long non-coding RNAs, that were
annotated based on their expression in different tissues
and stress conditions.
Results and discussion
Dataset
RNAseq data came from a parallel work (paper in preparation) aiming to study the response to water-deficiency
and salt stresses of two rootstocks, the widely used 101.14
and the experimental M4, kindly provided by prof. A.
Scienza, University of Milan (Italy). The commercial rootstock 101.14 was derived from a cross of V. riparia x V.
rupestris, while M4 is an experimental rootstock derived
from a cross of (V. vinifera x V. berlandieri) x V. berlandieri cv. Resseguier n.1 [38]. It should be noticed
that although V. vinifera, V. riparia, V. rupestris and V.
berlandieri are generally classified as 4 different species,
they are all able to cross fertilize and to produce fertile
progenies; therefore, they are strongly related and should
be considered as the same biological species. As a background work of the project (data not shown) the two
rootstock genomes were resequenced. We found that
the average frequency of single nucleotide variants is
about 1/200 bases, very similar to what is found when
comparing different V. vinifera cultivars. Excluding possible gene family expansions, no private genes were found
in the rootstock genotypes. This further supports the idea
that we are working on the same biological species. In any
case, the aim of this work was not the annotation of a Vitis
“pangenome”, but the improvement of the Vitis vinifera
reference genome.
Some RNAseq analyses were also performed on Cabernet
Sauvignon, that is a well known cultivar of V. vinifera.
More details can be found in the materials and methods
section. A total of 124 samples from leaves, roots and berries were sequenced using SOLiD technology producing
Vitulo et al. BMC Plant Biology 2014, 14:99
/>
Page 3 of 16
approximately 6 billion of directional 75/35 bases pairedend RNAseq reads.
Improvement of the grape gene prediction
The grape gene prediction and annotation (http://genomes.
cribi.unipd.it/grape), available before the present work is
referred to as v1 and followed the v0 annotation soon after
the release of the grape PN40024 genomic sequence [1].
The v1 annotation improved to some extent the previous
annotation and now it represents the generally used gene
reference of grape. The new potential of RNAseq technology is now revealing some weaknesses of the v1 annotation and at the same time offering the opportunity for a
through and systematic study of the grape transcriptome.
Two recent works raised some concern about the v1
annotation. Firstly, a comparison between v1 and v0
showed that 6,089 genes annotated in v0 were not
present in v1 [39]. Although some of those genes may
be artefacts, others are certainly genuine grape genes
and should be reintegrated into the annotation. Secondly,
the v1 annotation did not attempt to describe alternative
isoforms. This was pointed out by a de novo transcriptome assembly of RNAseq of V. vinifera cv. Corvina,
that allowed the identification of 19,517 splice isoforms
among 9,463 known genes and 2,321 potentially novel
protein coding genes [4].
Motivated by these observations we improved and updated the grape gene prediction, integrating the information
derived from the considerable amount of newly available
data and setting up rigorous bioinformatic procedures
based on several filtering steps, to limit the number of
artifactual genes.
A detailed workflow describing the different steps of
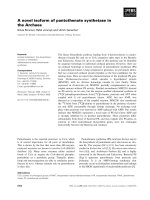
the analysis is presented in Figure 1. The general analysis
of the RNAseq data was based on the “align-then-assemble” strategy. Firstly, the RNAseq reads from 124 libraries
were aligned onto the reference grape genome using PASS
[40]. Then the spliced reads that were not sufficiently
supported were discarded as described in the Methods
section. Secondly, we used three different software to
reconstruct the transcripts: Cufflinks [36], Isolasso [41]
and Scripture [37]. Since the 124 RNAseq libraries corresponded to 62 different replicated samples, we merged
together the alignments from each replica, thus obtaining
62 datasets. We obtained an average number per dataset
of 57,000, 36,000 and 61,000 reconstructed transcripts
respectively for Cufflinks, Isolasso and Scripture (Figure 1,
panel B). Finally, in order to reduce the number of misassembled transcripts and artefacts, we removed all the
assemblies that were not predicted by at least two of
the three programs. To reconstruct the transcripts, all
the datasets were clustered with PASA [42] producing
133,483 individual isoforms, belonging to 57,127 genes
(Figure 1, panel C).
Figure 1 Gene prediction workflow. (A) RNAseq samples are
aligned on the reference genome. (B) Biological replicate alignments are
merged together into 64 different datasets. Transcript reconstruction was
performed independently on each dataset using three different
programs: Cufflinks, Scripture and Isolasso. The Venn diagram shows the
percentage of reconstructed transcripts in common among the three
software while the numbers between brackets indicates the average
number of reconstructed transcripts per sample. We selected only those
transcript models predicted by at least two programs and with a length
higher than 150 bases. (C) The selected transcripts were assembled
using PASA software. (D) PASA assemblies were used to update v1 gene
predictions. (E) A new gene prediction was performed integrating with
EvidenceModeler (EVM) software different sources of evidence such as
PASA transcripts, ESTs and proteins alignments and Augustus prediction
trained with PASA assemblies. The produced gene set was compared to
v1 gene prediction and only the new gene loci were selected for further
analysis. After applying different filtering criteria, we obtained a final
dataset of 2,258 new genes. (F) The final v2 gene prediction integrates
genes generated by the steps described in D (v1 update) and E
(new gene prediction).
The gene prediction was performed in two different
steps. Firstly, we updated the v1 gene prediction incorporating the RNAseq reconstructed transcripts using the
PASA software [42] (Figure 1, panel D). PASA is a tool
designed to model and update gene structures using alignment evidence and it is able to correct exon boundaries,
Vitulo et al. BMC Plant Biology 2014, 14:99
/>
add UTRs and model for alternative splicing. Secondly, we
performed a new gene prediction integrating evidence
from ESTs, proteins and RNAseq (Figure 1, panel E, see
Methods). This second step identified 2,258 new genes,
80% of which were found to have at least one gene
ontology annotation (see Methods, Additional file 1).
Gene enrichment analysis revealed that the addition of
these new genes endowed the list of functional categories
with functions that were previously under-represented
(Additional file 2: Figure S1). Among the most significant
categories, we found terms related to nucleotide binding
site such as “ADP binding”, “adenyl ribonucleotide binding”
or “purine ribonucleotide binding”. Interestingly, most
genes associated with this domain are annotated as “disease
resistance” [43].
The new gene prediction, called v2, contains 31,922
genes and 55,649 transcripts (Figure 1, panel F). The v2
gene prediction showed several differences from the previous prediction, such as longer transcripts and coding
sequences (CDS) and a higher number of exons per
gene. As reported in Table 1, the incorporation of the
RNAseq information led to an important improvement
in the prediction of the untranslated regions (UTRs). The
v1 UTRs prediction was based on EST data and suffered
from the lack of information at the 5′ and 3′ end of transcripts, due to the scarce yield of full length cDNAs in the
EST data. RNAseq data provided a decisive contribution
to overcome this problem. We found that in the v2 gene
prediction the number of genes with a 5′ and 3′ UTRs
rose respectively, from 17,082 to 21, 892 and from 20,087
to 23,337. Moreover, we found that the average UTR
length of v2 is twofold longer than v1 (Table 1).
To evaluate the quality of the exon/intron splicing sites
we performed a comparison between v1 and v2 gene predictions and we found that almost 97% of the v1 introns
are predicted also in v2. To further asses the quality of
the two predictions, we used three different sources of
evidence, proteins, ESTs and RNAseq, and we were able
to confirm 92% of the shared introns. Interestingly, the
analysis showed that almost 29% of the introns are supported by at least two different independent sources of
evidence while this number rose to 58% when we considered all the three sources, demonstrating the high quality of
the exon/intron boundaries of both gene predictions. More
details are available in Additional file 2: Table S1 and S2.
When we analysed the splicing sites exclusive to one or the
other gene prediction, we were able to confirm only 46% of
v1 introns against 85% of the introns confirmed in the v2.
As expected, we found that the majority of these exclusive
splicing sites are confirmed only by one evidence. In
particular we found that the major contribution to the
v2 exclusive splicing site is given by the RNAseq data.
As described above, the v2 prediction was generated
from v1 using the PASA software, without further manual
Page 4 of 16
Table 1 Gene prediction statistics and comparison
# genes
v1
v2
29970
31922
# transcripts
29970
55649
# transcripts x gene
1
1,7
Average length
5134
5267
Median length
2741
2917
Transcript
Average length
Median length
1096
1207
876
990
CDS
Counts
142332
158834
Average coding length
231
247
129
136
Median coding length
Exon
Counts
147805
180493
Avg length
270
410
Median length
147
201
Avg exon x gene
4,7
5,3
UTR3
Counts
22275
43542
Avg length
211
495
Median length
186
356
UTR5
Counts
20025
42291
Avg length
119
285
Median length
72
176
Intron
Counts
117835
124393
Avg length
968
1005
Median length
248
263
revision. We observed that v1 and v2 are very similar;
however we found 249 v2 genes derived from the fusion
of 520 v1 genes, while 183 v2 genes were derived from the
splitting of 91 v1 genes (Additional file 3). To discriminate
between false/positive fusion/splitting events, we performed
a similarity search of each group of fused/split proteins
against the Arabidopsis proteome (TAIR10). We evaluated
the number and the consistency of the best hit to determine the reliability of the fusion/splitting events (see
Methods). We found that of the 249 fused genes, 161
find a better match on v2, while 54 on v1. Whereas of
the 91 split genes, 38 have a better match on v2 and 29
on v1 (Additional file 2: Table S3).
A further comparison between v1 and v2 showed that
4,966 genes have a different coding sequence in the two
predictions. For each pair of alternative prediction we performed a global pairwise alignment using the Arabidopsis
Vitulo et al. BMC Plant Biology 2014, 14:99
/>
homologous protein as reference. The results show that the
majority of v2 genes have a higher score than v1, suggesting
that they have a better gene structure (Additional file 2:
Table S4 and Figure S2).
Finally we performed a comparison at functional level
using InterProScan annotation. We were able to annotate
23,569 v1 genes with at least one InterPro domain, while
this number rose to 25,880 genes when we considered v2
gene prediction. As reported in Additional file 2: Figure
S3, v2 is better both in terms of number of domains identified and number of annotated genes.
Alternative splicing prediction and analysis
We observed that 90% of v2 predicted genes (29,150)
contain two or more exons, and 30% (8,668) of these
undergo alternative splicing producing 32,395 different
isoforms. We also found that 64% of the alternative
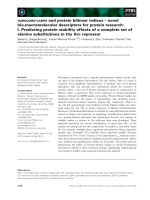
spliced genes produced more than two isoforms (Figure 2,
panel A). Analysis of the acceptor-donor sites shows that
97.5% are canonical GT-AG pairs, while 1% are GC-AG
and 1.5% a combination of less frequent non canonical
sites. (Figure 2, panel B).
We used ASTALAVISTA [44] to identify and classify
the different types of alternative splicing. We identified
21,632 alternative splicing events, affecting 17% of all
Page 5 of 16
the introns, distributed into five main categories: intron
retention, exon skipping, alternative donor, alternative
acceptor and complex events (Figure 2, panel C and D).
We found that the most common event is intron retention, involving 77% of the alternatively spliced genes.
This AS category is mainly represented by transcripts in
which a single intron is optionally included and occurred
in 51% of the AS events. On the contrary, exon skipping
occurred only in 4.1% of the cases. Moreover we found that
the use of alternative acceptors (12.3%) is more frequent
than the use of alternative donors (8%). These results are
consistent with other studies [11,12,15,34] supporting the
idea that intron retention is a common event in plants. In
Figure 2 panel E, we compared the size distribution of the
retained introns (IR) with that of the total introns (ALL),
the constitutive introns (IC), the alternatively spliced introns (ASI) and the alternative splicing events excluding
the intron retention events (AS-IR). We found that the size
distribution of retained introns is considerably smaller
than the intron size of other AS (IR median of 123, AS-IR
median of 702), supporting the hypothesis that intron
retention is related to intron size [12,34].
We also performed an analysis to identify which gene
regions preferentially undergo alternative splicing. We
found that about 70% of all AS events occur at the
Figure 2 Alternative splicing analysis. (A) Number of isoforms per gene distribution. (B) Donor and acceptor splicing site distributions. (C)
Schematic representation of the most frequent splicing event identified in the v2 prediction: intron retention (IR), alternative 3' splicing site (Alt 3' ss),
alternative 5' splicing site (Alt 5'), exon skipping (ES). The number of events is reported between brackets. (D) Pie chart showing the percentage
distribution of alternative splicing events. (E) Intron size box plot distribution: all introns (ALL), constitutive introns (IC), alternatively spliced introns
(ASI), introns that underwent intron retention events (IR), alternatively spliced introns without IR (AS-IR).
Vitulo et al. BMC Plant Biology 2014, 14:99
/>
Page 6 of 16
protein-coding level, while 18% and 11% occurred respectively, at the 5′ UTR and 3′ UTR regions. The remaining
1% of the AS events occurred between a coding sequence
and a UTR. These values compared reasonably well with
the extension of coding sequences (65%), 5′UTRs (17%)
and 3′UTRs (18%), indicating that all regions of the transcript are susceptible to alternative splicing without any
significant preference. The findings that alternative splicing may not be limited to the sole production of protein
diversity also emerged from Arabidopsis [45]. Moreover of
all the genes with at least one isoform, 46% have alternative start sites, while 60% have alternative stop codons.
Alternative splicing affects miRNA target sites
Unlike animal miRNAs that usually recognize their target on the 3′UTR region, plant miRNAs do not show
preferences in terms of target position [46]. To evaluate
the impact of the v2 gene prediction on miRNA target
prediction, we performed a target analysis using the
psRNATarget server [47]. As reported in Table 2, the v2
prediction shows an increased number of miRNA target
sites allowing the identification of targets for 13 more
miRNAs and 167 new target genes. Interestingly, more
that 79% of the target sites in the v1 prediction were
identified on coding sequences, while in v2 those were
only 55%. On the other hand we found that target
regions on 3′ UTRs and 5′ UTRs increased from 11% to
27% and from 9% to 18% respectively on v2 compared to
v1, reassessing the importance of UTR regions in plant
miRNA target identification (Additional file 4).
We investigated the effect of alternative splicing on
miRNA target sites. A recent analysis of Arabidopsis [48]
revealed that mRNA splicing seems to be a possible
mechanism to control miRNA-mediated gene regulation.
Indeed, alternative splicing could produce different isoforms which may or may not contain functional binding
sites, playing an important role in modulating the interaction between miRNA and target.
To test this hypothesis, for each gene with alternative
splicing we checked if the target sites were predicted to
be present across all the isoforms. We found 286 cases,
involving 131 miRNA and 139 genes (23% of the identified
miRNA target genes), in which a miRNA binding site is
missing in one or more isoforms. Our analysis revealed
Table 2 miRNA target site prediction results
v1
v2
# mirna
168
181
# genes
432
599
# transcripts
432
1184
# 3′ UTR
49
317
# 5′ UTR
41
218
# CDS
343
658
that in 43% of the cases the missing binding site is the
result of a differential mRNA initiation or termination.
54% of the remaining events occurred at the 5′UTR, 21%
at the 3′UTR and 23% at the coding sequence, involving
in 46% of the cases intron retention events.
The identification of target sites relies entirely on in
silico prediction, therefore the results need to be taken
with some care. However, although these data need further
experimental validation, they suggest the presence of this
intriguing regulatory mechanism also in grape. Further
analyses to validate the miRNA target sites are required
to better understand the complexity of miRNA-target
interaction and the impact of alternative splicing on modulating miRNA gene regulation.
Comparison of alternative splicing in different tissues,
genotypes and stress conditions
We analysed the expression of the predicted isoforms of
each gene across all the samples. For each isoform we estimated the FPKM (Fragment Per Kilo base per Million)
expression level using two different programs: Cufflinks
and Flux-capacitor (see Methods and Additional file 2:
Figure S4 and S5). Both methods gave very similar results;
here we refer to those obtained with Cufflinks. We assumed
that a FPKM between 1–4 corresponds approximately to 1
RNA molecule per cell [35]. Although we are aware that
also low-expressed transcripts may have a functional role,
we decided to exclude from our analysis those with a
FPKM smaller than 1, because of the uncertainty due
to the low number of reads and the approximation of
the programs for isoform quantification would yield to
low quality results.
The first aspect that we investigated was the number
of different isoforms that can be identified comparing
different tissues, genotypes and stress conditions. We
grouped the samples into three main categories: tissue
(leaf and root, Figure 3, panel A and B), genotype (101.14
and M4, Figure 3 panel C and D) and stress conditions
(salt-stress, water-stress and controls, Figure 3, panel E
and F) and counted how many transcript variants are
shared among the different datasets. Cabernet Sauvignon
berries were not considered in this analysis because a
comparable berry dataset was not available for 101.14 and
M4 genotypes. The analysis was performed considering
only the genes expressed across all the samples in order to
minimize the bias due to the genes that are turned off.
In Figure 3 it can be seen that tissues show the highest
difference between alternative isoforms, with more than
8% of different variants; genotypes show between 6 to
7% of non-shared variants, while stress conditions show
between 4 to 7% (summing up the contribution from
control samples). The observation that the extent of
change in alternative splicing due to stress is similar to
that seen in different tissues is a clear indication of its
Vitulo et al. BMC Plant Biology 2014, 14:99
/>
Page 7 of 16
Figure 3 Isoforms shared between different tissues, genotypes
and conditions. Venn diagrams showing the percentage of different
isoforms that are shared comparing different tissues (A and B), genotypes
(C and D) and environmental conditions (E and F).
role in stress response. It should be considered that the
status of a transcript being turned on or off depends on
its detectability that in turn is dependent on the coverage.
As a result we would expect that genes expressed at a
low level would produce a minor number of detectable
isoforms. Indeed, we found a correlation between the
number of identified isoforms and the level of gene
expression (Additional file 2: Figure S6).
Genotypes also exhibit considerable variability in splicing.
It is interesting to note that the number of different
isoforms is greater between genotypes than between
plants undergoing different stress conditions. Overall these
data indicate that to better understand the molecular bases
of phenotypic traits we should also consider the differences
in alternative splicing.
When we compared the relative abundance of the variants of individual genes, we found that in most cases
there is a single transcript that has a considerable higher
level of expression rather than a subset of transcripts
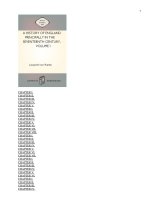
with similar expression. Figure 4, panel A shows that the
FPKM value distribution of the major transcript has a
Figure 4 Isoforms expression analysis. (A) FPKM value distribution
of the first, second and third most abundant isoform within each
sample. (B) Distribution of the ratio between expression values
of the first and second most abundant isoforms. (C) Number of
co-expressed isoforms compared to the number of isoforms per
gene. (D) Frequency of the major isoform across the samples.
median value of 9, while the second and third variant
have a median value of 4 and 2 respectively. When we
calculated the ratio between the expression values of
the first and second most abundant isoforms, we found
that in 60% of the cases the ratio was higher by at least
2-fold and in 25% of the cases 5-fold (Figure 4, panel B).
Next, we verified how many isoforms were simultaneously
co-expressed in the different samples (Figure 4, panel C).
We noticed that genes tend to co-express a low number
Vitulo et al. BMC Plant Biology 2014, 14:99
/>
of isoforms, typically two, and there seems to be no
correlation between number of co-expressed isoforms
and number of predicted variants. These results are quite
different from those observed in human [20] where genes
express many isoforms simultaneously and the number
of expressed isoforms is correlated to the number of
predicted variants. Finally, we verified if there is a tendency
of the major isoform to be recurrent across the different
samples. For each gene expressed in at least two samples,
we identified the major isoform and counted how many
times it was the most abundant across the samples. In
4,777 genes (54%) we found that the same major isoform
was expressed across all the samples where the gene is
expressed (Figure 4, panel D). Similar studies have been
recently reported also for human where a survey on 16
different tissues revealed that 35% of the genes tend to
express the same major isoform [21]. This result is strongly
correlated to the dataset. The extension of the analysis to
more samples would probably reduce the number of genes
in which the major isoform remains the same.
Evolutionary adaptation by tuning the alternative splicing
machinery
In the previous paragraph we showed that in 54% of the
genes the major isoform remains the same across all
the samples, while in the remaining 46% the two major
isoforms change. To identify possible correlations between
alternative splicing and sample types we performed a
principal component analysis (PCA). For each gene we
considered the two major isoforms amongst all the samples (see Methods). The PCA was performed on the log
ratio of the first and the second major isoform expression
values. The dots in Figure 5 represent the 62 samples that
are visualized according to tissue and genotype (leaf, root
and berry tissues and the M4 and 101.14 rootstocks).
The PCA analysis shows some interesting and unexpected results, Figure 5, panel A, B and C show the scatterplot among the first three PCA components. The first two
components (Figure 5, panel A) show that alternative
splicing switching events are strongly correlated to the
tissue type as the samples from the same tissue tend
to cluster together. Unexpectedly, when the third PCA
component is taken into account (Figure 5, panel B and
C), the samples are further separated according to the
rootstock genotype. This suggests the possibility that
differences amongst genotypes may also arise from changes
in the general splicing regulation program, thus supporting
the idea that the evolutionary adaptation to a sudden and
strong selective pressure (such as domestication) may be
achieved by modifications of the splicing machinery.
To further investigate this hypothesis we considered
the serine/arginine-rich proteins (SR), that are known to
be involved in pre-mRNA splicing processes and regulate
alternative splicing by changing the splice site selection in
Page 8 of 16
Figure 5 Isoforms expression principal component analysis.
(A,B,C) Scatter plot of the first three principal component analysis of
the expression values ratio between the first two highly expressed
isoforms. (D) Scatter plot of the first two components of the
expression values of the whole gene set. Each dot represents a
sample: 101.14 leaf (cyan), 101.14 root (blue), M4 leaf (red), M4 root
(green) and Berry (black).
a concentration dependent-manner. Several studies demonstrated that SR proteins are differentially expressed in different tissues and cell types, and that plant SR genes can
produce alternative transcripts with a level of expression
that is controlled in a temporal and spatial manner [49].
Therefore we investigated if there was a significant difference in the expression level of grape SR genes that
could be correlated with a different splicing program in
tissues and genotypes. Firstly, we performed a blast similarity search (e-value cutoff 1e-5) using the 19 SR proteins
identified in Arabidopsis [50] to identify the orthologous
sequences in the grape genome. We were able to identify
18 grape genes as reported in Table 3. Secondly, we compared the mean expression values of the genes grouping
the samples according to genotype and tissue type. When
the samples are grouped according to genotype, we
did not find any significant difference between the
genes of the two groups, with the exception of the
gene VIT_212s0142g00110 (p-value 0.01); however,
when the analysis was done taking into consideration
the expression level of the isoforms, we found four differentially expressed variants (Figure 6, panel A): VIT_216s009
8g01020.7 (p-value 0.037), VIT_215s0048g01870.6 (p-value
0.003), VIT_204s0069g00800.3 (p-value 4.8e−5) and VIT_21
6s0100g00450.3 (p-value 0.0007). Finally, when the samples
were grouped according to tissue, we found that almost all
the SR genes were markedly differentially expressed (15 out
18, Figure 6, panel B), thus confirming the results shown in
Figure 5 and indicating that switches in alternative splicing
Vitulo et al. BMC Plant Biology 2014, 14:99
/>
Page 9 of 16
Table 3 Grape splicing factors and homologous genes in Arabidopsis
Grape
Arabidopsis
Evalue
Gene symbol
Description
VIT_201s0026g00250
AT1G23860
6e-38
SRZ-21
RS-containing zinc finger protein 21
VIT_204s0069g00800
AT4G31580
4e-48
SRZ-22
Serine/arginine-rich 22
VIT_206s0004g00710
AT3G13570
5e-79
SCL30A
SC35-like splicing factor 30A
VIT_207s0005g00320
AT1G02840
2e-75
SR1
RNA-binding (RRM/RBD/RNP motifs) family protein
VIT_208s0007g00970
AT1G16610
8e-10
SR45
Arginine/serine-rich 45
VIT_208s0040g02860
AT2G37340
4e-50
RSZ33
Arginine/serine-rich zinc knuckle-containing protein 33
VIT_212s0142g00110
AT5G64200
2e-54
SC35
Ortholog of human splicing factor SC35
VIT_213s0019g01060
AT3G55460
4e-51
SCL30
SC35-like splicing factor 30
VIT_213s0067g03600
AT2G37340
3e-70
RSZ33
Arginine/serine-rich zinc knuckle-containing protein 33
VIT_213s0156g00020
AT1G55310
1e-13
SR33
SC35-like splicing factor 33
VIT_214s0030g00480
AT5G18810
1e-44
SCL28
SC35-like splicing factor 28
VIT_214s0060g02290
AT1G09140
1e-77
SR30
SERINE-ARGININE PROTEIN 30
VIT_215s0046g00050
AT2G46610
7e-83
RS31a
RNA-binding (RRM/RBD/RNP motifs) family protein
VIT_215s0048g01870
AT5G52040
1e-85
RS41
RNA-binding (RRM/RBD/RNP motifs) family protein
VIT_216s0098g01020
AT3G49430
5e-90
SRp34a
SER/ARG-rich protein 34A
VIT_216s0100g00450
AT5G52040
5e-97
RS41
RNA-binding (RRM/RBD/RNP motifs) family protein
VIT_218s0001g05550
AT5G64200
6e-53
SC35
Ortholog of human splicing factor SC35
VIT_219s0027g00590
AT1G16610
1e-71
SR45
Arginine/serine-rich 45
plays a very important role in the definition of tissues and
to a lesser extent in genotypes.
We also performed a PCA on the expression pattern
of genes rather than isoforms and we found that tissues
are resolved by the first two components (Figure 5, panel
D), while genotypes cannot be resolved, even when the
second and third components are considered (Additional
file 2: Figure S7). We can conclude that the two different
genotypes showed more marked differences in alternative
splicing than in change in the level of gene expression.
Non coding transcripts
To identify long non coding transcripts (lncRNA) we developed a stringent filtering pipeline to discriminate between
coding and non coding sequences and to eliminate possible
errors of assembly. Briefly, we identified putative lncRNAs
based on their expression level and genomic context and
only if they had no coding potential, no possible homology
with proteins or protein domains and no homology with
repeated sequences. LncRNAs can be classified as natural
antisense transcripts (NATs), long intronic noncoding
RNAs and long intergenic noncoding RNAs (lincRNAs)
according to their genome location. Depending on the
type of lncRNA, we applied different filters to avoid false
positives due to several possible sources of errors, as for
example missing UTRs or intron retention events. Further
details can be found in the materials and methods section.
This procedure led to the identification of 3,336 long non
coding RNA divided into 526 intronic, 1,992 intergenic and
818 antisense transcripts. We analysed the structure, the
expression level and the conservation of these lncRNA. We
found that grape lncRNA were on average smaller than
protein coding genes (mean length of 1,016 nt, 426 and 408
for antisense, intronic and intergenic lncRNAs versus
3,232 nt for protein coding genes). Moreover we found
a considerable difference between the length of antisense
lncRNA and the other two types of long non coding RNA
(Figure 7, panel A). We found that grape lncRNAs are
generally monoexonic and that only 11% of intergenic,
1.3% of intronic and 5% of antisense lncRNAs have
more than one exon. Consequently to this monoexonic
structure, we found that only a low number of lncRNAs
undergoing alternative splicing: 40 intergenic lncRNA
produced 97 different isoforms while 12 antisense lncRNAs
produced 23 variants. We did not detect any isoforms for
intronic lncRNAs. These findings are quite different from
what was found in human were the majority of lincRNAs
are composed by two exons [51].
To verify if the high number of monoexonic lincRNAs
was due to low coverage problems, we looked for a possible correlation between lincRNA structure and level
of expression. As shown in Additional file 2: Figure S8,
the expression level distribution of both monoexonic
and multiexonic lincRNAs is quite similar, suggesting
that monoexonic lincRNAs structure is not due to low
sample coverage.
We performed a similarity comparison between grape
lncRNA and the long non coding RNA identified in
Arabidopsis [13]. Despite the use of a relaxed e-value
threshold (blast e-value cutoff lower or equal to 1e−5),
Vitulo et al. BMC Plant Biology 2014, 14:99
/>
Page 10 of 16
Figure 6 Differential expression of splicing factor genes in different tissues and genotypes. Splicing factor average expression value
(FPKM) grouping the samples according to genotype (A) or tissue (B). Boxes on panel A shows the expression levels of the variants that were
significantly expressed between genotype. The number above each box represents the number of the isoform. Stars over the bar plots indicate
the comparisons that resulted significantly different (t-test with a p-value < 0.05 after FDR correction).
we identified a very small number of matches. In details
we found that only 61 intergenic, 6 intronic and 120
antisense non coding transcripts had at least one match.
This result confirms the observation that very few lncRNAs
are clearly conserved across species [30,37].
Analysis on the expression level revealed that lncRNAs
are on average 10-fold less abundant than protein coding genes (Figure 7, panel B). Similar results have also
been found both in Arabidopsis [13] and in vertebrates
[29,30,37] suggesting that short sizes and low expression
levels may be general characteristics of long non-coding
RNA and probably related to their differences in biogenesis,
processing, stability and function compared to mRNA.
We performed a principal component analysis of the
expression values of lncRNAs across all the samples.
Figure 8, panel A shows that the first two PCA components clearly indicate a tissue-specific expression pattern.
Moreover we investigated the expression of lncRNAs in
relation to stress conditions. Strong evidence support the
hypothesis that long non coding transcripts are involved
in the response to different stresses, including biotic
stresses and pathogen infections [13,14]. PCA analysis
however was unable to efficiently separate the samples
according to the stress condition, indicating that the
tissue-specificity has a stronger effect on lncRNA expression regulation. Nevertheless Venn diagrams of lncRNAs
distribution according to tissue (Figure 8, panel B) and
stress conditions (Figure 8, panel C), show that even
though many lncRNAs are tissue-specific, as already
suggested by PCA analysis, there is a considerable number of lncRNA that are induced by stress conditions.
We found 241 lncRNAs that are uniquely induced during
water stress, 186 during salt stress and 108 that are
common between the two stress conditions.
Vitulo et al. BMC Plant Biology 2014, 14:99
/>
Page 11 of 16
Data availability
The new v2 gene prediction, together with the long non
coding sequences and other useful information resources
on Vitis vinifera are available for download as flat files in
popular file formats (gff3, fasta) at bi.
unipd.it/grape. Data are also accessible through a web
based informatics infrastructure that integrates the data
giving the possibility to visualize and further analyze the
available data. The web resource hosts a genome browser,
a blast server to perform similarity search against the
genome, genes and long non coding sequences, and an
advanced query platform to perform complex queries.
The RNAseq data used in this study has been deposited at the NCBI Short Read Archive (i.
nlm.nih.gov/Traces/sra/sra.cgi) under the following SRA
accession: SRA110531 and SRA110619.
Figure 7 Long non coding expression and size distribution. (A)
Box-plot of the long non coding size distribution compared to the
coding sequence length. (B) Box-plot of the long non-coding expression
value distribution compared to the coding sequence expression.
Conclusions
In this paper we present an improved grape gene prediction, named v2, based on the incorporation of a great
amount of RNAseq data. A considerable number of new
genes have been identified, including many genes related
to lncRNAs. The sequencing libraries were produced with
a procedure that assured a high directional accuracy, that
is particularly important in the annotation of lncRNA and
for the identification of anti-sense RNAs. Furthermore,
with this study we have produced, for the first time in
grape, a comprehensive description of alternative splicing
in different tissues, genotypes and stress conditions. As
Figure 8 Long non coding expression analysis. (A) Principal component analysis of the expression values of the three different categories of
lnRNAs. (B) Venn diagrams showing the distribution of lnRNA among tissues (B) and stressed conditions (C).
Vitulo et al. BMC Plant Biology 2014, 14:99
/>
observed in Arabidopsis and now in grape, alternative
splicing and non coding RNAs contribute significantly
to the transcriptional complexity and they should be taken
into consideration in genome wide transcriptomic studies.
In plants, in particular in Arabidopsis, it has been shown
that many genes undergo regulated alternative splicing.
Serine/arginine-rich (SR) and heterogeneous nuclear
RNP (hnRNP) proteins are the main splicing factors (SF)
involved in constitutive as well as regulated AS. The level
of several SFs changes in different plant tissues [52] and
in this study (Figure 7, panel B) we showed that this is true
also in grape. Similarly, stress and environmental conditions produce specific SF changes [53,54]. Thus, changes
in the SF profile, driven by developmental and environmental conditions, contribute to the definition of the
splicing specifications to be applied in different circumstances (for a review see [55]).
Differences in alternative splicing have also been described between different ecotypes of Arabidopsis [56],
giving support to the argument that changes in splicing
may contribute to the evolutionary adaptation process.
A question that is still open is whether the changes in
splicing observed in different Arabidopsis ecotypes are
due to specific alterations of the splicing sites or if they
could be determined also by general modifications of the
splicing machinery.
In this paper we show that like Arabidopsis ecotypes,
also grape genotypes exhibit some splicing specificity.
Interestingly, when we investigated if this could be due
to changes in the splicing machinery we saw only minor
differences in the level of expression of the 18 SR genes
of grape (Figure 7, panel A), but when we investigated
at the level of individual SR isoforms we found some
very striking changes (Figure 7A, top frames). Another
interesting observation is that the SF isoforms that are
differentially expressed in the two genotypes did not show
differential regulation in tissues. This suggests a possible
mechanism of perturbation of the splicing machinery that
would interfere only marginally with the splicing specifications required in different tissues. A more detailed
description of these differences is given in Additional
file 2: Table S5 and S6 and Figure S9-S12.
The finding that plants that practically belong to the
same biological species have different splicing machineries
is very intriguing and leads to interesting considerations
and hypotheses. Since SFs affect also the splicing of their
own transcripts, small changes of the splicing machinery
may reshape the AS profiles to new points of equilibrium
where each SF panel will produce the same SF isoforms. A
more detailed knowledge of the specific role of each SF
will help to better understand this problem.
Finally, it should be considered that small changes of
the splicing machinery could play an important role in
evolutionary adaptation, providing an easy and quick
Page 12 of 16
generation of several “variations on the theme”, using parts
that have already been tested (the isoforms), but changing
their assortment. This could be particularly relevant in
the response to sudden and strong selective pressures.
Therefore, it would be interesting to verify whether
some of the intraspecific AS differences that are often
reported in different plant species and cultivars are due
to changes of individual splicing sites or if they could
result from the tuning of the splicing machinery.
Methods
Dataset
For a detailed description of the experimental design see
[38]. Briefly, 108 plants of 101.14 and M4 were grown in
a greenhouse and divided into 6 pools and exposed to
drought and salt stresses. The water stress treatment
was imposed decreasing gradually in 10 days the water
quantity from 80% to 30% of the field capacity. Leaves
and roots tissues were collected at 2 (time point T1), 4
(T2), 7 (T3) and 10 (T4) days after the beginning of the
stress experiment.
Salt stress treatment was imposed adding daily 5 mmol
of NaCl to plants with a water availability equal to 80%
of the field capacity. Leaves and roots tissues were collected from plants at 2 (T1), 4 (T2) and 10 (T3) days
after the beginning of the stress experiment. At each
time point of the two experiments, mRNA from nonstressed plants of both the two rootstocks grown with
a water availability equal to 80% of the field capacity
were sampled as controls.
All samplings were performed in two biological replicates producing a total of 52 leaves and 52 root samples.
Total RNA of all samples was extracted from leafs and
roots using the “SpectrumTM Plant total RNA Kit” (Sigma)
according to manufacturer instructions. Moreover we
included 20 RNAseq berry samples from Vitis vinifera
L. cv Cabernet Sauvignon (CS) grafted onto 1103P and
M4 rootstocks (Pasqua vigneti e cantine, Novaglie VR,
Italy). Grapevines were grown in well-watered conditions.
Whole berries were collected from 1103P (V. berlandieri x
V. Rupestris), and M4 bunches at 45, 59, 65 days after full
bloom (DAFB), in correspondence to the end of lag phase
when most of grape berries reached veraison. The other
samples (separating skin and pulp) were collected at 72,
86 and 100 DAFB. Total RNA was extracted from the
above cited samples using the method described in
[57]. These samples were sequenced using the same
technology.
Library preparation and sequencing
The mRNA was extracted from total RNA using the
Dynabead mRNA Direct kit (Invitrogen pn 610.12). We
obtained a variable quantity of mRNA from the total RNA
that ranged from 0.4 to 1.6%, with a mean value of 0.8%.
Vitulo et al. BMC Plant Biology 2014, 14:99
/>
We prepared the samples for Ligation Sequencing according to the SOLiD Whole transcriptome library preparation
protocol (pn 4452437 Rev.B). The samples were purified
before RNAse III digestion with Purelink RNA micro kit
columns (Invitrogen, pn 12183–016), digested from 3 min
to 10 min according the starting amount of mRNA, retrotranscribed, size selected using Agencourt AMPure XP
beads (Beckman Coulter pn A63881) and barcoded during
the final amplification. The libraries were sequenced using
Applied Biosystems, SOLiD™ 5500XL, which produced
stranded paired end reads of 75 and 35 nucleotides for the
forward and reverse sequences respectively. The average
insert size was 114 with a standard deviation of 49 bp, as
calculated on the aligned paired ends.
RNAseq genome alignment and filtering
The reads were aligned to the reference 12X grape genome using PASS aligner [40]. The percentage identity
was set to 90%, and one gap was allowed. For each read
we considered only the best alignment. In the case of
reads mapping in multiple sites, for gene prediction
we considered them all, while for gene expression we
considered only the reads mapping to unique genomic
positions. The spliced reads were identified using the
procedure described in PASS manual (bi.
unipd.it). We applied different filters to spliced reads
mapping in order to reduce the number of false positive.
These include the rejection of reads with an overlap length
less than 15 bases on one exon and with a total alignment
length of less than 40 bases. Additional filters based on
read coverage to improve the accuracy of the potential
new introns: 1) the splicing site need to be confirmed by
reads from both the replicates with a total read coverage
of at least 4; 2) in case the reads come from only one replicate, the read coverage was increased to 10.
Transcript reconstruction and gene prediction update
To improve read coverage, the biological replicates were
merged together. For each RNAseq library, we reconstructed the transcripts using three different programs:
Cufflinks version 2.0.2 [36], Isolasso [41] and Scripture
[37]. The programs were run using default parameters
except for Cufflinks option “-j” that was set to 0.3 in order
to increase the minimum depth of coverage in the intronic
region and IsoLasso option “-c” that was increased to 5 to
adjust the minimum number of clustered reads.
All the transcript models generated by the three programs were compared with each other using Cuffcompare
program from Cufflink package. We considered good
transcripts only those that were predicted with the same
genomic structure by at least two different programs.
Finally, the transcripts that were shorter than 150
nucleotides were considered false positives and removed
from further analysis.
Page 13 of 16
The obtained dataset was used to update the grape v1
gene prediction. The transcripts were aligned on the
genome using PASA [42], an eukaryotic genome annotation tool that uses spliced alignments of transcript
sequences to automatically model and update gene structures. PASA updated both the UTR regions and the gene
models and identified the alternatively spliced models.
Identification of new genes
Beside the v1 gene prediction update, we also performed
a new gene prediction in order to identify potentially new
genes. We used several tools and approaches based both on
de novo predictor and protein/transcripts sequenced based
alignment methods. We used a collection of 1.158.221
non redundant vidiriplantaea proteins and 7.897.336
eudicotyledons ESTs downloaded from NCBI ftp site.
The sequences were aligned on the genome using initially
a blast program [58] to quickly identify the similarity
regions and Exonerate [59] software to refine the alignment. We used a blast e-value cutoff of 1e−30 and 1e−5
for protein and nucleotide alignment respectively.
We used Augustus [60] de novo gene predictor trained
with the assemblies generated by PASA. The training
was performed using the automatic procedure available
at the Augustus web server [61]. Augustus prediction was
performed feeding the program with the whole RNAseq
data alignment.
The final gene prediction was obtained using EvidenceModeler (EVM) [62] software in order to combine ab
intio gene predictions, protein ESTs and PASA assemblies
alignments into weighted consensus gene structures. We
compared the gene models generated by EVM with the
updated grape gene prediction and identified a set of
6,381 new potential genes. We applied several criteria
to discriminate between true coding protein genes and
non-coding or gene model artefacts. At first, we excluded
all the genes showing a similarity with a miRNA gene or
predicted to be non-coding by CPC software [63]. Moreover, we performed a further filtering selecting all the
genes that fulfil at least one of the following criteria: i) an
homologous sequences on another species excluded V.
vinifera ii) presence of an interproscan predicted domain
iii) a RNAseq coverage of at least 50% of the gene model.
The final gene set was processed by PASA to add the UTR
regions and to calculate the alternatively spliced models.
Gene annotation
Gene annotation was performed using a combination of
software, tools and databases. At first we used InterProScan v4.8 [64], an integrated annotation system that
looks for protein domains and functional sites integrating
11 different databases. Secondly we performed a similarity
search at the protein level on the grape genes against the
non redundant databases using the blast algorithm [58].
Vitulo et al. BMC Plant Biology 2014, 14:99
/>
Page 14 of 16
Finally we performed gene ontology and KEGG annotation using a local version of blast2go [65].
dataset was used to perform a principal component analysis using “prcom” function in R environment.
Evaluation of the gene prediction quality
Splicing factor gene analysis
To identify fusion/splitting events, we compared the two
gene predictions using the cuffcompare program and
selected the genes in one prediction overlapping to two
or more genes in the other gene dataset. We used the
BLASP program to search each group of fused/split
genes against the Arabidopsis proteome using a evalue
cut-off equal or lower than 1e-5. If a v2 merged gene
showed the same best hit than the v1 split genes, we
considered it as correct. On the other hand if the split
v2 genes showed two different best hits we considered
them better than the v1 merged gene. When one of the
split genes do not show any similarity with Arabidopsis
proteins, we classified it as “Ambiguous”.
The genes from the two gene predictions mapping on
the same genomic locus but with a different coding
sequence were evaluated using a method similar to the
one described in [66] that implies a 2-steps analysis: at
first for each pair of sequences we performed a similarity
search against the Arabidopsis proteome and we identified
the two best hits. If the best hits were the same for both
the gene prediction, we re-aligned the two gene models
on the reference using a global alignment based on
Needleman–Wunsch algorithm implemented in the
program stretcher from EMBOSS package [67]. Alignments
having a percent identity below 30% were removed. In the
case of v2 alternative spliced genes, we aligned all the
isoforms against the Arabidopsis homologous protein and
we selected the variant with the highest score. The results
of this analysis are reported in Additional file 2: Table S4.
To assess differences in the expression level of the splicing
factor genes between both genotypes and tissues we
applied the t-test implemented in the statistical package
R. We grouped the samples according to genotype or
tissue and we considered as significant only those that
had a p-value equal or lower than 0.05 after FDR (False
Discovery Rate) correction.
Isoform quantification and analysis
The transcripts were quantified with two different programs, Cufflinks [36] and Flux-capacitor [68] and all the
further analyses were done independently using the
results from both the programs. In this manuscript we
report the results obtained using Cufflinks. All the other
results are available as Additional file 2. The transcript
abundances were quantified using both the replicates
for each sample. To constrain quantification errors, we
considered expressed only those genes with a FPKM value
of at least 1 on both the replicates. For the genes that
passed this first filter the expression value was calculated
as the mean of the FPKM values of the biological replicates.
Transcript switching analysis was performed identifying
for each alternative spliced gene those having two major
isoforms expressed in the highest number of samples. A
major isoform is defined as the transcript with the highest
expression value within a given sample. For each gene we
calculated the log ratio of the expression values between
the two transcripts across all the samples. The obtained
Long non coding prediction
The assemblies generated by Cufflinks were compared to
the v2 gene prediction using cuffcompare program. We
selected all the sequences with size of at least 200 bp
and labelled as intergenic (“u” code), intronic (“i” code)
and exonic overlap on the opposite strand (“x” code). In
order to discriminate between coding and non-coding
sequences we applied the following procedure. First we
ran the Coding Potential Calculator (CPC) program [63]
to assess the protein-coding potential of the transcripts.
The sequences predicted as non-coding were further
filtered according to InterProScan annotation [64] and
all the sequences with an annotated domain were removed.
Next, we checked for the presence of repeated sequences
using RepeatMasker program (eatmasker.
org/). Then, depending on the type of the sequences, we
applied some additional filters based on the genomic
context. We removed all intergenic transcripts that were
located within a 1 kb from the nearest genes. This filter
was used to reduce the risk of considering missing UTRs
as non-coding transcripts. Moreover, we deleted all the
intronic transcripts nearer than 100 base distance from
the flanking exons and with a length higher than 30% of
the length of the hosting intron. We applied these filters
to discriminate between genuine non-coding transcripts
and transcripts that arise because of possible non-mature
transcripts or intron retention events. Finally to reduce
the risk of artefacts, we removed all the antisense transcripts with an overlap shorter that 30% within an exon.
We quantified the transcripts abundance with Cufflinks
using the biological replicates of each sample. Only the
transcripts with an FPKM expression value of at least 1 on
both the replicates were considered for further analysis.
Additional files
Additional file 1: Excel, new gene set, tabular file with the new
identified genes.
Additional file 2: Supplementary data.
Additional file 3: Excel, overlap between V1 and V2 gene prediction.
Additional file 4: Excel, miRNA target site prediction.
Vitulo et al. BMC Plant Biology 2014, 14:99
/>
Abbreviations
AS: Alternative splicing; FPKM: Fragment per kilo base per million;
PCA: Principal component analysis; DAFB: Days after full bloom; FDR: False
discovery rate; CPC: Coding potential calculator.
Competing interests
The authors declare that they have no competing interests.
Authors’ contributions
NV performed the bioinformatic analysis and drafted the manuscript. CF and
AT set up the gbrowser and the web server. ECC contributed in the drafting
of the manuscript and participated in interpreting bioinformatic results. DC
contributed to the reads alignment procedure. CB and ML designed and
supervised the stress experiments. MC and AV prepared and provided the
RNA samples. MD and RZ performed SOLiD sequencing. GV supervised and
coordinated the study and drafted the manuscript. All authors contributed in
the discussion and interpreting of results and carefully read and approved
the final manuscript.
Acknowledgements
This research was supported by AGER, project SERRES, 2010–2105 and by
the Italian Epigenomics Flag-ship Project EPIGEN (MIUR/CNR). The computer
facilities were provided by Regione Veneto, project RISIB.
Author details
1
CRIBI Biotechnology Centre, University of Padua, Padua, Italy. 2Department
of Agronomy, Food, Natural resources, Animals and Environment, DAFNAE,
University of Padua, Padua, Italy. 3CIRVE, Centre for Research in Viticulture
and Enology, University of Padua, Padua, Italy. 4Department of Biology,
University of Padua, Padua, Italy.
Received: 12 December 2013 Accepted: 7 April 2014
Published: 17 April 2014
References
1. Jaillon O, Aury J-M, Noel B, Policriti A, Clepet C, Casagrande A, Choisne N,
Aubourg S, Vitulo N, Jubin C, Vezzi A, Legeai F, Hugueney P, Dasilva C, Horner
D, Mica E, Jublot D, Poulain J, Bruyère C, Billault A, Segurens B, Gouyvenoux M,
Ugarte E, Cattonaro F, Anthouard V, Vico V, Del Fabbro C, Alaux M, Di Gaspero
G, Dumas V, et al: The grapevine genome sequence suggests ancestral
hexaploidization in major angiosperm phyla. Nature 2007, 449:463–467.
2. Velasco R, Zharkikh A, Troggio M, Cartwright DA, Cestaro A, Pruss D, Pindo M,
Fitzgerald LM, Vezzulli S, Reid J, Malacarne G, Iliev D, Coppola G, Wardell B,
Micheletti D, Macalma T, Facci M, Mitchell JT, Perazzolli M, Eldredge G, Gatto P,
Oyzerski R, Moretto M, Gutin N, Stefanini M, Chen Y, Segala C, Davenport C,
Demattè L, Mraz A, et al: A high quality draft consensus sequence of the
genome of a heterozygous grapevine variety. PLoS One 2007, 2:e1326.
3. Fasoli M, Dal Santo S, Zenoni S, Tornielli GB, Farina L, Zamboni A, Porceddu A,
Venturini L, Bicego M, Murino V, Ferrarini A, Delledonne M, Pezzotti M: The
grapevine expression atlas reveals a deep transcriptome shift driving the
entire plant into a maturation program. Plant Cell 2012, 24:3489–3505.
4. Venturini L, Ferrarini A, Zenoni S, Tornielli GB, Fasoli M, Santo SD, Minio A,
Buson G, Tononi P, Zago ED, Zamperin G, Bellin D, Pezzotti M, Delledonne
M: De novo transcriptome characterization of Vitis vinifera cv. Corvina
unveils varietal diversity. BMC Genomics 2013, 14:41.
5. Zenoni S, Ferrarini A, Giacomelli E, Xumerle L, Fasoli M, Malerba G, Bellin D,
Pezzotti M, Delledonne M: Characterization of transcriptional complexity
during berry development in Vitis vinifera using RNA-seq. Plant Physiol
2010, 152:1787–1795.
6. Sweetman C, Wong DC, Ford CM, Drew DP: Transcriptome analysis at four
developmental stages of grape berry (Vitis vinifera cv. Shiraz) provides
insights into regulated and coordinated gene expression. BMC Genomics
2012, 13:691.
7. Santo SD, Tornielli GB, Zenoni S, Fasoli M, Farina L, Anesi A, Guzzo F,
Delledonne M, Pezzotti M: The plasticity of the grapevine berry
transcriptome. Genome Biol 2013, 14:r54.
8. Fernie AR, Tohge T: Plastic, fantastic! Phenotypic variance in the
transcriptional landscape of the grape berry. Genome Biol 2013, 14:1–3.
9. Perrone I, Pagliarani C, Lovisolo C, Chitarra W, Roman F, Schubert A:
Recovery from water stress affects grape leaf petiole transcriptome.
Planta 2012, 235:1383–1396.
Page 15 of 16
10. Vannozzi A, Dry IB, Fasoli M, Zenoni S, Lucchin M: Genome-wide analysis
of the grapevine stilbene synthase multigenic family: genomic
organization and expression profiles upon biotic and abiotic stresses.
BMC Plant Biol 2012, 12:130.
11. Filichkin SA, Priest HD, Givan SA, Shen R, Bryant DW, Fox SE, Wong W-K,
Mockler TC: Genome-wide mapping of alternative splicing in Arabidopsis
thaliana. Genome Res 2010, 20:45–58.
12. Marquez Y, Brown JWS, Simpson C, Barta A, Kalyna M: Transcriptome
survey reveals increased complexity of the alternative splicing landscape
in Arabidopsis. Genome Res 2012, 22:1184–1195.
13. Liu J, Jung C, Xu J, Wang H, Deng S, Bernad L, Arenas-Huertero C, Chua
N-H: Genome-wide analysis uncovers regulation of long intergenic
noncoding RNAs in Arabidopsis. Plant Cell 2012, 24:4333–4345.
14. Xin M, Wang Y, Yao Y, Song N, Hu Z, Qin D, Xie C, Peng H, Ni Z, Sun Q:
Identification and characterization of wheat long non-protein coding
RNAs responsive to powdery mildew infection and heat stress by using
microarray analysis and SBS sequencing. BMC Plant Biol 2011, 11:61.
15. Wang B-B, Brendel V: Genomewide comparative analysis of alternative
splicing in plants. Proc Natl Acad Sci 2006, 103:7175–7180.
16. Campbell MA, Haas BJ, Hamilton JP, Mount SM, Buell CR: Comprehensive
analysis of alternative splicing in rice and comparative analyses with
Arabidopsis. BMC Genomics 2006, 7:327.
17. Reddy ASN, Marquez Y, Kalyna M, Barta A: Complexity of the alternative
splicing landscape in plants. Plant Cell Online 2013, 25:3657–3683.
18. Barbazuk WB, Fu Y, McGinnis KM: Genome-wide analyses of alternative
splicing in plants: opportunities and challenges. Genome Res 2008,
18:1381–1392.
19. Ner-Gaon H, Leviatan N, Rubin E, Fluhr R: Comparative cross-species alternative splicing in plants. Plant Physiol 2007, 144:1632–1641.
20. Djebali S, Davis CA, Merkel A, Dobin A, Lassmann T, Mortazavi A, Tanzer A,
Lagarde J, Lin W, Schlesinger F, Xue C, Marinov GK, Khatun J, Williams BA,
Zaleski C, Rozowsky J, Röder M, Kokocinski F, Abdelhamid RF, Alioto T,
Antoshechkin I, Baer MT, Bar NS, Batut P, Bell K, Bell I, Chakrabortty S, Chen
X, Chrast J, Curado J, et al: Landscape of transcription in human cells.
Nature 2012, 489:101–108.
21. Gonzalez-Porta M, Frankish A, Rung J, Harrow J, Brazma A: Transcriptome
analysis of human tissues and cell lines reveals one dominant transcript
per gene. Genome Biol 2013, 14:R70.
22. Carninci P, Kasukawa T, Katayama S, Gough J, Frith MC, Maeda N, Oyama R,
Ravasi T, Lenhard B, Wells C, Kodzius R, Shimokawa K, Bajic VB, Brenner SE,
Batalov S, Forrest ARR, Zavolan M, Davis MJ, Wilming LG, Aidinis V, Allen JE,
Ambesi-Impiombato A, Apweiler R, Aturaliya RN, Bailey TL, Bansal M, Baxter
L, Beisel KW, Bersano T, Bono H, et al: The transcriptional landscape of the
mammalian genome. Science 2005, 309:1559–1563.
23. Carninci P, Hayashizaki Y: Noncoding RNA transcription beyond annotated
genes. Curr Opin Genet Dev 2007, 17:139–144.
24. Consortium TEP: An integrated encyclopedia of DNA elements in the
human genome. Nature 2012, 489:57–74.
25. Kim E-D, Sung S: Long noncoding RNA: unveiling hidden layer of gene
regulatory networks. Trends Plant Sci 2012, 17:16–21.
26. Wu H-J, Wang Z-M, Wang M, Wang X-J: Widespread long noncoding RNAs
as endogenous target mimics for MicroRNAs in plants. Plant Physiol 2013,
161:1875–1884.
27. Boerner S, McGinnis KM: Computational identification and functional
predictions of long noncoding RNA in zea mays. PLoS ONE 2012, 7:e43047.
28. Heo JB, Sung S: Vernalization-mediated epigenetic silencing by a long
intronic noncoding RNA. Science 2011, 331:76–79.
29. Cabili MN, Trapnell C, Goff L, Koziol M, Tazon-Vega B, Regev A, Rinn JL:
Integrative annotation of human large intergenic noncoding RNAs reveals
global properties and specific subclasses. Genes Dev 2011, 25:1915–1927.
30. Pauli A, Valen E, Lin MF, Garber M, Vastenhouw NL, Levin JZ, Fan L, Sandelin A,
Rinn JL, Regev A, Schier AF: Systematic identification of long noncoding RNAs
expressed during zebrafish embryogenesis. Genome Res 2012, 22:577–591.
31. Wang Z, Gerstein M, Snyder M: RNA-Seq: a revolutionary tool for
transcriptomics. Nat Rev Genet 2009, 10:57–63.
32. Li Z, Zhang Z, Yan P, Huang S, Fei Z, Lin K: RNA-seq improves annotation
of protein-coding genes in the cucumber genome. BMC Genomics 2011,
12:540.
33. Zhao C, Waalwijk C, de Wit PJGM, Tang D, van der Lee T: RNA-Seq analysis
reveals new gene models and alternative splicing in the fungal
pathogen Fusarium graminearum. BMC Genomics 2013, 14:21.
Vitulo et al. BMC Plant Biology 2014, 14:99
/>
34. Zhang G, Guo G, Hu X, Zhang Y, Li Q, Li R, Zhuang R, Lu Z, He Z, Fang X,
Chen L, Tian W, Tao Y, Kristiansen K, Zhang X, Li S, Yang H, Wang J, Wang J:
Deep RNA sequencing at single base-pair resolution reveals high complexity
of the rice transcriptome. Genome Res 2010, 20:646–654.
35. Mortazavi A, Williams BA, McCue K, Schaeffer L, Wold B: Mapping and
quantifying mammalian transcriptomes by RNA-seq. Nat Methods 2008,
5:621–628.
36. Trapnell C, Williams BA, Pertea G, Mortazavi A, Kwan G, van Baren MJ,
Salzberg SL, Wold BJ, Pachter L: Transcript assembly and quantification by
RNA-seq reveals unannotated transcripts and isoform switching during
cell differentiation. Nat Biotechnol 2010, 28:511–515.
37. Guttman M, Garber M, Levin JZ, Donaghey J, Robinson J, Adiconis X, Fan L,
Koziol MJ, Gnirke A, Nusbaum C, Rinn JL, Lander ES, Regev A: Ab initio
reconstruction of cell type-specific transcriptomes in mouse reveals the
conserved multi-exonic structure of lincRNAs. Nat Biotechnol 2010,
28:503–510.
38. Meggio F, Prinsi B, Negri AS, Di Lorenzo GS, Lucchini G, Pitacco A, Failla O,
Scienza A, Cocucci M, Espen L: Different biochemical and physiological
responses of two grapevine rootstock genotypes to drought and salt
treatments. Aust J Grape Wine Res 2013, />10.1111/ajgw.12071/abstract.
39. Grimplet J, Hemert JV, Carbonell-Bejerano P, Díaz-Riquelme J, Dickerson J,
Fennell A, Pezzotti M, Martínez-Zapater JM: Comparative analysis of
grapevine whole-genome gene predictions, functional annotation,
categorization and integration of the predicted gene sequences.
BMC Res Notes 2012, 5:213.
40. Campagna D, Albiero A, Bilardi A, Caniato E, Forcato C, Manavski S, Vitulo N,
Valle G: PASS: a program to align short sequences. Bioinforma Oxf Engl
2009, 25:967–968.
41. Li W, Feng J, Jiang T: IsoLasso: a LASSO regression approach to RNA-seq
based transcriptome assembly. J Comput Biol J Comput Mol Cell Biol 2011,
18:1693–1707.
42. Haas BJ, Delcher AL, Mount SM, Wortman JR RKS Jr, Hannick LI, Maiti R,
Ronning CM, Rusch DB, Town CD, Salzberg SL, White O: Improving the
Arabidopsis genome annotation using maximal transcript alignment
assemblies. Nucleic Acids Res 2003, 31:5654–5666.
43. DeYoung BJ, Innes RW: Plant NBS-LRR proteins in pathogen sensing and
host defense. Nat Immunol 2006, 7:1243–1249.
44. Foissac S, Sammeth M: ASTALAVISTA: dynamic and flexible analysis of
alternative splicing events in custom gene datasets. Nucleic Acids Res
2007, 35(suppl 2):W297–W299.
45. Reddy ASN: Alternative splicing of pre-messenger RNAs in plants in the
genomic era. Annu Rev Plant Biol 2007, 58:267–294.
46. Zhang B, Pan X, Cobb GP, Anderson TA: Plant microRNA: a small
regulatory molecule with big impact. Dev Biol 2006, 289:3–16.
47. Dai X, Zhao PX: psRNATarget: a plant small RNA target analysis server.
Nucleic Acids Res 2011, 39(Web Server issue):W155–159.
48. Yang X, Zhang H, Li L: Alternative mRNA processing increases the
complexity of microRNA-based gene regulation in Arabidopsis. Plant J
2012, 70:421–431.
49. Manley JL, Tacke R: SR proteins and splicing control. Genes Dev 1996,
10:1569–1579.
50. Reddy ASN: Plant serine/arginine-rich proteins and their role in pre-mRNA
splicing. Trends Plant Sci 2004, 9:541–547.
51. Derrien T, Johnson R, Bussotti G, Tanzer A, Djebali S, Tilgner H, Guernec G,
Martin D, Merkel A, Knowles DG, Lagarde J, Veeravalli L, Ruan X, Ruan Y,
Lassmann T, Carninci P, Brown JB, Lipovich L, Gonzalez JM, Thomas M, Davis
CA, Shiekhattar R, Gingeras TR, Hubbard TJ, Notredame C, Harrow J, Guigó
R: The GENCODE v7 catalog of human long noncoding RNAs: analysis of
their gene structure, evolution, and expression. Genome Res 2012,
22:1775–1789.
52. Kalyna M, Barta A: A plethora of plant serine/arginine-rich proteins:
redundancy or evolution of novel gene functions? Biochem Soc Trans
2004, 32(Pt 4):561–564.
53. Palusa SG, Ali GS, Reddy ASN: Alternative splicing of pre-mRNAs of
Arabidopsis serine/arginine-rich proteins: regulation by hormones and
stresses. Plant J Cell Mol Biol 2007, 49:1091–1107.
54. Tanabe N, Yoshimura K, Kimura A, Yabuta Y, Shigeoka S: Differential
expression of alternatively spliced mRNAs of Arabidopsis SR protein
homologs, atSR30 and atSR45a, in response to environmental stress.
Plant Cell Physiol 2007, 48:1036–1049.
Page 16 of 16
55. Syed NH, Kalyna M, Marquez Y, Barta A, Brown JWS: Alternative splicing in
plants–coming of age. Trends Plant Sci 2012, 17:616–623.
56. Gan X, Stegle O, Behr J, Steffen JG, Drewe P, Hildebrand KL, Lyngsoe R,
Schultheiss SJ, Osborne EJ, Sreedharan VT, Kahles A, Bohnert R, Jean G,
Derwent P, Kersey P, Belfield EJ, Harberd NP, Kemen E, Toomajian C, Kover PX,
Clark RM, Rätsch G, Mott R: Multiple reference genomes and transcriptomes
for Arabidopsis thaliana. Nature 2011, 477:419–423.
57. Ziliotto F, Corso M, Rizzini FM, Rasori A, Botton A, Bonghi C: Grape berry
ripening delay induced by a pre-véraison NAA treatment is paralleled by
a shift in the expression pattern of auxin- and ethylene-related genes.
BMC Plant Biol 2012, 12:185.
58. Altschul SF, Gish W, Miller W, Myers EW, Lipman DJ: Basic local alignment
search tool. J Mol Biol 1990, 215:403–410.
59. Slater GS, Birney E: Automated generation of heuristics for biological
sequence comparison. BMC Bioinforma 2005, 6:31.
60. Stanke M, Waack S: Gene prediction with a hidden Markov model and a
new intron submodel. Bioinformatics 2003, 19(suppl 2):ii215–ii225.
61. Stanke M, Steinkamp R, Waack S, Morgenstern B: AUGUSTUS: a web server for
gene finding in eukaryotes. Nucleic Acids Res 2004, 32(suppl 2):W309–W312.
62. Haas BJ, Salzberg SL, Zhu W, Pertea M, Allen JE, Orvis J, White O, Buell CR,
Wortman JR: Automated eukaryotic gene structure annotation using
evidence modeler and the program to assemble spliced alignments.
Genome Biol 2008, 9:R7.
63. Kong L, Zhang Y, Ye Z-Q, Liu X-Q, Zhao S-Q, Wei L, Gao G: CPC: assess the
protein-coding potential of transcripts using sequence features and
support vector machine. Nucleic Acids Res 2007, 35(Web Server issue):
W345–W349.
64. Zdobnov EM, Apweiler R: InterProScan–an integration platform for the
signature-recognition methods in InterPro. Bioinforma Oxf Engl 2001,
17:847–848.
65. Conesa A, Götz S, García-Gómez JM, Terol J, Talón M, Robles M: Blast2GO:
a universal tool for annotation, visualization and analysis in functional
genomics research. Bioinforma Oxf Engl 2005, 21:3674–3676.
66. Rice P, Longden I, Bleasby A: EMBOSS: the European molecular biology
open software suite. Trends Genet TIG 2000, 16:276–277.
67. Lorenzi HA, Puiu D, Miller JR, Brinkac LM, Amedeo P, Hall N, Caler EV:
New assembly, reannotation and analysis of the entamoeba histolytica
genome reveal new genomic features and protein content information.
PLoS Negl Trop Dis 2010, 4:e716.
68. Griebel T, Zacher B, Ribeca P, Raineri E, Lacroix V, Guigo R, Sammeth M:
Modelling and simulating generic RNA-Seq experiments with the flux
simulator. Nucleic Acids Res 2012, 40:10073–10083.
doi:10.1186/1471-2229-14-99
Cite this article as: Vitulo et al.: A deep survey of alternative splicing in
grape reveals changes in the splicing machinery related to tissue, stress
condition and genotype. BMC Plant Biology 2014 14:99.
Submit your next manuscript to BioMed Central
and take full advantage of:
• Convenient online submission
• Thorough peer review
• No space constraints or color figure charges
• Immediate publication on acceptance
• Inclusion in PubMed, CAS, Scopus and Google Scholar
• Research which is freely available for redistribution
Submit your manuscript at
www.biomedcentral.com/submit