Comparison of investigation methods of heat injury in grapevine (Vitis) and assessment to heat tolerance in different cultivars and species
Bạn đang xem bản rút gọn của tài liệu. Xem và tải ngay bản đầy đủ của tài liệu tại đây (824.34 KB, 10 trang )
Xu et al. BMC Plant Biology 2014, 14:156
/>
RESEARCH ARTICLE
Open Access
Comparison of investigation methods of heat
injury in grapevine (Vitis) and assessment to heat
tolerance in different cultivars and species
Hongguo Xu1,2, Guojie Liu1, Guotian Liu2,3, Bofang Yan2,3, Wei Duan2, Lijun Wang2* and Shaohua Li2,4*
Abstract
Background: In the context of global climate change, heat stress is becoming an increasingly important constraint
on grapevine growth and berry quality. There is a need to breed new grape cultivars with heat tolerance and to
design effective physiological defenses against heat stress. The investigation of heat injury to plants or tissues under
high temperature is an important step in achieving these goals. At present, evaluation methods for heat injury
include the gas exchange parameters of photosynthesis, membrane thermostability, chlorophyll content etc.;
however, these methods have obvious disadvantages, such as insensitivity, inconvenience and delayed information.
An effective and convenient method for investigating the heat injury of grapevine must be developed.
Results: In this study, an investigation protocol for a critical temperature (47°C) and heat treatment time (40 min)
was developed in detached grape leaves. Based on the results, we found that the OJIP test was superior to
measuring electrolyte leakage or photosynthetic O2 evolution for investigating the heat injury of three cultivars of
grapevine. Heat tolerance of 47 grape species and cultivars was evaluated through investigating heat injury using
the OJIP test. Moreover, the electron transport chain (donor side, acceptor side and reaction center) of PSII in
photosynthesis was further investigated.
Conclusions: The OJIP test was a rapid, sensitive and convenient method for investigating heat injury in grapevine.
An analysis of PSII function using this method indicated that the acceptor side was less sensitive to heat than was
the donor side or the reaction center in grape leaves. Among the 47 taxa evaluated (cultivars, hybrids, and wild
species), heat tolerance varied largely in each genotype group: most wild species and hybrids between V. labrusca
and V. vinifera had relatively strong heat tolerance, but most cultivars from V. vinifera had relatively weak heat
tolerance.
Background
Grapevine is the most economically important fruit crop
in the world, with its berries both eaten fresh and used
for making wine, jam, juice, jelly, raisins and vinegar.
Viticultural production is famously sensitive to climate
[1-3], and temperature and moisture regimes are among
the primary elements of grape terroir [3,4]. In many production regions, the maximum midday air temperature
* Correspondence: ;
2
Key Laboratory of Plant Resources and Beijing Key Laboratory of Grape
Science and Enology, Institute of Botany, the Chinese Academy of Sciences,
Beijing 100093, People's Republic of China
4
Key Laboratory of Plant Germplasm Enhancement and Specialty Agriculture,
Wuhan Botanical Garden, the Chinese Academy of Sciences, Wuhan 430074,
People's Republic of China
Full list of author information is available at the end of the article
may exceed 40°C, with some regions exceeding 45°C
[5-7]. High temperatures influence the development of
plants and inhibit leaf photosynthesis. Exposure to high
temperatures during flowering significantly inhibits berry
set [8]. After fruit set, high temperatures are generally
not favourable to the development secondary metabolites such as phenolic compounds [9,10] and aromatic
volatiles [7]. High temperatures stimulate sugar accumulation [8], resulting in the production of wines with
higher alcohol concentrations. To cope with heat stress,
it is necessary to breed new cultivars with strong heat
tolerance and to design effective physiological defenses
against heat stress. Consequently, developing an effective
and convenient method for evaluating the heat stress is
a key goal.
© 2014 Xu et al.; licensee BioMed Central Ltd. This is an Open Access article distributed under the terms of the Creative
Commons Attribution License ( which permits unrestricted use, distribution, and
reproduction in any medium, provided the original work is properly credited. The Creative Commons Public Domain
Dedication waiver ( applies to the data made available in this article,
unless otherwise stated.
Xu et al. BMC Plant Biology 2014, 14:156
/>
At high temperatures, cell injury and even death may
occur, which may be attributed to a catastrophic collapse
of cellular organization [11]. Several physiological traits
have been investigated as indicators of heat injury: gas
exchange parameters of photosynthesis, including net
photosynthesis rate, photosynthetic O2 evolution rates
and stomatal conductance [12-17]; membrane thermostability, including electrolyte leakage and the content of
thiobarbituric acid-reactive-substances (TBARS) [18-20];
chlorophyll content [21-23]. However, these methods all
have disadvantages, including insensitivity, inconvenience in field studies and the delay of information between the initial damage and the measurable effect(s).
At present, a rapid, sensitive and convenient method of
investigating heat injury for evaluating heat tolerance in
grapevine must be developed.
The cell membrane is thought to be a site of primary
physiological injury by heat stress [24]. The injury
inflicted on leaf tissues under high stress weakens the cell
membrane, which leads to a leakage of electrolyte out of
the cell. Thus, measuring electrolyte leakage is a common
evaluation method for heat injury. Photosynthesis, which
is the basis of yield and quality and has long been recognized as one of the most heat-sensitive processes in plants
[11], depends on the thylakoid membrane. However, it
is difficult to evaluate the heat injury for a large number
of plants by measuring the net photosynthesis rate with
a photosynthesis system (such as the Li-6400) or the
photosynthetic O2 evolution rates with an oxygen electrode system due to the time required per plant. Three
major heat-sensitive sites occur in the photosynthetic
apparatus or process: the photosystems, mainly photosystem II (PSII), and the ATP-generating and carbon assimilation processes [25,26]. Inactivation of PSII by heat
stress is related to damage of the donor side, the reaction center and the acceptor side of the photosystem’s
electronic transport chain [27]. The inhibition of PSII
leads to a change in variable chlorophyll a fluorescence,
and in vivo chlorophyll may be used to detect changes
in the photosynthetic apparatus [28,29]. Strasser et al.
[30] developed a method (chlorophyll a fluorescence
transient) for the analysis of the kinetics of fast fluorescence increases, using nondestructive measurements
that can be taken with a high resolution of 10 μs. All
oxygenic photosynthetic materials investigated to date
have shown a polyphasic increase in fluorescence consisting of a sequence of phases, denoted as O, J, I and P.
Therefore, the measurement of this chlorophyll a fluorescence transient is also called the OJIP test. The OJIP test
has become a powerful tool for the in vivo investigation of
PSII functioning, including its energy absorption, trapping
and electron transport [28,30-33]. In crops such as wheat,
cabbage and raspberry, the OJIP test has been applied
in the investigation of heat injury [34-36]. However, no
Page 2 of 10
complete comparison study has yet been conducted between the OJIP test and traditional methods such as the
measurement of electrolyte leakage and photosynthetic
O2 evolution rates, and no information exists on the use
of OJIP parameters for identifying heat tolerance in
grapevine germplasm.
The aims of this study were as follow: (1) to establish
a heat stress protocol for grapevine; (2) to determine
which method among the OJIP test, the measurement of
photosynthetic O2 evolution rates and electrolyte leakage
was superior for assessing the heat injury of grapevines;
and (3) to evaluate the heat tolerance of 47 grapevine
species or cultivars through determining heat injury by
the best method.
Results
The critical temperature (Tc) for the investigation of heat
injury of grapevines
For investigating the heat injury of grapevines, a critical
temperature (Tc) was first established. According to Weng
and Lai [37], Tc may be determined from the intersection
of the two regression lines extrapolated from the slowand fast-rising portions of the temperature-dependent
Fo and Fv/Fm responses obtained from the OJIP test
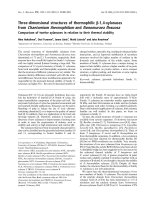
(see Method section). As shown in Figure 1, Fo and Fv/Fm
responded differently to a gradual increase of temperature in the leaves of ‘Jingxiu’, ‘Riesling’ and spine
grape. These values remained relatively stable below a
critical temperature, then started to increase (Fo) or decrease (Fv/Fm) sharply. Little difference was observed in
the critical values of ‘Jingxiu’, ‘Riesling’ and spine grape:
all were approximately 47°C based on the Fv/Fm (from
46.5°C to 47.8°C) and Fo (from 46.5°C to 47.1°C) values.
Therefore, 47°C was selected as the Tc for evaluating the
heat injury of grapevines.
The comparison of investigation methods for heat injury
of grapevines under Tc
The electrolyte leakage, photosynthetic O2 evolution rate
and OJIP test have all been used to evaluate the heat tolerance of plants [19,20,26,38,39]. We further compared
the characteristics of the above methods using the responses of leaf discs from ‘Jinxiu’, ‘Riesling’ and spine
grape to heat stress at Tc over 50 min. In the OJIP test,
we chose parameter Fv/Fm to investigate heat injury. In
the photosynthetic O2 evolution rate and electrolyte
leakage methods, the O2 evolution rate and relative injury index (RII) (indicating the degree of injury to the
cell membrane) were used as investigation parameters,
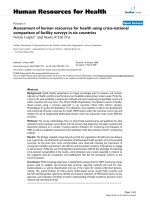
respectively. Following heat stress at Tc, the Fv/Fm and
O2 evolution rate values of the three grapevines gradually declined, while their RII values increased (Figure 2).
However, the sensitivity to heat stress varied among
the three cultivars. Significant differences in Fv/Fm
Xu et al. BMC Plant Biology 2014, 14:156
/>
Page 3 of 10
Figure 1 Establishing the critical temperature (Tc) for investigating the heat injury of grape leaves using the chlorophyll a fluorescence
parameters Fv/Fm and Fo. Tc was determined from the intersection of the two regression lines extrapolated from the slow- and fast-rising
portions of the temperature-dependent Fv/Fm and Fo response.
were observed among the three cultivars until after
20 min of heat stress, and significant differences in O2
evolution rates and RII were seen until after 30 min of
stress. Significantly lower Fv/Fm and O2 evolution
rates, as well as a higher RII, were observed in ‘Jinxiu’
than in spine grape. The values of the three parameters
in ‘Riesling’ fell between those of ‘Jinxiu’ and spine
grape. At 40 min after the application of heat stress,
the three cultivars differed significantly for Fv/Fm, O2
evolution rate and RII. Moreover, at this point, the difference among the three cultivars for Fv/Fm was significantly larger than for O2 evolution rate or RII. At the
end of the experiment, i.e., 50 min after the leaf discs
were subjected to heat stress, there was a significant
difference only in Fv/Fm among the three cultivars. For
both O2 evolution rate and RII, the significant differences disappeared between ‘Jingxiu’ and ‘Riesling’. In
general, the heat injury of spine grape was the least,
followed by the tolerances of ‘Riesling’ and ‘Jinxiu’
(Figure 2). The data indicated that 40 min is an appropriate duration of heat stress at Tc (47°C) for investigating the heat injury of grapevines and that the OJIP
test was the most suitable among the three methods
due to the sensitivity of its parameters.
Electron transport chain of PSII in grapevines under Tc
The OJIP test may also reveal information regarding the
electron transport chain of PSII [32]. The response of
the electron transport chain of PSII to heat stress under
Tc (47°C) was investigated using the OJIP test in ‘Jingxiu’,
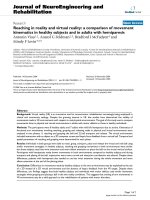
‘Riesling’ and spine grape. The value of Wk expresses the
changes of the amplitude in the K step in the OJIP test,
which is used as a specific indicator of damage to the PSII
donor side. In general, the Wk values of the three cultivars
increased sharply by 10 min after the initiation of heat
stress, then increased more slowly in ‘Jingxiu’ and ‘Riesling’ from 10 to 50 min over the experiment (Figure 3A).
However, the Wk of spine grape changed little after
10 min and was significantly lower than that of the other
two cultivars throughout the heat stress period. RCQA indicates the density of the PSII reaction centers [40,41].
The RCQA in all genotypes declined rapidly within 10 min
of heat stress and continued to decrease slowly over the
experiment at Tc. The density of RCQA in spine grape was
significantly higher than in the other two cultivars after
10 min (Figure 3B). The changes in the quantum yield of
electron transport (φEo) in the grape leaves during heat
stress are shown in Figure 3C. φEo was used as an indicator of the acceptor side of the electron transport chain of
Xu et al. BMC Plant Biology 2014, 14:156
/>
Figure 2 Comparison of the three investigation methods (OJIP
test, photosynthetic O2 evolution and electrolyte leakage) for
foliar heat injury in three grape cultivars (‘Jingxiu’, ‘Riesling’
and spine grape) under the critical temperature (47°C). Fv/Fm
represents the OJIP test method; RII represents the electrolyte
leakage method; and the O2 evolution rate represents the
photosynthetic O2 evolution method. Each value represents the
mean of five replicates, and the error bars represent ± S.E.
PSII [40,41]. Heat stress at 47°C altered the φEo values in
the grape leaves of all three cultivars. These values were
stable after 10 min of heat stress but rapidly decreased
thereafter. The spine grape and ‘Riesling’ had higher φEo
values than did ‘Jingxiu’.
Evaluation of heat tolerance in 47 cultivars (or species) of
grapevine under Tc
Generally, heat injury under heat temperature may indirectly reflect heat tolerance in plants. The more serious
heat injury, the weaker heat tolerance. In this study, for
evaluating heat tolerance of 47 grape cultivars (or species),
the parameter Fv/Fm of the OJIP test was chosen to
Page 4 of 10
Figure 3 The response of the electron transport chain of PSII,
including the donor side (Wk) (A), reaction center (RCQA) (B)
and acceptor side (φEo) (C) parameters, of the leaves of three
grape cultivars (‘Jingxiu’, ‘Riesling’ and spine grape) under the
critical temperature (47°C). Each value represents the mean of five
replicates, and the error bars represent ± S.E.
investigate their heat injury under Tc. We measured the
Fv/Fm of these genotypes in May, June and July of 2012
and June and July of 2013. Positive correlations for the
Fv/Fm values in these grape leaves were observed among
the different sampling times (Table 1). Our experiment
was conducted in Beijing (latitude from 39°26' to 41°03',
longitude from 115°25' to 117°30'), where the average
daily temperature (16°C–25°C) and lower rainfall in
May are more suitable for grapevine growth than are
conditions in June and July. Therefore, only the data
from May 2012 are reported in this paper, as shown in
Table 2. The Fv/Fm values varied greatly with the genetic
Xu et al. BMC Plant Biology 2014, 14:156
/>
Page 5 of 10
Table 1 Correlation analysis of the chlorophyll a fluorescence parameter Fv/Fm among different sampling times in
grape leaves under a heat stress of 47°C for 40 min
Fv/Fm (05/2012)
Fv/Fm (06/2012)
Fv/Fm (05/2012)
Fv/Fm (06/2012)
Fv/Fm (07/2012)
Fv/Fm (06/2013)
Fv/Fm (07/2013)
1
0.834**
0.623**
0.542**
0.602**
1
0.695**
0.683**
0.580**
1
0.640**
0.411**
1
0.480**
Fv/Fm (07/2012)
Fv/Fm (06/2013)
Fv/Fm (07/2013)
1
The asterisks * and ** indicate a significant correlation at P < 0.05 and P < 0.01, respectively.
backgrounds in each genotype group, especially in V.
vinifera. Most wild grapevines had higher Fv/Fm values
than did domesticated cultivars. The highest Fv/Fm
value was found in V. davidii (1, number in the Table 2,
same below) at 0.68, followed by a value of 0.62 in V.
ripara (10). V. rubra (9) had the lowest Fv/Fm value at
only 0.39. Interspecific hybrids among wild grapevines
had moderate Fv/Fm values, ranging from 0.54 to 0.32
with an average value of 0.43. However, interspecific
hybrids between V. vinifera and V. labrusca had relatively
high Fv/Fm values. The highest Fv/Fm values were found in
‘Kangtai’ (18) at 0.68, followed by ‘Mitsushiru’ (19) at 0.65.
‘Jingyou’ (26) had the lowest Fv/Fm value at 0.34. The
Fv/Fm values of the cultivars of V. vinifera ranged from
0.68 to 0.34, and most cultivars had lower Fv/Fm values.
The highest Fv/Fm values were found in ‘Riesling’ (28)
and ‘Cabernet Sauvignon’ (29) at 0.63 each, followed by
‘Black Balad’ at 0.61. ‘Jingyu’ (42), ‘Muscat Hamburg’ (45),
‘Cabernet Franc’ (43) and ‘Yan73’ (44) all had very low
Fv/Fm values of only 0.25, 0.24, 0.23 and 0.20, respectively.
To reveal the relationship between the electron transport chain of PSII and the heat tolrance of grape leaves,
the Fv/Fm, Wk , RCQA and φEo of the 47 grape cultivars
(or species) were further analyzed using correlation analysis based on the data from May 2012. Table 3 shows
that Fv/Fm was positively correlated with RCQA and φEo
but negative correlated with Wk, indicating that higher
Fv/Fm values were associated with higher RCQA and φEo
values but lower Wk values. These results suggest that
the heat tolerance of grapevine is associated with the
electron transport chain, including the donor side, reaction center and acceptor side of PSII.
Discussion
Methods of investigating heat injury in grapevines
As determined by Weng and Lai [37], Tc was easily calculated as 47°C using the OJIP test parameters of Fo and
Fv/Fm.. Based on this result, the heat injury of ‘Jingxiu’,
‘Reisling’ and spine grape was investigated using three
methods (OJIP test, photosynthetic O2 evolution rates
and electrolyte leakage). These methods led to the same
conclusion: the heat injury of spine grape was the least,
followed by ‘Riesling’ and ‘Jinxiu’. Although the three
methods obtained the same results, they exhibited different characteristics. First, the processes of measuring electrolyte leakage and photosynthetic O2 evolution rates were
more complex and required more time than the OJIP test
(see Methods section for details). Second, the measurement of electrolyte leakage and photosynthetic O2 evolution rates must be conducted in the lab and requires small
leaf discs. The former method requires a conductivity
meter and a water bath, while the later requires an oxygen
electrode system, a computer and a water bath. The OJIP
test can be conducted in the lab or the field, and either leaf
discs or whole leaves may be measured using the Handy
Plant Efficiency Analyzer (volume: 175 × 80 × 40 mm3;
Weight: 0.65 Kg). Third, measuring electrolyte leakage or
photosynthetic O2 evolution rates yields only a single parameter, but the OJIP test can produce several parameters,
including information regarding the electron transport
chain of the photosynthetic apparatus. Fourth, the sensitivity of the three methods differed. As shown in Figure 2,
significant differences in the Fv/Fm and O2 evolution rate
values among ‘Jinxiu’, ‘Riesling’ and spine grape appeared
after 30 min of heat stress at Tc, but differences in the RII
values appeared only after 40 min. After 50 min of heat
stress at Tc, the differences in O2 evolution rate and RII
values between ‘Jinxiu’ and ‘Riesling’ disappeared, but the
differences of Fv/Fm among the three cultivars remained.
In general, the OJIP test was a rapid, sensitive and convenient method for measuring heat injury in grapevine.
Moreover, the reproducibility of the method is very high,
as shown in the correlation analysis between different
years and different months (Table 1). Additionally, the
Handy Plant Efficiency Analyzer may be used directly in
the field. However, this evaluation relies primarily on
photosynthesis and does not consider other physiological
processes. The results of this study may be further applied in molecular breeding and quantitative trait analysis (QTL) by providing stable, sensitive phenotypic
data for heat injury.
Heat injury in grape leaves is related to the
photosynthetic electron transport chain of PSII
Photosynthesis, especially the electron transport chain of
PSII, is highly sensitive to high-temperature stress [42,43].
Xu et al. BMC Plant Biology 2014, 14:156
/>
Page 6 of 10
Table 2 Heat tolerance of grape cultivars or species evaluated using the chlorophyll a fluorescence parameter Fv/Fm
No
Cultivars or species
Fv/Fm
1
V. davidii
0.68 ± 0.01a
2
V. amurensis
0.55 ± 0.02bc
3
V. pseudoreticulata
0.41 ± 0.04e
4
V. flexuosa
5
V. bryoniaefolia
0.52 ± 0.04 cd
6
Shuangqing (V. amurensis)
0.58 ± 0.01bc
7
V. cinerea
0.55 ± 0.02bc
Germplasm group
Average Fv/Fm in a group
Wild grape
0.51 ± 0.03a
Hybrids among wild grape
0.43 ± 0.03ab
Hybrids between
V. vinifera and V. labrusca
0.50 ± 0.04a
V. vinifera
0.38 ± 0.03b
0.40 ± 0.02e
8
V. aestivalis
0.46 ± 0.03de
9
V. rubra
0.39 ± 0.03e
10
V. ripara
0.62 ± 0.01ab
11
5BB (V. berlandier × V. ripara)
0.33 ± 0.02c
12
5C (V. berlandier × V. ripara)
0.53 ± 0.04a
13
SO4 (V. berlandier × V. ripara)
0.50 ± 0.03ab
14
Beichun (V. vinifera × V. amurensis)
0.41 ± 0.03bc
15
Beihong (V. vinifera × V. amurensis)
0.32 ± 0.02c
16
Beifeng (V. vinifera × V. adstricta)
0.48 ± 0.01ab
17
Beta (V. labrusca × V. ripara)
0.44 ± 0.05ab
18
Kangtai
0.68 ± 0.01a
19
Mitsushiru
0.65 ± 0.01a
20
Kyoho
0.55 ± 0.03b
21
Takasumi
0.50 ± 0.02bc
22
Gaoqi
0.49 ± 0.02bc
23
Izunishiki
0.46 ± 0.04c
24
Jingya
0.44 ± 0.03c
25
Fujiminori Grape
0.35 ± 0.04d
26
Jingyou
0.34 ± 0.02d
27
Parasaurolophus
0.56 ± 0.02b
28
Riesling
0.63 ± 0.02a
29
Cabernet Sauvignon
0.63 ± 0.01a
30
Black balad
0.61 ± 0.03a
31
Red balad
0.51 ± 0.02b
32
Chardonnay
0.48 ± 0.04bc
33
Ruby Seedless
0.42 ± 0.03def
34
Alexander
0.39 ± 0.04cde
35
Xiangfei
0.37 ± 0.02def
36
Jingxiangyu
0.36 ± 0.03def
37
Italian Riesling
0.34 ± 0.07efg
38
Red Globe
0.34 ± 0.01efg
39
Merlot
0.33 ± 0.01efg
40
Cardinal
0.28 ± 0.02fgh
41
Gros Colman
0.28 ± 0.03gh
42
Jingyu
0.25 ± 0.01gh
43
Cabernet Franc
0.23 ± 0.02 h
Xu et al. BMC Plant Biology 2014, 14:156
/>
Page 7 of 10
Table 2 Heat tolerance of grape cultivars or species evaluated using the chlorophyll a fluorescence parameter Fv/Fm
(Continued)
44
Yan73
0.19 ± 0.02 h
45
Muscat
0.24 ± 0.02 h
46
Nilawa
0.25 ± 0.01gh
47
Jingyan
0.45 ± 0.02bcd
Values are means ± S.E; Different letters indicate means are significantly different at P < 0.05.
However, it is difficult to pinpoint the specific limiting
steps that control the temperature response of the electron transport chain [44]. In our study, the decrease of the
photosynthetic O2 evolution rate under heat stress was associated with electron transport capacity, which showed
that the PSII of the photosynthetic apparatus was damaged. The different sensitivities of the parameters derived
from the OJIP test may reflect the heterogeneous behavior
of PSII under heat stress conditions. Wk expresses the Kstep in the OJIP test, which is used as a specific indicator
of damage to the PSII donor side related to the oxygen
evolving complex (OEC) during heat stress. In this study,
the WK value increased significantly by 10 min in all grape
genotypes during the heat treatment, demonstrating that
the OEC is one of the most vulnerable complexes of the
photosynthetic electron transport chain. The results also
showed that the stability of the OEC differs among genotypes, as the OECs of ‘Jingxiu’ and ‘Riesling’ were more
vulnerable than those of the other genotypes.
The density of RCQA may reflect the density of QA-reducing PSII reaction centers [41], and the PSII reaction
center is also one of the sites damaged by heat stress
[45]. In our study, during heat stress at 47°C, the density
of RCQA decreased rapidly by 10 min for all genotypes,
which indicated that the PSII reaction center was sensitive to heat and that the thermostability of the PSII reaction center differed among cultivars. The parameter φEo
represents the quantum yield or the energy distribution
ratio of the acceptor side of PSII. The decrease in φEo
showed that the activity of electron transport beyond QA
was inhibited in grape leaves after 50 min of heat stress,
but after only 10 min, the φEo values showed almost no
change. These results indicated that while heat stress
damaged the acceptor side of PSII, this structure was
relatively stable in the initial stages of heat stress. The
Table 3 Correlation analysis among Fv/Fm, Wk, RCQA and
φEo
Fv/Fm
RCQA
φEo
Fv/Fm
RCQA
φEo
Wk
1.00
0.84**
0.79**
-0.41**
1.00
0.49**
-0.73**
1.00
-0.03
Wk
The asterisks * and ** indicate a significant correlation at P < 0.05 and
P < 0.01, respectively.
1.00
correlation analysis of the evaluation of different cultivars (species) further corroborated these results (Table 3).
Therefore, the OJIP test can also reveal the relationship
between heat injury in grape leaves and the photosynthetic electron transport chain of PSII.
Conclusions
The OJIP test was quicker, more sensitive and more convenient for investigating the heat injury of grape leaves
than were measurements of photosynthetic O2 evolution
rates or electrolyte leakage. Moreover, PSII functional
analysis using the OJIP test indicated that the acceptor
side of the photosystem II was less damaged by heat
than were the donor side or the reaction center in grape
leaves. The heat tolerance of 47 cultivars (or species) was
evaluated by determining heat injury using this method.
In general, the heat tolerance among cultivars or species
varied largely in each genotype group. Most wild species
and some hybrids of V. labrusca and V. vinifera had
relatively strong heat tolerance, while most cultivars of
V. vinifera had relatively weak heat tolerance.
Methods
Plant materials
A total of 47 wild species and cultivars were used in this
study (Table 4). All of the grapevines were planted at the
Germplasm Repository for Grapevines in the Institute
of Botany of the Chinese Academy of Sciences, located
in Beijing, in the spring of 1993. The vines, trained to
bilateral cordons, were spaced 1.5 m apart within the
row and 2.5 m apart between the rows with a northsouth row orientation. All vines were subjected to similar
management practices for irrigation, fertilization, soil
management, pruning, and disease control. Healthy
leaves of approximately 30 days in age were used in this
study. In May, June and July of 2012 and June and July
of 2013, samples were taken in the morning, placed in
the dark with the petiole in water, and then treated by
heat stress.
Heat stress process, critical temperature and appropriate
heat stress time
The heat stress process was as follows: leaf discs (5.5 cm
in diameter) were cut from the detached sample leaves,
wrapped in a wet paper towel and placed in a small
Xu et al. BMC Plant Biology 2014, 14:156
/>
Page 8 of 10
Table 4 Grape cultivars or species used in this study
Germplasm groups
Cultivar number Cultivars
Wild grape
10
V. davidii (1), V. amurensis (2), V. pseudoreticulata (3), V. flexuosa (4), V. bryoniaefolia (5), Shuangqing
(V. amurensis, 6), V. cinerea (7), V. aestivalis (8), V. rubra (9), V. ripara (10)
Hybrids among wild grape
7
5BB (V. berlandier × V. ripara) (11), 5C (V. berlandier × V. ripara) (12), SO4 (V. berlandier × V. ripara) (13),
Beichun (V. vinifera × V. amurensis) (14), Beihong (V. vinifera × V. amurensis) (15), Beifeng (V. vinifera ×
V. adstricta) (16), Beta (V. labrusca × V. ripara) (17)
Hybrids between V. vinifera
and V. labrusca
10
Kangtai (18), Mitsushiru (19), Kyoho (20), Takasumi
V. vinifera
20
(21), Gaoqi (22), Izunishiki (23), Jingya (24), Fujiminori Grape (25), Jingyou (26), Parasaurolophus (27)
Riesling (28), Cabernet Sauvignon (29), Black balad (30), Red balad (31), Chardonnay (32), Ruby
Seedless (33), Alexander (34), Xiangfei (35), Jingxiangyu (36), Red Globe (37), Italian Riesling (38),
Merlot (39), Cardinal (40), Gros Colman (41), Jingyu (42), Cabernet Franc (43), Yan73 (44), Muscat
Hamburg (45), Nilawa (46), Jingyan (47)
vessel made of aluminum foil. The vessels were then
floated on water in a temperature-controlled water bath.
To compare the effects of different evaluation methods
for heat injury and to evaluate heat tolerance in the
different species and cultivars, the critical temperature
(Tc) and appropriate heat stress time were first determined. According to the methods of Weng and Lai
[37], Tc is the temperature at which the chlorophyll a
fluorescence parameter Fo starts to increase sharply or
Fv/Fm decreases sharply. The experiment was conducted
in three cultivars or species: ‘Jingxiu’ (V. vinifera), ‘Riesling’
(V. vinifera) and spine grape (V. davidii) in May of 2012.
Leaf discs of each cultivar were heated from 25°C to 55°C
at a rate of approximately 1°C min−1 in darkness, according to the above heat stress process. Fv/Fm and Fo were
measured every 1–2 min using a Handy Plant Efficiency
Analyzer (Hansatech Instruments, King’s Lynn, Norfolk,
UK) (details shown below). Tc was determined from the
intersection of the two regression lines extrapolated from
the slow- and fast-rising portions of the temperaturedependent fluorescence parameter Fo or Fv/Fm responses.
To determine the appropriate heat stress duration, the leaf
discs were exposed to Tc for 50 min, and the Fv/Fm, electrolyte leakage and photosynthetic O2 evolution rates were
determined every 10 min. The time at which a significant
difference for each parameter was observed among the
three cultivars was regarded as the appropriate heat stress
time for the study.
Three methods of investigating heat injury (electrolyte
leakage, photosynthetic O2 evolution rate, chlorophyll a
fluorescence)
After determining the critical temperature and appropriate heat stress time, the three investigating methods,
electrolyte leakage, photosynthetic O2 evolution rate and
the OJIP test, were compared in May of 2012.
To measure electrolyte leakage, the heat-stressed leaf
discs (5.5 cm in diameter) were again cut into smaller
leaf discs (1 cm in diameter) and washed with deionized
water, then incubated in 10 ml of deionized water at
25°C for 6 h using a shaker. The initial electrical conductivity (E1) was read using a FE30 conductivity meter
(Mettler Toledo, Shanghai, China). The samples were
then boiled at 95°C for 60 min and cooled to 25°C before being measured again for electrical conductivity
(E2). The relative electrolyte leakage (REL) was estimated using the following formula: REL (%) = E1/E2 ×
100. The relative injury to cell membranes after heat
stress treatment (47°C) was calculated using the following
formula: RII (relative injury index) = TREL/CREL, where
T and C refer to the heat stress (47°C) and control (25°C)
temperatures, respectively [14].
The photosynthetic O2 evolution rates of the leaf discs
were measured using a ChloroLab-2 liquid-phase oxygen
electrode system (Hansatech Instruments, King’s Lynn,
Norfolk, UK), as described previously [46]. The heattreated leaf discs (5.5 cm in diameter) were first adapted
at 25°C in the dark for 30 min, then cut into smaller leaf
discs (1 cm in diameter) that were immediately placed into
a reaction chamber filled with 1.5 ml 50 mM Hepes-KOH
(pH 7.2), 0.5 mM CaSO4 and 20 mM NaHCO3. At the
same time, the leaf discs were exposed to a photon flux
density of 800 μmol m−2 s−1, which was provided by an
array of light-emitting diodes. After 10 min of equilibration under this light, the O2 evolution was measured,
and the data were continuously monitored for 10 min.
The O2 evolution rate was calculated over the last 3 min
of measurement [47].
The OJIP test was conducted using a Handy Plant
Efficiency Analyzer after the heat-stressed leaf discs
had been adapted at 25°C for 30 min in the dark. The
OJIP test was performed under a saturating photon flux
density of 3000 μmol m−2 s−1 provided by an array of three
light-emitting diodes (peak 650 nm). The fluorescence signals were recorded within a time span from 10 μs to 1 s,
with a data acquisition rate of 10 μs for the first 2 ms and
every 1 ms thereafter. The following data from the original
measurements were used: Fk: the fluorescence intensity at
300 μs [required for the calculation of the initial slope (M)
of the relative variable fluorescence (V) kinetics and Wk];
Xu et al. BMC Plant Biology 2014, 14:156
/>
Page 9 of 10
Fj: the fluorescence intensity at 2 ms (the J-step); Fi: the
fluorescence intensity at 30 ms (the I-step); and Fm: the
maximal fluorescence intensity (the P-step). The derived
parameters were as follows: Fo, the fluorescence intensity
at 50 μs; Wk, calculated as Wk = (Fk − Fo)/(Fj − Fo) and assumed to represents the damage to the oxygen evolving
complex (OEC) of PSII; and RCQA, calculated as the number of active PSII RCs per cross section (CS) at t = tm using
the formula RCQA = RC/CSm = φPo × (Vj/Mo) × (ABS/CSm)
and assumed to represent the density of QA-reducing
reaction centers (RCs). Here, ABS represents the total
photon flux absorbed by the PSII antenna pigments. According to the energy flux theory proposed by Strasser
et al. [47], the total ABS is partially trapped by the PSII
RCs, and the fraction of the ABS used to reduce QA is
labeled as TR, whereas the electron transport flux from
QA to QB is labeled as ET. The yield indices or flux ratios can then be derived as follows: the parameter φPo,
representing the maximum quantum yield of primary
photochemistry, is calculated as the ratio of TR/ABS at
t = 0 using the equation φPo = TRo/ABS = 1 – Fo/Fm =
Fv/Fm; the parameter φEo, representing the quantum yield
of the electron transport flux from QA to QB (at t = 0), is
calculated using the equation φEo = ETo/ABS = (Fm - Fj)/
Fm. All of these parameters are shown in Table 5.
Table 5 Summary of parameters, formulae and their
descriptions using data extracted from the OJIP test
Authors’ contributions
XHG performed the experiments and wrote the manuscript. LGJ designed
the experiment and reviewed the manuscript. WLJ designed the
experiments and wrote the manuscript. LGT and YBF helped perform the
experiments. DW helped design the experiment. LSH designed the
experiment and reviewed the manuscript. All authors have read and
approved the final manuscript.
Fluorescence
parameters
Fluorescence parameters description
Extracted parameters
Ft
F50
Fluorescence intensity at time t after onset
of actinic illumination
Minimum reliable recorded fluorescence at
50 μs with the Handy PEA
μs
Fk (F300 μs)
Fluorescence intensity at 300 μs
FP
Maximum recorded (=maximum possible)
fluorescence at P-step
Area
Total complementary area between
fluorescence induction curve and F = Fm
Derived parameters
Fo ≌ F50
μs
Minimum fluorescence, when all PSII RCs are
open
Fm = FP
Maximum fluorescence, when all PSII RCs are
closed
Vj = (Fj - Fo)/(Fm - Fo)
Relative variable fluorescence at the J-step
(2 ms)
Vi = (Fi - Fo)/(Fm - Fo)
Relative variable fluorescence at the I-step
(30 ms)
WK = (Fk - Fo)/(Fj - Fo)
Representing the damage to oxygen
evolving complex (OEC)
Mo = 4 (Fk - Fo)/(Fm - Fo)
Approximated initial increment (in ms-1) of
the relative variable fluorescence
Fv/Fm = 1- (Fo/Fm)
Maximum quantum yield of primary
photochemistry at t = 0
φEo = ETo/ABS = (Fm-Fj)/Fm Quantum yield for electron transport at t = 0
RCQA = φPo × (ABS/CSm) ×
(Vj/Mo)
Amount of active PSII RCs (QA-reducing PSII
reaction centers) per CS at t = m
Evaluation of heat tolerance in different grape cultivars
and species using OJIP test
The heat tolerance of the leaves of 47 grape cultivars (or
species) were evaluated in May, June and July of 2012
and June and July of 2013 based on the above heat stress
procedures. After the leaf discs were exposed to high
temperatures (47°C) for 40 min, the OJIP test was performed using a Handy Plant Efficiency Analyzer to investigate heat injury which indirectly reflects heat tolerance.
Statistical analysis
The data were processed using SPSS 13.0 for Windows,
and each value of the means and standard errors in the
figures represents five replications. Differences were considered significant at a probability level of P < 0.05 according to Duncan’s multiple range comparison.
Competing interests
The authors declare that they have no competing interests.
Authors’ information
Hongguo Xu and Guojie Liu: Co-first author.
Acknowledgements
This work was supported by the National Natural Science Foundation of
China (No. 31270718). We thank Prof. Grant Cramer, University of Nevada,
USA for critical reviews of the manuscript.
Author details
1
College of Agronomy and Biotechnology, China Agricultural University,
Beijing 100193, China. 2Key Laboratory of Plant Resources and Beijing Key
Laboratory of Grape Science and Enology, Institute of Botany, the Chinese
Academy of Sciences, Beijing 100093, People's Republic of China. 3University
of Chinese Academy of Sciences, Beijing 100049, People's Republic of China.
4
Key Laboratory of Plant Germplasm Enhancement and Specialty Agriculture,
Wuhan Botanical Garden, the Chinese Academy of Sciences, Wuhan 430074,
People's Republic of China.
Received: 13 April 2014 Accepted: 29 May 2014
Published: 5 June 2014
References
1. Meier N, Rutishauser T, Pfister C, Wanner H, Luterbacher J: Grape harvest
dates as a proxy for Swiss April to August temperature reconstructions
back to AD 1480. Geophys Res Lett 2007, 34(20):L20705.
2. Webb LB, Whetton PH, Bhend J, Darbyshire R, Briggs PR, Barlow EWR: Earlier
wine-grape ripening driven by climatic warming and drying and
management practices. Nat Clim Change 2012, 2(4):259–264.
3. White MA, Diffenbaugh NS, Jones GV, Pal JS, Giorgi F: Extreme heat
reduces and shifts United States premium wine production in the 21st
century. Proc Natl Acad Sci U S A 2006, 103(30):11217–11222.
4. Vaudour E: The quality of grapes and wine in relation to geography:
notions of terroir at various scales. J Wine Res 2002, 13(2):117–141.
Xu et al. BMC Plant Biology 2014, 14:156
/>
5.
6.
7.
8.
9.
10.
11.
12.
13.
14.
15.
16.
17.
18.
19.
20.
21.
22.
23.
24.
25.
26.
27.
Jones GV, White MA, Cooper OR, Storchmann K: Climate change and
global wine quality. Clim Change 2005, 73(3):319–343.
Salazar-Parra C, Aguirreolea J, Sanchez-Diaz M, Irigoyen JJ, Morales F: Effects
of climate change scenarios on Tempranillo grapevine (Vitis vinifera L.)
ripening: response to a combination of elevated CO2 and temperature,
and moderate drought. Plant Soil 2010, 337(1-2):179–191.
Schultz H: Climate change and viticulture: A European perspective on
climatology, carbon dioxide and UV-B effects. Aust J Grape Wine R 2000,
6(1):2–12.
Greer DH, Weston C: Heat stress affects flowering, berry growth, sugar
accumulation and photosynthesis of Vitis vinifera cv. Semillon grapevines
grown in a controlled environment. Funct Plant Biol 2010, 37(3):206–214.
Mori K, Goto-Yamamoto N, Kitayama M, Hashizume K: Loss of anthocyanins
in red-wine grape under high temperature. J Exp Bot 2007,
58(8):1935–1945.
Spayd SE, Tarara JM, Mee DL, Ferguson JC: Separation of sunlight and
temperature effects on the composition of Vitis vinifera cv. Merlot
berries. Am J Enol Viticult 2002, 53(3):171–182.
Wahid A, Gelani S, Ashraf M, Foolad MR: Heat tolerance in plants: an
overview. Environ Exp Bot 2007, 61(3):199–223.
Badger MR, Bjorkman O, Armond PA: An analysis of photosynthetic
response and adaptation to temperature in higher plants: temperature
acclimation in the desert evergreen Nerium oleander L. Plant Cell Environ
1982, 5(1):85–99.
Berry J, Bjorkman O: Photosynthetic response and adaptation to
temperature in higher plants. Annu Rev Plant Physiol Plant Mol Biol 1980,
31:491–543.
Chauhan YS, Senboku T: Thermostabilities of cell-membrane and
photosynthesis in cabbage cultivars differing in heat tolerance. J Plant
Physiol 1996, 149(6):729–734.
Herzog H, Chai-Arree W: Gas exchange of five warm-season grain legumes
and their susceptibility to heat stress. J Agron Crop Sci 2012, 198(6):466–474.
Stafne ET, Clark JR, Rom CR: Leaf gas exchange characteristics of red
raspberry germplasm in a hot environment. Hortscience 2000,
35(2):278–280.
Stafne ET, Clark JR, Rom CR: Leaf gas exchange response of 'Arapaho'
blackberry and six red raspberry cultivars to moderate and high
temperatures. Hortscience 2001, 36(5):880–883.
Nagarajan S, Bansal KC: Measurement of cellular membrane
thermostability to evaluate foliage heat tolerance of potato. Potato Res
1986, 29(1):163–167.
Rahman HU, Malik SA, Saleem M: Heat tolerance of upland cotton during
the fruiting stage evaluated using cellular membrane thermostability.
Field Crop Res 2004, 85(2–3):149–158.
Srinivasan A, Takeda H, Senboku T: Heat tolerance in food legumes as
evaluated by cell membrane thermostability and chlorophyll
fluorescence techniques. Euphytica 1996, 88(1):35–45.
Rosyara UR, Subedi S, Duveiller E, Sharma RC: The effect of spot blotch and
heat stress on variation of canopy temperature depression, chlorophyll
fluorescence and chlorophyll content of hexaploid wheat genotypes.
Euphytica 2010, 174(3):377–390.
Rosyara UR, Subedi S, Duveiller E, Sharma RC: Photochemical efficiency
and SPAD value as indirect selection criteria for combined selection of
spot blotch and terminal heat stress in wheat. J Phytopathol 2010, 158
(11–12):813–821.
Xu WW, Subudhi PK, Crasta OR, Rosenow DT, Mullet JE, Nguyen HT:
Molecular mapping of QTLs conferring stay-green in grain sorghum
(Sorghum bicolor L. Moench). Genome 2000, 43(3):461–469.
Basra AS, Cheema DS, Dhillongrewal R, Singh S, Basra RK: Proline and
polyamine accumulation in relation to heat tolerance in tomato. In
Adaptation of Food Crops to Temperature and Water Stress. ; 1993:493–495.
Allakhverdiev SI, Kreslavski VD, Klimov VV, Los DA, Carpentier R, Mohanty P:
Heat stress: an overview of molecular responses in photosynthesis.
Photosynth Res 2008, 98(1–3):541–550.
Stefanov D, Petkova V, Denev ID: Screening for heat tolerance in common
bean (Phaseolus vulgaris L.) lines and cultivars using JIP-test. Sci HorticAmsterdam 2011, 128(1):1–6.
Wise RR, Olson AJ, Schrader SM, Sharkey TD: Electron transport is the
functional limitation of photosynthesis in field-grown Pima cotton plants
at high temperature. Plant Cell Environ 2004, 27(6):717–724.
Page 10 of 10
28. Govindjee: 63 Years since Kautsky - chlorophyll-a fluorescence. Aust J
Plant Physiol 1995, 22(2):131–160.
29. Strasser BJ: Donor side capacity of Photosystem II probed by chlorophyll
a fluorescence transients. Photosynth Res 1997, 52(2):147–155.
30. Strasser RJ, Srivastava A, Tsimilli-Michael M: The fluorescence transient as a
tool to characterize and screen photosynthetic samples. In Probing photosynthesis: mechanisms, regulation and adaptation. Edited by Yunus M, Pathre
U, Mohanty P. London: Taylor and Francis; 2000:445–483.
31. Lin ZH, Chen LS, Chen RB, Zhang FZ, Jiang HX, Tang N: CO2 assimilation,
ribulose-1,5-bisphosphate carboxylase/oxygenase, carbohydrates and
photosynthetic electron transport probed by the JIP-test, of tea leaves in
response to phosphorus supply. BMC Plant Biol 2009, 9:43.
32. Srivastava A, Guisse B, Greppin H, Strasser RJ: Regulation of antenna
structure and electron transport in Photosystem II of Pisum sativum
under elevated temperature probed by the fast polyphasic chlorophyll a
fluorescence transient: OKJIP. Bba-Bioenerg 1997, 1320(1):95–106.
33. Strasser R, Srivastava A, Tsimilli-Michael M: Screening the vitality and
photosynthetic activity of plants by fluorescence transient. In Crop
Improvement for Food Security. ; 1999:79–126.
34. Molina-Bravo R, Arellano C, Sosinski BR, Fernandez GE: A protocol to assess
heat tolerance in a segregating population of raspberry using
chlorophyll fluorescence. Sci Hortic-Amsterdam 2011, 130(3):524–530.
35. Nyarko G, Alderson PG, Craigon J, Murchie E, Sparkes DL: Comparison of
cell membrane thermostability and chlorophyll fluorescence parameters
for the determination of heat tolerance in ten cabbage lines. J Hortic Sci
Biotech 2008, 83(5):678–682.
36. Sharma DK, Andersen SB, Ottosen CO, Rosenqvist E: Phenotyping of wheat
cultivars for heat tolerance using chlorophyll a fluorescence. Funct Plant
Biol 2012, 39(10–11):936–947.
37. Weng JH, Lai MF: Estimating heat tolerance among plant species by two
chlorophyll fluorescence parameters. Photosynthetica 2005, 43(3):439–444.
38. Georgieva K, Fedina I, Maslenkova L, Peeva V: Response of chlorina barley
mutants to heat stress under low and high light. Funct Plant Biol 2003,
30(5):515–524.
39. He J, Khoo GH, Hew CS: Susceptibility of CAM Dendrobium leaves and
flowers to high light and high temperature under natural tropical
conditions. Environ Exp Bot 1998, 40(3):255–264.
40. Chen HX, Li PM, Gao HY: Alleviation of photoinhibition by calcium
supplement in salt-treated Rumex leaves. Physiol Plantarum 2007,
129(2):386–396.
41. Li PM, Cheng LL, Gao HY, Jiang CD, Peng T: Heterogeneous behavior of
PSII in soybean (Glycine max) leaves with identical PSII photochemistry
efficiency under different high temperature treatments. J Plant Physiol
2009, 166(15):1607–1615.
42. Cao J: Govindjee: chlorophyll a fluorescence transient as an indicator of
active and inactive Photosystem- II in thylakoid membranes. Biochim
Biophys Acta 1990, 1015(2):180–188.
43. Chen LS, Cheng LL: The sun-exposed peel of apple fruit has a higher
photosynthetic capacity than the shaded peel. Funct Plant Biol 2007,
34(11):1038–1048.
44. Chen LS, Li PM, Cheng LL: Comparison of thermotolerance of sun-exposed
peel and shaded peel of 'Fuji' apple. Environ Exp Bot 2009, 66(1):110–116.
45. Strasser RJ, Stirbet AD: Heterogeneity of Photosystem II probed by the
numerically simulated chlorophyll a fluorescence rise (O-J-I-P). Math
Comput Simulat 1998, 48(1):3–9.
46. Sage RF, Kubien DS: The temperature response of C-3 and C-4
photosynthesis. Plant Cell Environ 2007, 30(9):1086–1106.
47. Strasser RJ, Srivastava A: Govindjee: polyphasic chlorophyll-alpha
fluorescence transient in plants and cyanobacteria. Photochem Photobiol
1995, 61(1):32–42.
doi:10.1186/1471-2229-14-156
Cite this article as: Xu et al.: Comparison of investigation methods of
heat injury in grapevine (Vitis) and assessment to heat tolerance in
different cultivars and species. BMC Plant Biology 2014 14:156.