Supplier service quality in supply chains of Indian SMEs: A dual direction dyadic perspective
Bạn đang xem bản rút gọn của tài liệu. Xem và tải ngay bản đầy đủ của tài liệu tại đây (917.07 KB, 22 trang )
Uncertain Supply Chain Management 7 (2019) 289–310
Contents lists available at GrowingScience
Uncertain Supply Chain Management
homepage: www.GrowingScience.com/uscm
Supplier service quality in supply chains of Indian SMEs: A dual direction dyadic perspective
Surjit Kumar Gandhia*, Anish Sachdevaa and Ajay Guptaa
a
Dr. B. R. Ambedkar National Institute of Technology Jalandhar- 144 011, Punjab, India
CHRONICLE
Article history:
Received April 12, 2018
Accepted August 8 2018
Available online
August 8 2018
Keywords:
Service Quality
Small and medium-sized
Enterprises (SMEs)
Service quality factors
Supplier
EFA
CFA
SEM
ABSTRACT
This paper investigates the role played by service quality at supplier-manufacturer dyad in
small-medium manufacturing units, and presents a model to establish that contribution of both
the supplier and manufacturer towards service quality could lead to satisfaction followed by
loyalty. The research design for this study includes a combination of literature survey,
exploratory interviews with practitioners, and a questionnaire survey conducted through
interview schedule from 120 respondents working in different small-medium manufacturing
units of North India. Structural equation modeling (SEM) is used for data analysis. The paper
develops dual directional scales to evaluate service quality at supplier-manufacturer dyad and
tests a set of four propositions. A model showing linkages of manufacturer (manufacturing
unit’s) service quality with supplier service quality leading to satisfaction and loyalty is also
developed. The model is empirically tested and is found to be fit. This study would be of
interest to SME managers particularly engaged in ‘purchase’ function and researchers working
on inter-firm supply chains in such units. This study recommends forming strong collaborative
relationships with suppliers to achieve a win-win situation.
© 2018 by the authors; licensee Growing Science, Canada
1. Introduction
The fierce competition of today’s marketplace is forcing small & medium-sized enterprises (SMEs) to
reshape their strategies in order to curtail overall cost and cut down inefficiencies. Therefore, there is a
growing recognition of building and nurturing relationships with supply chain partners for
improvements in profitability, serviceability and reduced costs in the supply chain (Kannan & Tan,
2003). Purchasing is the ultimate goldmine for success to supply-chain enterprises. Because of the
mutual benefits they offer (Autry & Golicic, 2010), partnerships or strategic alliances between suppliers
and manufacturers (i.e. buyers) have emerged as a popular business trend (Chen, 2011), and are being
looked upon as the wave of the future (Gupta & Singh, 2017).
Partnership with suppliers is recognized as a major purchasing strategy (Saleh & Sweis, 2017; Stanley
& Wisner, 2002). Partnership is a source of competitive advantage for both the supplier and the
manufacturing unit (Carr et al., 2008). Successful manufacturing organizations leverage on the direct
and indirect network of their suppliers to gain competitive advantage (Stanworth, 2012). Some of the
typical benefits of suppliers as a manufacturing channel partner can be envisaged as:
* Corresponding author
E-mail address: (S. K. Gandhi)
© 2019 by the authors; licensee Growing Science, Canada
doi: 10.5267/j.uscm.2018.8.002
290
Helps in reducing overhead costs through involvement in design, transportation etc.
Helps the manufacturer to focus on core issues.
Suppliers with large supply bases can act faster and deliver better quality of material and
services.
Suppliers may add on the service in the form of organizing training programmers, technical
services, design inputs, etc. for better service.
Suppliers with sound financial backups may provide cushioning against fluctuating fund flows.
Managing suppliers is critical to adding value in the supply chain since this function has both intrinsic
and extrinsic customers (Seth et al., 2006; Prakash, 2014). Supplier (extrinsic) service quality, SSQ
refers to the manner in which staff of the supplier unit serves the requisitions made by manufacturing
unit and what attitudes they hold towards the unit. Whereas, Manufacturer (intrinsic) service quality,
MSQ refers to the manner in which staff of the manufacturing unit facilitates the functioning of its
supplier and what attitudes they hold towards its employees.
In context of SMEs, supplier development is the practice of reducing the number of direct material
suppliers and forming strategic alliances with few selected suppliers and devoting resources to increase
firm’s performance and capabilities (Corsten & Felde, 2005). In the past, developing inter-firm linkages
with suppliers was considered to be uneconomical for manufacturing units because of the large supply
bases and distant relationships with suppliers (Gonzalez et al., 2004). Some of the issues regarded
critical to supplier relationship management (Gupta et al., 2014; Johnston & Kristal, 2008; Amad et
al., 2008) are as follows:
Reliance of the manufacturing units on a few dependable suppliers.
Consideration of quality vs. price tradeoff in selection of suppliers.
Appropriateness of information provided to suppliers by the manufacturing units.
Usefulness of the technical assistance provided to suppliers by the manufacturers.
Involvement of the manufacturer in its suppliers’ product development process.
The manufacturing units entering into long-term contracts with its suppliers.
Clarity of specifications provided to suppliers by the manufacturers.
Supplier partnership deals with the long-term relationship between the manufacturing unit and its
suppliers, and includes make/buy decisions and global sourcing. Small-medium manufacturing units
prefer to have few reliable suppliers, and are therefore reducing the number of suppliers, and sometimes
relying on a sole source. In an attempt to regain their competitiveness, these units should adopt the
Japanese Keiretsu system of manufacturers and suppliers working in lockstep (DeWitt et al., 2006).
For supply chain effectiveness, manufacturers and suppliers need to keep costs across the supply chain
low so that they result in lower market prices and higher margins. This is akin to gain-sharing
arrangements wherein everyone who contributes to greater profitability is rewarded.
The inter-firm linkages between the suppliers and small-medium manufacturing units could relate to
product, process, service and market, and through these linkages it is expected that the suppliers will
provide necessary support to its SMEs and contribute to the process of creating appropriate
technologies. In this backdrop the present research work has been undertaken (Holl, 2008).
Supply chain management is a big umbrella under which suppliers of supplier to end users are there. It
consists of all parties which are directly or indirectly involved in fulfilling the customer’s request.
Everyone is a customer of its upstream so customer focus & customer satisfaction are the key issues of
supply chain management. Viewed from customer’s side it is the quality of product, value for money
& post sales facilities. A key feature of present day business is the idea that it is the supply chains that
compete, not companies and the success or failure of supply chains is ultimately determined in the
S. K. Gandhi et al. / Uncertain Supply Chain Management 7 (2019)
291
marketplace by the end user i.e. consumer. As competition moves beyond a single firm into supply
chain, focus is shifting from management of internal practice alone (Nix, 2001). Demanding
competition in today's global markets, introduction of products with short life cycles, and the
discriminating expectations of customers have forced organizations to invest in, and focus attention on
supply chains as system which is affected by the environment (Gupta & Singh, 2015; Lusch et al.,
2007; Benton & Maloni, 2005; Tracey & Tan, 2001).
SME sector in India, once shielded by the Government policies of reservation, quota and license etc.,
but the sector is facing a number of challenges to survive due to globalization (Saranga, 2009). Studies
on Indian SMEs are largely confined to competitive priorities, manufacturing strategies, capacity
building, and innovation trends. The motivation to carry this research is due to following gaps identified
in literature.
• There are few studies that have been devoted to the analysis of ‘service quality in supply chain’
especially with manufacturing which indicates the lack of systematic effort in studying various
aspects of service related issues in Indian context.
• Though, there are many qualitative studies on performances measurements (frameworks, guidelines,
reviews etc.) but no study has focused on measuring the service quality in a quantitative frame work
based on supply chain orientation.
• Much of the research in service quality has focused on exploring relationships between few
intangible factors (service quality, satisfaction and loyalty) on different service sectors, except for
manufacturing sectors.
• There does not appear a systematic effort to study upstream, organizational and downstream issues
to investigate impact of service quality in supply chain.
• Most of the researchers considered only few factors to discuss the service quality. There is no
available literature which considers the tangible and intangible factors both to measure the service
quality.
• Most of the researchers discussed the various techniques which can be used to compare the factors
or some techniques which can be used to find an index value, but none of them have been applied
to find the value of service quality in supply chain in manufacturing industry in quantitative form.
Researchers suggest that service quality is positively associated with customer satisfaction (Izogo et
al., 2015; Arasli et al., 2005). Studies establish a positive relationship of service quality with customer
loyalty (Santouridis et al., 2012; Ganesan, 2007; Ehigie, 2006) too. Service quality is also linked to
behavioral outcomes as Word-of-Mouth, complaint, recommending, and switching (Yavas et al.,
2004).
In this paper, a focused review of literature was made to develop an instrument for conducting a
questionnaire survey. Application of EFA, CFA and SEM brings out a model to answer these questions.
2. Literature Review
A close relationship between channel participants shares the risks and rewards and has willingness to
maintain the relationship over the long-term (Kaynak, 2003; Cooper & Ellram, 1993). Carr and Pearson
(1999) also found that strong collaborative long-term relationship with key suppliers have a positive
influence on the firms’ financial performance. Commodity knowledge, cultivation of qualified
suppliers, and professionalism were rated as the three most important qualitative criteria (Jun & Cai,
2010). The continued association with partners enhances service quality of the channel. While there
292
have been studies concerning to product quality, very few have worked on facilitating the working of
supplier firms in supply chain.
It is well recognized that SMEs lack resources such as, technical, financial, efficient distribution, skilled
labor, etc. Lemma et al. (2015) viewed that one way to access these resources is to develop useful
horizontal linkages with upstream (supply-related) and downstream (distribution-related) supply chain
partners to earn the value from co-operative advantages. Inter-firm linkages can be broadly defined as
a process of setting up a continuous business relationship between enterprises in commercially and
economically advantageous activities for both parties involved.
Collaboration is a set of management levers that enables cost saving through transfer of best practices,
improve effectiveness of decision making through sharing of opinion, induces innovation through
cross-pollination of ideas and enhance capacity of collective action (Hansen & Nohria, 2004). Since
much of the value addition occurs in the upstream stages (i.e. supply function) of the supply chain,
manufacturers need to manage business-to-business relationships (B2B) with their suppliers.
Coordination, collaboration, commitment, communication, trust, flexibility, dependence, joint
engineering, and information technology based integration are possible if partners are contributing
equal value (Govindan et al., 2010; Wouters et al., 2007). To manage collaborative relationships, it is
critical to measure performance on service quality scales. Feedbacks on customer requirements,
capabilities of the manufacturing unit and its suppliers, and ongoing collaborations are vital as they
reveal the inner working of collaborative processes (Jagdev & Thoben, 2001).
In order to achieve results in the supply chain, it is critical to address supplier firms’ issues through
providing a nurturing and proactive work environment, and developing their competencies. By building
each other’s competencies and promoting a systems thinking can help eliminate functional bottlenecks,
develop a process perspective, and direct competencies towards integrative efforts. Leading
manufacturing organizations invest in skill up-gradation of supply chain partners by providing on-site
training on quality, lean operations, process improvement, and product design (Johnsen, 2009; Grant,
2005). Various issues related to relationship management in supply chain with respect to the supply
function are enlisted in table 1. Collaborative relationships characterized by trust and equitable winwin thinking, are the key to successful supply chains (Wu et al., 2010; Rogers et al., 2007).
Though, the output delivered by supplier firm is a well explored area in literature but studies on the
applicability of service quality attributes at supplier-manufacturer interface are nascent. Thus there is a
major scope for visualizing the attributes of supplier and manufacturer service quality, followed by
developing a model to establish their linkages with satisfaction and loyalty.
Table 1
Relationship Issues at the Supplier-Manufacturer dyad
Type
Characteristics
Dimensions
Development
Infrastructure
Information Exchange
Bilateral
Strength, Closeness, Physical proximity
Coordination, Collaboration, Commitment, Communication, Trust, Flexibility,
Dependence
Strategic/ Operational alignment
Partner selection intangible criteria, tangible criteria
Information Systems, Knowledge Transfer
Source: Prakash et al., 2011, Pagell et al., 2010, Johnsen, 2009
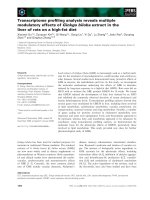
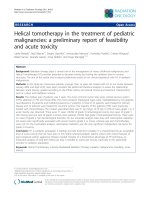
The study is conducted in exploratory framework using structured interview schedule. The framework
shown in Fig. 1 represents the possible relationship among the variables, which will be tested.
293
S. K. Gandhi et al. / Uncertain Supply Chain Management 7 (2019)
Feedback
Manufacturer
service quality
Supplier
service quality
Satisfaction
Loyalty
SME
unit
Service Quality
delivered by the
Suppliers to the
manufacturing unit
Outcome variables
Satisfaction
Loyalty
Service Quality
offered by the
Manufacturing unit
to the Suppliers
Fig. 1. Conceptual Research Framework
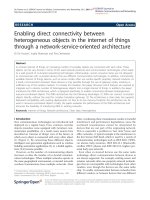
Parasuraman et al. (1985, 1988) in their pioneering work identified five components of service quality
viz. reliability, assurance, tangibles, empathy, and responsiveness. These five dimensions used to
evaluate service quality are called SERVQUAL dimensions. Carr (2007) proposed a major limitation
of SERVQUAL scale by stating that it does not consider equity theory for selection of SQ determinants,
though it is well established that SME suppliers as well as manufacturers do evaluate service by way
of ‘fairness’ is often evaluated in business encounters.
Service Quality
Reliability
Satisfaction
Responsiveness
Assurance
Service loyalty
Empathy
Tangible
Fairness
Fig. 2. Relationship between Independent, Mediating and Dependent Variables
294
The hybrid scale comprising FAIRSERV (Carr, 2007), in conjunction with SERVQUAL (Parasuraman
et al., 1988) is considered suitable for this study, since its outcome parameters are satisfaction and
loyalty intensions. The preliminary questionnaire is on five attributes of SERVQUAL scale and
“Systematic Fairness” dimension of FAIRSERV model. Taking cues from both existing scales to
measure service quality, we have made a modest attempt at designing a new scale based on the
combination of the two metrics. Fig. 2 depicts the relationship of the Exogenous, Intervening, and
Endogenous variables used in this research.
3.
Research Methodology
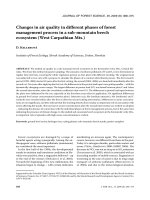
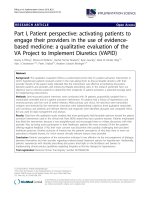
Fig. 3 shows the methodology used for determining factors of manufacturer and supplier service quality
followed by establishing their linkages with satisfaction and loyalty. This work is based on studies
conducted by Seth et al. (2006) and Prakash (2011).
The questionnaire was generated using with a focus on supply related issues using a combination of
SERVQUAL (Parasuraman et al., 1985, 1988) and FAIRSERV (Carr, 2007) scales. It was refined after
focus group discussion with five managers working in different SMEs and three academicians with
work published in similar area.
The questionnaire thus emerged comprised four sections as follows:
Section-A comprises 21 items related to service quality offered by the manufacturer towards
supplier (MSQ) and 1 item measuring overall manufacturer service quality (OMSQ).
Section-B consists of 24 items related to service quality delivered by supplier (SSQ) and 1 item
measuring overall supplier service quality (OSSQ).
Section-C consists of two outcome variables viz. satisfaction (mapped by 2 items) and loyalty
(mapped by 3 items).
Section-D focuses focused on gathering the demographic information.
The research methodology is based on empirical data collected through interview schedule. The
objective of survey was to examine supplier service quality (internal & external) in supply chain with
relevant data collected from Indian manufacturing small-medium manufacturing units. Research
parameters (R-A-T-E-R-F) selected were based on insights gained through literature and extensive field
visits as well as exploratory interviews with professionals.
The pilot study was conducted in May-July, 2017. The main survey was conducted from August 2017
to February 2018 by approaching working executives personally and in majority of cases, interviewer
himself filling the questionnaire sitting along with them. The advantages of interviewer soliciting the
question, details and explanations, an opportunity administer highly complex questionnaires, improved
ability to contact hard to reach populations, higher response rates, and increased confidence that data
collection instructions are followed (Froza, 2002). This was felt necessary in order to reach response
rate of more than 50% in operations management discipline (Flynn et al. 1990). Kang & Bradley (2002)
also recommended ‘in- person distribution and collection method’ for improving the response rate.
Some blank questionnaires were also left with some executives with some executive with a request of
getting completed from executives known to them. A covering letter describing the objectives the
research was also enclosed.
Prior appointments were arranged for explaining and distributing questionnaires majority of cases the
responses from the executives were collected on the same day. Sometimes, on the request from the
executives, the questionnaires were left with the executive and then collecting personally on the
scheduled day. The purpose of this approach was to enhance the response rate and improve the quality
of data.
295
S. K. Gandhi et al. / Uncertain Supply Chain Management 7 (2019)
The method of snowball sampling (Nargundkar, 2003) was used to execute this survey. The
respondents were top executives of supplier firms working for small-medium manufacturing units
located in North India. Respondents were asked to respond their perceptions of service quality that was
being offered to them by manufacturing units manufacturing units on 5-point Likert scale. The
researcher approached 165 respondents serving in different small-medium manufacturing units and was
able to elicit data from 120 respondents, thus fetching a response rate of 73% which was quite
satisfactory. Majority of the respondents belonged to the top management of unit including Proprietors,
MDs, Unit Heads, Chief Works Managers, GMs, Sales Managers, Logistics In-charge, Executive
Engineers, Heads of different departments & sections etc.
Literature Review
Do items
have high
loading?
Selection of representative
items to measure service quality
No
Removal of
items with
loadings
<0.5
Yes
Exploratory Interviews
with practitioners, consultants
and academicians
Confirmatory Factor Analysis
(through Structural Equation
Modeling approach using
AMOS v21)
Data
Analysis
Survey Design
Removal of
items that
affect the
objective
No
Sampling
Development of survey
questionnaire with the final
list of items to measure
service quality
Pilot
Testing
Yes
Survey Administration
Data Collection from professionals
at various levels from different
SMEs
Removal
of items to
improve
Reliability
No
Do items
possess
Reliability?
No
Establishing Validity
a) Content Validity
b) Construct Validity
c) Predictive Validity
Yes
Development of Validated
Structural Model for establishing
linkages with satisfaction, and
loyalty
Final scale to measure service
quality at Supplier-Manufacturer
dyad
Yes
Exploratory Factor Analysis
Learning and consolidation of
findings
(Principal Components Analysis
with Varimax Rotation using
SPSS 21.0)
Fig. 3. Flow chart of research methodology adopted for measurement and modeling of service quality at
Supplier-Manufacturer interface
296
The type of manufacturing activity being carried by the respondent units is shown in table 2.
Table 2
Type of product being manufactured by respondent units (N = 120)
Type of Manufacturing Unit
Number & Percentage
Type of Product
Auto Parts
Hand Tools
Casting Components
Valve manufacturing
Rolled Products
Machine Tools
Sheet Metal Components
Fasteners
Multi Products
Small Scale
87 (73%)
Medium Scale
33 (27%)
26 (≈22%)
15 (≈13%)
12 (≈10%)
9 (≈8%)
6 (≈5%)
6 (≈5%)
5 (≈4%)
4 (≈3%)
4 (≈3%)
9 (≈8%)
5 (≈4%)
4 (≈3%)
4 (≈3%)
4 (≈3%)
3 (≈2%)
2 (≈2%)
2 (≈2%)
Nil
The demographic distribution of respondents is presented in Table 3. The respondents have been
categorized on the basis of number of years of experience, qualifications, and functional area of work.
Table 3
Demographic distribution of respondents (N = 120)
Experience
Distribution
n
2- 5 years
42
6-10 years
24
11-15 years
26
16-20 years
16
above 20 years
12
%
35
20
22
13
10
Qualification
Distribution
MBA/M.Tech./M.Sc.
BBA/B.Tech./B.Sc.
MA/BA/B.Com.
Technical Diploma
Intermediate/below
n
16
43
24
22
15
%
13
36
20
18
13
Functional Area of work
Department
n
Procurement
48
Inventory/Store
28
Marketing/Sales
20
Production
14
Quality Control
10
%
40
23
17
12
08
We find that most of the respondents have work experience in the range 2 to 10 years, hold engineering
qualification, and work in the areas of personnel management.
4. Data Analysis
Since the factors of the scale along with indicators used to measure MSQ and SSQ are synthesized from
the literature, the imperative is first to assess the scales for reliability, EFA and CFA.
4.1. Reliability Analysis
The reliability of both MSQ and SSQ scales was analyzed using Cronbach alpha coefficient (Cronin &
Taylor 1992; Lee et al., 2000) using IBM SPSS v21 and the output is depicted in table 4.
Table 4
Reliability Analysis of items in MSQ and SSQ scale
Service Quality Measurement
Value of α
Finding
MSQ items (n = 21)
SSQ items (n = 24)
0.926
0.897
Quite Good (Nunnally & Bernstein, 1978).
4.2. Exploratory Factor Analysis (EFA)
EFA is a multivariate statistical technique commonly used to explore the dimensionality of a
measurement. The IBM SPSS v21 was used for this purpose. The main objective of using EFA in this
paper is to group the factors into various sub-groups for making further analysis simpler. Prior to
application of EFA, Bartlett test of Sphericity is used to verify appropriateness of factor analysis (Hair
297
S. K. Gandhi et al. / Uncertain Supply Chain Management 7 (2019)
et al., 2010). To check whether the sample size is adequate or not, Kaiser-Meyer-Olkin (KMO) test of
sample adequacy (N= 120, in this case) and significance value was performed. The value of KMO
greater than 0.6 with the value for significance less than 0.005, indicate data size is sufficient for
grouping the various relevant factors (Tabachnick & Fidell, 2007). The score of Bartlett test of
sphericity and the KMO value is depicted in Table 5.
Table 5
KMO and Bartlett's Test of Sphericity
KMO Measure for Sampling Adequacy
Bartlett's Test of Sphericity
MSQ scale
.888
2101
210
.000
2101
210
.000
SSQ scale
.880
2221
231
.000
The results being significant, indicate the suitability for factor analysis (Hair et al., 2010).
EFA conducted using the Principle Component Analysis (PCA) with Kaiser Normalization (Eigen
values greater than 1) and varimax rotation procedure resulted in the extraction of five factors each
for MSQ and SSQ scale, explaining 74.802 and 73.301 per cent of the variance respectively. These
factor loadings are consistent with the suggested factor structure of the scale. Output of exploratory
factor analysis using SPSS v21 is presented in Table 6 and Table 7.
Table 6
Communalities, Factor Structure and Loadings for Items of MSQ
S. No.
Factors and Associated Items
Communalities
Assurance
1. Long term collaborative relationship
2. Purchase orders are timely and accurate
3. Has modern and adequate physical facilities
4. Possesses right tools and equipment
5. Terms & conditions are fair with supplier
6. Confidentiality in transactions
Communication
7. Honest in providing information/ financial
data
8. Pays attention to suppliers’ views in
dealings
9. Shares information related to inventory
10. Inform changes in manufacturing schedule
11. Prompt feedback about quality of products
12. Have latest IT infrastructure
Alignment
13. Flexible approach in dealing with suppliers
14. Shares company’s future plans with
suppliers
15. Equitable sharing of responsibilities
16. Shares knowledge/training/innovation base
17. Based at convenient & approachable
location
Responsiveness
18. Willingness to share supplier problems
19. Supplier’s queries are heard & solved
promptly
20. Respect and positive attitude for supplier
21. Values convenience of suppliers
Reliability (Cronbach Alpha Value) of identified factors
.859
.851
.851
.821
.735
.698
Factor Structure and loadings
.879
.881
.882
.890
.822
.699
.792
.854
.540
.667
.647
.760
.816
.635
.756
.833
.853
.761
.693
.819
.736
.820
.811
.852
.803
.863
.865
.869
.698
.604
.814
.730
.630
Principal Component Method with Varimax Rotation Loading ≥ .56 (Pitt et al., 1995)
.947
.911
.939
.735
.828
.714
.814
298
As shown in above Table 6, the extracted factors were named as: Assurance, Communication,
Alignment, and Responsiveness. All the items have significant communalities (not less than 0.50) (Hair
et al., 2010) and significant factor loadings (not less than 0.55) (Pitt et al., 1995). Internal reliability of
the items of the various factors of the MSQ scale is examined using the Cronbach alpha coefficients
(Bagozzi & Yi, 1988). In this analysis, reliability score for each factor ranges from 81.4% to 94.7 % as
shown in Table 6 and hence is acceptable (Nunnally & Bernstein, 1978).
Likewise on the SSQ scale, the five factors were named as: Credibility, Relationship, Alignment,
Understanding, and Dependability. All the items have significant communalities and factor loadings.
The reliability score for each factor ranges from 83.6% to 95.1% as shown in table 7 and hence is
acceptable.
Table 7
Communalities, Factor Structure and Loadings for Items of SSQ Scale
S. No.
Factors and Associated Items
Credibility
1.
Supplier has strong market reputation
Supplier has financial strength
2.
Supplier has flexibility to change product
3.
design
Supplier has required
4.
knowledge/expertise/skills
Has competent & technically sound employees
5.
Supplier is innovative in operations
6.
Supplier has latest IT infrastructure
7.
Relationship
Supplier has long-term relationship with your
8.
unit
Supplier agrees to flexible terms & conditions
9.
10. Supplier has willingness to serve your unit
11. Supplier’s employees are polite & courteous
12. Supplier is fair in dealings with your unit
13. Terms & conditions with your unit are fair
Alignment
14. Supplier uses right tools/equipment/technology
15. Supplier has modern & certified facilities
16. Supplier is easily approachable
17. Supplier has quick solutions to
failures/complaints
Understanding
18. Supplier understands requirements of your unit
19. Supplier values your convenience
20. Shares work related information and
knowledge
21. Honest in providing information/access to you
Dependability
22. Delivers right quality and quantity in right
time
23. Supplier charges minimum price for supplies
24. Supplier maintains confidentiality in
operations
Reliability (Cronbach Alpha Value) of identified factors
Communalities
Factor Structure & loadings
.707
.854
.766
.866
.792
.864
.794
.813
.745
.792
.843
.846
.797
.872
.677
.622
.736
.645
.689
.720
.763
.702
.646
.698
.700
.686
.712
.775
.695
.706
.812
.859
.815
.884
.689
.726
.682
.778
.827
.801
.753
.646
.848
.857
.812
.766
.849
.836
Principal Components Method with Varimax Rotation Loading ≥ .53 (Pitt et al., 1995)
.894
.951
.861
.836
.872
299
S. K. Gandhi et al. / Uncertain Supply Chain Management 7 (2019)
4.3. Confirmatory Factor Analysis (CFA)
CFA is undertaken to further validate the scales for measuring MSQ and SSQ. CFA model is run
using SPSS AMOS v21, for 4 individual factors describing MSQ scale and 5 factors describing
SSQ scale, with respective items. Table 8 shows the key model fit indices for the individual factors.
Table 8
Key fit Indices for measurement model of MSQ and SSQ scale
MSQ scale
Factors
Assurance
Communication
Alignment
Responsiveness
SSQ scale
Factors
Credibility
Relationship
Alignment
Understanding
Dependability
Cmin/df
1.346
1.337
.760
.367
RMR
.009
.024
.008
.012
GFI
.982
.970
.990
.997
NFI
.991
.978
.994
.995
CFI
.998
.994
1.000
1.000
RMSEA
Cmin/df
.496
.968
3.232
.529
---
RMR
.007
.018
.018
.013
.000
GFI
.987
.982
.974
.996
1.000
NFI
.994
1.000
.972
.994
1.000
CFI
1.000
1.000
.980
1.000
1.000
RMSEA
.000
.000
.037
.000
---
.054
.053
.000
.000
Since all the GFI values are greater than 0.9, the validation of individual factors of CFA models is
established (Hair et al., 2010).
4.4.
CFA matrix development and scale purification
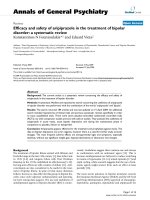
4.4.1. CFA matrix development for MSQ and SSQ scale
In order to develop the measurement scale, the covariance matrices between the four factors identified
for MSQ scale and five factors identified for SSQ scale was created as shown in Fig. 4 and Fig. 5.
Fig. 4. Theoretical framework for development of Fig. 5. Theoretical framework for development of
MSQ Scale
SSQ Scale
300
4.4.2. CFA matrix purification for MSQ and SSQ scale
For purification of MSQ scale, three iterations runs of CFA were performed to obtain satisfactory
goodness of fit indices. During this process, 5 items out of initial 21 items were deleted due to low
explained variance. The five items were:
i.
ii.
iii.
iv.
v.
the manufacturing unit maintains confidentiality in transactions;
the unit possesses the latest information technology infrastructure;
the unit pays attention to suppliers’ views in dealings;
the unit has an equitable sharing of responsibilities with the supplier firm; and
the unit is based at convenient & approachable location.
The final model consisting of four attributes and 16 unique sub-factors is depicted in Fig. 6.
Fig. 6. CFA Model Development for measuring MSQ
Various goodness-of-fit indices are obtained by running the model using AMOS v 21. The Normed
Chi-square value for this model is 0.993, which represents a good fit. The acceptable ratio of Normed
Chi-square value is up to 3 or even 5 (Hooper et al., 2008; Hox & Bechger, 1998). The Goodness-ofFit Index (GFI), the Comparative-Fit-Index (CFI) and the Normed-Fit-Index (NFI) values for this
model were 0.913, 1.000, and 0.937 respectively. The RMSEA value of 0.000 indicates a perfect fit.
From these values it is inferred that model represents an adequate fit.
Likewise for SSQ scale, five iterations runs of CFA were performed to obtain satisfactory goodness of
fit indices. During this process, one dimension viz. Alignment, was completely dropped. In total, 11 out
of an initial 24 items were deleted owing to low variance. The deleted items were:
i.
ii.
iii.
iv.
v.
the supplier has financial strength
the supplier has required knowledge/expertise/skills
the supplier firm has latest infrastructure;
the supplier has willingness to serve your unit
the supplier is fair in dealings with your unit
S. K. Gandhi et al. / Uncertain Supply Chain Management 7 (2019)
301
vi.
vii.
viii.
ix.
x.
xi.
terms & conditions with the unit are reasonable
the supplier uses right tools/equipment/technology
the supplier has modern & certified facilities
the supplier is easily approachable
the supplier has quick solutions to failures/complaints
the supplier maintains confidentiality in operations
The final model consisting of 4 factors and 13 sub-factors is depicted in Fig. 7.
Fig. 7. CFA Model Development for measuring SSQ
The Normed Chi-square value for this model is 1.342, which represents a good fit. The GFI, CFI, and
NFI values for this model were 0.911, 0.977, and 0.918 respectively. The RMSEA value of 0.054
indicates a reasonable fit. From these values it is inferred that model represents an adequate fit.
5.
Conceptual Model and Analysis
The following two models have been conceptualized:
Model-I to examine the impact of Manufacturer service quality on Supplier service quality,
Model-II to examine the impact of Supplier service quality on Satisfaction, and Loyalty.
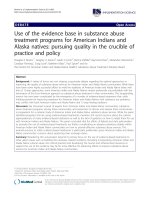
5.1. Model-I
This model is conceptualized to evaluate the impact of MSQ on SSQ. Fig. 8 depicts schematic diagram
of structural relationship between exogenous latent variable MSQ and endogenous latent variable SSQ
using factors of the scales as identified by EFA followed by CFA.
302
Assurance
Credibility
λ
λ
Communication
MSQ
Relationship
SSQ
Alignment
Understanding
Responsiveness
Dependability
Fig. 8. Conceptual Model representing the relationship between MSQ and SSQ
Notations:
λ: Factor loadings in measurement part of MSQ/SSQ
: Residual errors in measurement part of MSQ
: Path Coefficient from MSQ to SSQ
: Residual errors in measurement part of SSQ
: Residual error in SSQ
5.1.1. Analysis of Model-I
Proposition 1: Manufacturer service quality is a source of Supplier service quality. The following
hypothesis is developed for testing this relationship:
S. No.
H1
Null Hypothesis (H0)
Path coefficient is not significantly different
form 0.
Alternative Hypothesis (Ha)
Manufacturer service quality is positively
linked to supplier service quality.
5.1.2. Model Fit
Various goodness-of-fit indices are obtained by running the model using AMOS v21. The Normed Chisquare value for this model is 1.657, which represents a good fit. The GFI, CFI, and NFI values for this
model were 0.945, 0.977, and 0.944 respectively. The RMSR value of 0.027 and RMSEA value of
0.074 also indicates a reasonable fit. Fig. 9 depicts the pictorial representation of various path estimates
of the model-I.
Fig. 9. Path estimates of Model-I
303
S. K. Gandhi et al. / Uncertain Supply Chain Management 7 (2019)
Various path estimates between exogenous and endogenous latent variables of the model-I are depicted
in Table 9. All the regression weights were significant which is in line with the hypothesized
relationships.
Table 9
Regression Weights for Model-I
Path
MSQ to SSQ
MSQ to Assurance
MSQ to Communication
MSQ to Alignment
MSQ to Responsiveness
SSQ to Credibility
SSQ to Relationship
SSQ to Understanding
SSQ to Dependability
Standardized Regression Weight Estimate
0.65
0.78
0.76
0.74
0.75
0.80
0.70
0.82
0.89
The regression weight for the Assurance dimension was highest for manufacturer service quality
(MSQ) towards supplier, whereas the regression weight for Dependability was highest for measuring
supplier service quality (SSQ) in such units. The Standardized Regression Weight for the path linking
exogenous latent variable manufacturer service quality to endogenous latent variable supplier service
quality was 0.65 which was found to be significant at a significance level of 5%. Therefore, the
alternative hypothesis Ha of MSQ positively impacting the SSQ is accepted.
5.2. Model-II
The model-II is conceptualized to understand the relationship between MSQ and SSQ with satisfaction
and loyalty at manufacturing unit-supplier interface. The conceptual structural model for this
relationship is depicted in Fig. 10.
1
2
1
SSQ
Satisfaction
3
2
3
MSQ
Loyalty
Fig. 10. Conceptual Structural Model-II
304
Notations:
: Path Coefficient from MSQ → SSQ
1, 2, 3: Path Coefficients from SSQ →Satisfaction; Satisfaction →Loyalty, SSQ → Loyalty, resp.
: Residual error in measurement of SSQ, Satisfaction, and Loyalty respectively
5.2.1. Analysis of Model-II
Proposition 2: Supplier service quality is a source of Satisfaction.
Proposition 3: Satisfaction is a source of Loyalty.
Proposition 4: Supplier service quality is a source of Loyalty.
The following hypotheses are developed for testing this relationship:
S. No.
H2
H3
H4
Null Hypothesis (H0)
H02: Path coefficient 1 is not significantly
different from 0.
H03: Path coefficient 2 is not significantly
different from 0.
H04: Path coefficient 3 is not significantly
different from 0.
Alternative Hypothesis (Ha)
Ha2: SSQ is positively linked to Satisfaction.
Ha3: Satisfaction from the supplier is positively
linked to Loyalty.
Ha4: SSQ is positively linked to Loyalty.
5.2.2. Model Fit
Various goodness-of-fit indices are obtained by running the model using AMOS v21. The Normed Chisquare value for this model is 1.607, which represents a good fit. The GFI, CFI, and NFI values for this
model were 0.941, 0.946, and 0.978 respectively. The RMSR value of 0.070 and RMSEA value of
0.071 indicate a reasonable fit.
Fig. 11 depicts the pictorial representation of various path estimates of the model-II.
Fig. 11. Path estimates of Model-II
Various path estimates among latent variables of the model-II are depicted in table 10. The positive
signs of the parameters representing the paths between the latent variables are in line with hypothesized
relationships.
305
S. K. Gandhi et al. / Uncertain Supply Chain Management 7 (2019)
Table 10
Results for Structural Relationship in the Model-II
Path
Estimate
SSQ to Satisfaction
0.54
SSQ to Loyalty
0.52
Satisfaction to Loyalty
0.42
t value*
6.178
3.568
3.770
Conclusion
Supported
Supported
Supported
*-1.96 < t < 1.96 indicate that parameter is not significantly different from zero at 5% level of significance.
The Standardized Regression Weight for the path linking SSQ to Satisfaction was 0.54 which was found
to be significant at a significance level of .05. Therefore, the alternative hypothesis Ha2 of Supplier
service quality (i.e., service quality delivered by the supplier) positively impacting the Satisfaction of
manufacturer is accepted.
The Standardized Regression Weight for the path linking Satisfaction to Loyalty was 0.42 which was
found to be significant at a significance level of 5%. Therefore, the alternative hypothesis Ha3 of
Satisfaction perceived by manufacturer from the services delivered by Supplier positively impacting
the Loyalty is accepted.
The Standardized Regression Weight for the path linking SSQ to Loyalty was 0.52 which was found to
be significant at a significance level of 5%. Therefore, the alternative hypothesis Ha4 of SSQ positively
impacting the Loyalty is accepted.
6.
Conclusions
The present study was intended to study a) Service quality offered by the manufacturing unit (MSQ)
towards facilitation of working of its supplier; b) Supplier service quality (SSQ) delivered by supplier;
and c) the relationship of these constructs i.e. MSQ and SSQ with satisfaction and loyalty measures.
The insights provided by this study can help managers and researchers in further understanding the
service quality issues relating to the supply function in SMEs. This paper also comes out with a set of
four hypotheses as enumerated in previous section at supplier-manufacturer interface. Some of the
typical benefits of the proposed scales are as follows:
i.
ii.
iii.
iv.
The proposed structure fills the gaps that exist in the conceptualization of service quality issues
related to purchasing and supply functions in small-medium enterprises of emerging economies
like India. The study brings out useful determinants (four each) to measure both MSQ and SSQ.
The scores on individual sub-dimensions indicate suggestions for improvements to managers
along those areas.
The MSQ and SSQ scales can also be used as diagnostic tools for identifying poor and/or
excellent performance to benchmark across multiple departments within a single manufacturing
unit. Furthermore, any of these situations can also be compared across time.
The study also derived linkages between MSQ and SSQ with satisfaction and loyalty based on
structural equation modeling. Operations improve process and design quality, reduce waste,
fine-tune internal processes and develop synchronized linkages with suppliers and distributors,
and thereby achieve operational efficiencies. By way of cost reduction and increase in product
and service reliability, these operational efficiencies improve the attractiveness of the products
and services. In the market, improved service quality enhances satisfaction and loyalty of
suppliers, and lures them away from competitors who are perceived low in service quality.
Thus, to achieve loyalty, it is vital for supply chain stakeholders to coordinate, synchronize and
integrate their activities to produce desired outputs by incorporating service quality initiatives.
306
However, these findings can be extended to add distributor, retailer and end user’s perspective.
Traditionally, service quality driven operations have been overlooked in such units with an
understanding that transaction specific opportunistic approach may work best for SMEs.
Mohanty et al. (2014) argue that in the supply of raw materials, the quality of service is a major factor
in competition. This may be more relevant in the SME clusters where manufacturers produce
intrinsically similar products. This study demonstrates that high service quality is increasingly
important as a tool which is used by the supplier towards their manufacturers. The service quality
provided by the supplier and manufacturer to each other helps in establishing close relationships. Close
relationships are important in creating mutual commitment and understanding. Various empirical
studies on the supply function demonstrate that satisfaction is derived from relationships between the
supplier and the manufacturer. The findings of this study are in line those of other scholars who report
that satisfaction results from satisfaction with products and services (Prakash et al., 2014) and
satisfaction with various facets of the manufacturing organization (i.e., manufacturers) such as financial
or social aspects (Sanzo et al., 2003).
In order to compete globally, these units need to benchmark themselves against quality standards and
practices of small manufacturers in countries such as USA, the European Union, and Japan.
Nevertheless, in their quest for excellence, these units should evolve at a fast pace, and shift from rigid
traditional structure to more responsive and customer-centric business models, replacing vertical
business process with horizontal business processes so as to increase organizational and process
flexibility, and sharing information with their stake-holders and coordinate processes leading to
effective and timely decision making and responsiveness to customer needs.
In a nutshell, the honest sharing of operational information, integrating supply chain strategy,
promptness in handling queries or failures, meeting deadlines, maintaining secrecy in dealings,
flexibility in terms and conditions as per requirements, and preference for long-term collaborative
relationship are few attributes that need to be incorporated at various supplier-manufacturer dyad of the
supply chain.
At this point it is essential to offer a caveat that some scholars have suggested that SME managers,
instead of building relationships with suppliers, still adhere to practices such as competition between
suppliers to drive down prices, and weeding out suppliers who do not provide competitive prices (Amad
et al., 2008). Grant (2005) has suggested that in the case of logistics based services, there is often a
dichotomy in what manufacturers say that they consider as desirable (relationship with supplier), and
what they actually practice (transaction-specific behavior). However, this dichotomy has so far not
been resolved in this study.
7. Limitations of the Study
In this research, an attempt was made to study and evaluate supplier service quality in supply chain.
Supplier Service quality is a main concern in supply chain and provides a useful framework to explore
consequences of service quality for the upstream chain and reports a strong significance. Limitations
of this study are as follows:
1. Though large number of factor has been considered for evaluation, some external factors like
legal, political etc. not considered.
2. Factors for this study have been identified from the available literature which published in
various reputed journals. There are chances that more research articles can be cited which are
not included in the present research.
3. This study is based on the collection of data with the opinion of experts, hence there is a chance
of biasing.
S. K. Gandhi et al. / Uncertain Supply Chain Management 7 (2019)
307
4. The data collection is for manufacturing supply chain only.
5. This study used survey method which was restricted to North India, while application of this
methodology in other regions may change the predict result of this study.
8. Scope for Future Research
There are always chances of improvements in every work or research. Following are the expected scope
for future work:
The data collection approach used in the present study was snow ball sampling method,
other sampling methods may be adopted for the same purpose.
As EFA, CFA, and SEM were used to evaluate the service quality in present study, some
other MADM technique may be used for the same purpose.
This study was restricted to northern region of India, other regions of India may be
considered for the same study.
Some more number of factors may be identified for each drives of supply chain.
The study considered supplier supply chain in this study in a manufacturing chain, others
supply chains may be considered.
References
Amad, L. C., Hamid, A. B. A., Salleh, N. M., & Choy, C. S. (2008). Adapting buyer-supplier
relationship practices in the local industry. Asian Academy of Management Journal, 13(2).
Arasli, H., Mehtap-Smadi, S., & Turan Katircioglu, S. (2005). Customer service quality in the Greek
Cypriot banking industry. Managing Service Quality: An International Journal, 15(1), 41-56.
Autry, C. W., & Golicic, S. L. (2010). Evaluating buyer–supplier relationship–performance spirals: A
longitudinal study. Journal of Operations Management, 28(2), 87-100.
Bagozzi, R. P., & Yi, Y. (1988). On the evaluation of structural equation models. Journal of the
academy of marketing science, 16(1), 74-94.
Benton, W. C., & Maloni, M. (2005). The influence of power driven buyer/seller relationships on
supply chain satisfaction. Journal of Operations Management, 23(1), 1-22.
Carr, A. S., & Pearson, J. N. (1999). Strategically managed buyer–supplier relationships and
performance outcomes. Journal of operations management, 17(5), 497-519.
Carr, A. S., Kaynak, H., Hartley, J. L., & Ross, A. (2008). Supplier dependence: impact on supplier's
participation and performance. International Journal of Operations & Production
Management, 28(9), 899-916.
Carr, C. L. (2007). The FAIRSERV model: Consumer reactions to services based on a
multidimensional evaluation of service fairness. Decision Sciences, 38(1), 107-130.
Chen, Y. J. (2011). Structured methodology for supplier selection and evaluation in a supply
chain. Information Sciences, 181(9), 1651-1670.
Cooper, M. C., & Ellram, L. M. (1993). Characteristics of supply chain management and the
implications for purchasing and logistics strategy. The International Journal of Logistics
Management, 4(2), 13-24.
Corsten, D., & Felde, J. (2005). Exploring the performance effects of key-supplier collaboration: an
empirical investigation into Swiss buyer-supplier relationships. International Journal of Physical
Distribution & Logistics Management, 35(6), 445-461.
Cronin Jr, J. J., & Taylor, S. A. (1992). Measuring service quality: a reexamination and extension. The
journal of marketing, 55-68.
DeWitt, T., Giunipero, L. C., & Melton, H. L. (2006). Clusters and supply chain management: the
Amish experience. International Journal of Physical Distribution & Logistics Management, 36(4),
289-308.
308
Ehigie, O. B. (2006). Correlates of customer loyalty to their bank: a case study in Nigeria. International
Journal of Bank Marketing, 24(7), 494-508.
Flynn, B. B., Sakakibara, S., Schroeder, R. G., Bates, K. A., & Flynn, E. J. (1990). Empirical research
methods in operations management. Journal of operations management, 9(2), 250-284.
Ganesan, P. (2007). Service Quality, Customer Satisfaction and Loyalty: Indian Public Sector Bank’s
Branch Level Study. Panda TK and Donthu N Marketing in the New Global Order: Challenges and
Opportunities.
Gonzalez, M. E., Quesada, G., & Mora Monge, C. A. (2004). Determining the importance of the
supplier selection process in manufacturing: a case study. International Journal of Physical
Distribution & Logistics Management, 34(6), 492-504.
Govindan, K., Kannan, D., & Noorul Haq, A. (2010). Analyzing supplier development criteria for an
automobile industry. Industrial Management & Data Systems, 110(1), 43-62.
Grant, D. B. (2005). The transaction-relationship dichotomy in logistics and supply chain management.
In Supply Chain Forum: An International Journal, 6(2), 38-48.
Gupta, M., Choudhary, A. K., & Alam, M. S. (2014). Effect of trust, satisfaction and other relationship
dimensions on supplier relationship management. Review of Integrative Business and Economics
Research, 3(2), 17.
Gupta, T. K., & Singh, V. (2015). A systematic approach to evaluate supply chain management
environment index using graph theoretic approach. International Journal of Logistics Systems and
Management, 21(1), 1-45.
Gupta, T. K., & Singh, V. (2017). Measurement of service quality of automobile organisation by
artificial neural network. International Journal of Management Concepts and Philosophy, 10(1),
32-53.
Hair Jr, J. F., Black, W. C., Babin, B. J., Anderson, R. E., & Tatham, R. L. (2010). SEM: An
introduction. Multivariate data analysis: A global perspective, 629-686.
Hansen, M. T., & Nohria, N. (2004). How to build collaborative advantage. MIT Sloan Management
Review, 46(1), 22.
Holl, A. (2008). Production subcontracting and location. Regional Science and Urban
Economics, 38(3), 299-309.
Hooper, D., Coughlan, J., & Mullen, M. (2008). Structural equation modelling: Guidelines for
determining model fit. Articles, 2.
Hox, J. J., & Bechger, T. M. (1998). An introduction to structural equation modeling.
Izogo, E. E., & Ogba, I. E. (2015). Service quality, customer satisfaction and loyalty in automobile
repair services sector. International Journal of Quality & Reliability Management, 32(3), 250-269.
Jagdev, H. S., & Thoben, K. D. (2001). Anatomy of enterprise collaborations. Production planning &
control, 12(5), 437-451.
Johnsen, T. E. (2009). Supplier involvement in new product development and innovation: Taking stock
and looking to the future. Journal of Purchasing and Supply Management, 15(3), 187-197.
Johnston, D. A., & Murat Kristal, M. (2008). The climate for co-operation: buyer-supplier beliefs and
behavior. International Journal of Operations & Production Management, 28(9), 875-898.
Jun, M., & Cai, S. (2010). Examining the relationships between internal service quality and its
dimensions, and internal customer satisfaction. Total Quality Management, 21(2), 205-223.
Kang, H., & Bradley, G. (2002). Measuring the performance of IT services: An assessment of
SERVQUAL. International Journal of Accounting Information Systems, 3(3), 151-164.
Kannan, V. R., & Choon Tan, K. (2003). Attitudes of US and European managers to supplier selection
and assessment and implications for business performance. Benchmarking: An international
journal, 10(5), 472-489.
Kaynak, H. (2003). The relationship between total quality management practices and their effects on
firm performance. Journal of operations management, 21(4), 405-435.
Lee, H., Lee, Y., & Yoo, D. (2000). The determinants of perceived service quality and its relationship
with satisfaction. Journal of services marketing, 14(3), 217-231.
S. K. Gandhi et al. / Uncertain Supply Chain Management 7 (2019)
309
Lemma, H. R., Singh, R., & Kaur, N. (2015). Determinants of supply chain coordination of milk and
dairy industries in Ethiopia: a case of Addis Ababa and its surroundings. Springer Plus, 4(1), 498.
Lusch, R. F., Vargo, S. L., & O’brien, M. (2007). Competing through service: Insights from servicedominant logic. Journal of retailing, 83(1), 5-18.
Mohanty, M. K., Gahan, P., & Choudhury, S. (2014). Why most of the supplier development programs
fail in discrete manufacturing–findings from selected Indian discrete manufacturing
industries. International Journal of Management Science and Engineering Management, 9(3), 201211.
Nargundkar, R. (2003). Marketing research-Text & cases 2E. Tata McGraw-Hill Education.
Nix, N. (2001). Customer service in supply chain management context. Supply Chain Management,
CA: Sage Publications, Beverly Hills.
Nunnally, J. C., & Bernstein, I. H. (1978). Psychometric theory.
Pagell, M., Wu, Z., & Wasserman, M. E. (2010). Thinking differently about purchasing portfolios: an
assessment of sustainable sourcing. Journal of Supply Chain Management, 46(1), 57-73.
Parasuraman, A., Zeithaml, V. A., & Berry, L. L. (1985). A conceptual model of service quality and its
implications for future research. The Journal of Marketing, 41-50.
Parasuraman, A., Zeithaml, V. A., & Berry, L. L. (1988). SERVQUAL: A multiple-item scale for
measuring consumer perception of service quality, Journal of retailing, 64(1), 12.
Pitt, L. F., Watson, R. T., & Kavan, C. B. (1995). Service quality: a measure of information systems
effectiveness. MIS quarterly, 173-187.
Prakash, G. (2011). Service quality in supply chain: empirical evidence from Indian automotive
industry. Supply Chain Management: An International Journal, 16(5), 362-378.
Prakash, G. (2014). QoS in the internal supply chain: the next lever of competitive advantage and
organisational performance. Production Planning & Control, 25(7), 572-591.
Rogers, K. W., Purdy, L., Safayeni, F., & Duimering, P. R. (2007). A supplier development program:
rational process or institutional image construction?. Journal of Operations Management, 25(2),
556-572.
Saleh, R. A., & Sweis, R. J. (2017). The relationships between soft/hard total quality management
practices and operational performance in Jordanian manufacturing organisations. International
Journal of Management Concepts and Philosophy, 10(4), 345-377.
Santouridis, I., Trivellas, P., & Tsimonis, G. (2012). Using ES-QUAL to measure internet service
quality of e-commerce web sites in Greece. International Journal of Quality and Service
Sciences, 4(1), 86-98.
Sanzo, M. J., Santos, M. L., Vázquez, R., & Álvarez, L. I. (2003). The effect of market orientation on
buyer–seller relationship satisfaction. Industrial Marketing Management, 32(4), 327-345.
Saranga, H. (2009). The Indian auto component industry–Estimation of operational efficiency and its
determinants using DEA. European Journal of Operational Research, 196(2), 707-718.
Seth, N., Deshmukh, S. G., & Vrat, P. (2006). SSQSC: a tool to measure supplier service quality in
supply chain. Production planning & control, 17(5), 448-463.
Stanley, L. L., & Wisner, J. D. (2002). The determinants of service quality: issues for
purchasing. European Journal of purchasing & Supply management, 8(2), 97-109.
Stanworth, J. O. (2012). Deep supply relationships: influencing outcomes by managing supply service
quality. Production Planning & Control, 23(7), 541-552.
Tabachnick, B. G., & Fidell, L. S. (2007). Using multivariate statistics. Allyn & Bacon/Pearson
Education.
Tracey, M., & Leng Tan, C. (2001). Empirical analysis of supplier selection and involvement, customer
satisfaction, and firm performance. Supply Chain Management: An International Journal, 6(4), 174188.
Wouters, M., van Jarwaarde, E., & Groen, B. (2007). Supplier development and cost management in
Southeast Asia—Results from a field study. Journal of Purchasing and Supply Management, 13(4),
228-244.
310
Wu, Z., Choi, T. Y., & Rungtusanatham, M. J. (2010). Supplier–supplier relationships in buyer–
supplier–supplier triads: Implications for supplier performance. Journal of Operations
Management, 28(2), 115-123.
Yavas, U., Benkenstein, M., & Stuhldreier, U. (2004). Relationships between service quality and
behavioral outcomes: A study of private bank customers in Germany. International Journal of Bank
Marketing, 22(2), 144-157.
© 2018 by the authors; licensee Growing Science, Canada. This is an open access
article distributed under the terms and conditions of the Creative Commons Attribution
(CC-BY) license ( />