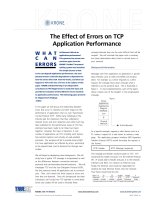
Critical evaluation of policies in supply chain performance: Quality assurance, continuous process improvement and environmental regulation and policies
Bạn đang xem bản rút gọn của tài liệu. Xem và tải ngay bản đầy đủ của tài liệu tại đây (523.67 KB, 12 trang )
Uncertain Supply Chain Management 7 (2019) 793–804
Contents lists available at GrowingScience
Uncertain Supply Chain Management
homepage: www.GrowingScience.com/uscm
Critical evaluation of policies in supply chain performance: Quality assurance, continuous
process improvement and environmental regulation and policies
Andriansyah Andriansyaha*, Taufiqurokhman Taufiqurokhmana and Ismail Suardi Wekkeb
a
Universitas Prof. Dr. Moestopo (Beragama), Indonesia
Sekolah Tinggi Agama Islam Negeri (STAIN) Sorong, Indonesia
b
CHRONICLE
Article history:
Received November 4, 2018
Received in revised format
December 20, 2018
Accepted January 2 2018
Available online
January 2 2019
Keywords:
Supply chain performance
Quality assurance policies
Continuous process
improvement
Environmental regulations
and policy
ABSTRACT
The primary objective of this study is to find the role of different policies on supply chain
performance (SCP). To achieve this objective, quality assurance policies (QAP) and
continuous process improvement (CPI) are selected as independent variables. Additionally, the
moderating effects of environmental regulations and policy (ERP) are examined between
various policies and SCP. ERP is taken as moderating variable because the role of ERP in
logistics is crucial. Logistics transport has serious effect on environment due to the emission
of CO2. Primary data are collected from supply chain companies of Indonesia. Three hundred
questionnaires are used in this study and they are analyzed through statistical tests. Conclusion
of the study shows that QAP and CPI had major role in SCP. Better implementation of QAP
and CPI increase the SCP among Indonesian supply chain companies. Moreover, ERP is a
moderating variable between the relationship of QAP and CPI and SCP. Therefore, Indonesian
supply chain companies should enhance the policies related to quality assurance, process
improvement and environmental policies to enhance SCP.
© 2019 by the authors; licensee Growing Science, Canada.
1. Introduction
Supply Chain is a system between an organization and various suppliers to distribute a product to the
ultimate customers (Christopher, 2016; Rushton et al., 2014). It consists of people, activities, resources
and information involved in moving a product as well as service from supplier to the specific customer
(Hugos, 2018). Logistics is one of the essential and major part of supply chain (Rushton et al., 2014).
Logistics consists of heavy transportation to carry goods from one place to another, most importantly,
to reach goods to the customers who ordered the goods (Suryanto et al., 2018).
Performance of supply chain companies is important for every country. As the supply chain is one of
the major economic instruments. Most of the countries are working hardly to enhance supply chain
performance (SCP). Indonesia is one of the emerging countries trying to enhance SCP. However, the
Indonesian supply chain industry is facing various issues related to the quality assurance. As the quality
assurance is an important element of supply chain (Sroufe & Curkovic, 2008), that is the reason it has
significant impact on performance. According to Fearne et al. (2001), it is one of the key segment of
* Corresponding author
E-mail address: (A. Andriansyah)
© 2019 by the authors; licensee Growing Science.
doi: 10.5267/j.uscm.2019.1.001
794
supply chain which has influence on performance. Good SCP requires a reasonable level of quality
assurance policy (QAP) (Aung & Chang, 2014; Kigpiboon, 2013; Henry, 2014; Bank & Bank, 2014;
Adebambo et al., 2014; Zomorrodi & Zhou, 2017).
Therefore, Indonesian supply chain industry must incorporate good quality assurance practices in
supply chain. Secondly, Indonesia supply chain companies are facing issues in continuous process
improvement (CPI). CPI is important to maintain the quality among supply chain firms. CPI is not only
important in supply chain but also it is important for all companies. A study conducted by Diekola
(2016) in Malaysian food and beverages industry found that both the QAP and CPI had significant
positive impacts on performance. Thus, Indonesian supply chain industry must adopt QAP and CPI to
boost performance and to resolve various issues. Additionally, as mentioned above, logistics is the big
part of supply chain process which consists of transportation. Heavy transportation has negative effect
on environment through CO2 emission (Gideon, 2014; Zheng et al., 2017; Luong et al. 2017; Zhang,
2017; Al-Fatlawi, 2018; Baran & Yilmaz, 2018). This negative impact can be resolved with the help
of environmental regulations and policy (ERP). ERP has significant influence to enhance the
performance of supply chain.
Hence, the objective of this study is to examine the effect of critical evaluation of policies in SCP
among Indonesian supply chain companies. Moreover, the other objectives of the study are as follows;
1. To investigate the effect of QAP on SCP.
2. To investigate the effect of CPI on SCP.
3. To investigate the moderating effect of ERP.
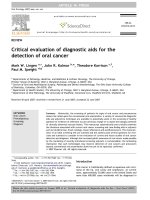
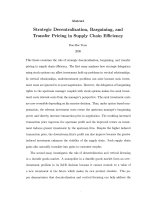
Quality Assurance Policy
(QAP)
Strategic Planning
Process focus
Delivery
Environmental
Regulation and
Policy (ERP)
Supply Chain
Performance (SCP)
Continuous Process
Improvement (CPI)
Fig. 1. Framework showing that how QAP, CPI and ERP effect on SCP
Source: Developed by the author
2. Literature Review
2.1 Quality Assurance Policy (QAP)
Quality assurance is the element of Total Quality Management (TQM). Policies against quality
assurance is most important to sustain performance among supply chain companies. Quality assurance
includes the idea of orderly administration and evaluation systems used to guarantee accomplishment
of quality yields or progressed quality. Quality assurance, in light of extensive survey has three phases,
795
A. Andriansyah et al. /Uncertain Supply Chain Management 7 (2019)
including; design of planning, process focus and delivery (Abdous, 2009). Quality assurance policies
has the tendency to enhance performance of supply chain by satisfying the customers and enhance
profitability.
Alkafaji (2007) analysed quality assurance survey projects of auditing firms from international point
of view. The reason for the examination is to thoroughly analyse quality assurance survey programs in
various parts of the world with the end goal to recognize likenesses and qualifications in these projects.
An overview for data was sent to the accounting administrative bodies who are individuals from the
international federations of accountants (IFAC). The outcome demonstrated that nations with
noteworthy stock markets have a tendency to require quality assurance projects of their firms while
nations of less massive stock markets tend not to require such projects. These quality assurance
practices have significant role on supply of goods. As there is a strong relationship between quality
assurance and supply chain quality performance (Fynes et al., 2004; Fynes et al., 2005; Ekpung, 2014;
Chidoko, 2014; Zomorrodi & Zhou, 2016; Danbaba et al., 2016; Marshal, 2017; Marshal, 2017; Mušić,
2017; Chen et al., 2018; Al-Fatlawi, 2018).
Töremen et al. (2009) demonstrated that in quality, the duty regarding quality is positioned in both the
people and group through some formative procedures which speaks to a way to deal with quality
assurance to be more understanding with the structures and basic morals of instructive associations than
more robotic and progressive procedures. Systems for quality assurance on enterprises have developed
interminably as per the innovative changes that have denoted the fast development of society (Cătălin
et al., 2014). Tran et al. (2011) clarified that ISO was produced from Quality Assurance; Quality
Assurance empowered the event of quality administration amid the new-item advancement process and
concentrated on nonstop enhancement as a key quality administration. The framework of Miles et al.
(1978) in Fig. 2 can be utilized to distinguish between companies that are involved in ISO registration
only because customers need it and to support certain characteristics of quality assurance.
High
ISO 9000:2000
Integration
Defenders
Prospectors
Reactors
Analysers
Low
High
Fig. 2. ISO integration and supply chain quality assurance
Source: Miles et al. (1978)
Cheong Cheng (2003) described quality assurance in respect to interface, internal and future education.
The investigation opined that quality assurance is isolated into three extraordinary ideal models in
training. First, inside quality assurance that enhances the inside condition and process to such an extent
that the feasibility of learning and educating can be guaranteed to accomplish the arranged objectives.
Second, interface quality assurance guarantees that training administrations fulfil the requirements of
partners and are assessable to general society openness. Third, future quality assurance which
highlights on guaranteeing the importance of aim, practices and results of training to the education to
the future of new generations worldwide, data innovation and the information driven economy. In
understanding quality assurance, Choon Boey Lim (2008) led a cross-country contextual investigation
by looking into on understanding quality assurance. The motivation behind the investigation is to work
on the elements of quality assurance approach usage inside and crosswise over foundations. Interviews
were directed, and information were received in Malaysia. The investigation uncovered that quality
assurance might not be healthy in cases if the organization is suffering with internal problems. herefore,
it requires plaining, produces and delivery to enhance quality assurance in supply chain companies.
796
H1: QAP has positive effect on SCP.
2.2 Continuous Process Improvement (CPI)
One of the regularly debated TQM components in literatures is continuous improvement or continuous
process improvement (Intra & Zahn, 2014; Jørgensen et al., 2003). Continuous improvement has turned
out to be an intense device in companies (Krittanathip et al., 2013). Furthermore, from the components
of TQM, all issues are exceptionally organized because of continuous improvement, with the end goal
to upgrade the better performance of company (Suárez-Barraza et al., 2009).
As indicated by Adina-Petruţa and Roxana (2014), intensity, advancement and performance are the
objectives of the present business conditions under the given ideas, for example, quality and continuous
improvement are vital stimuli in accomplishing this objective. Their investigation centres around
coordinating six-sigma with quality administration for the advancement and continuous improvement
of higher training foundations. The discovering demonstrates that continuous improvement is
accomplished by estimating the quality of processes and results of research and useful items. Moreover,
it is contended that continuous improvement to be effectively established through cooperation
(Atkinson, 1994). According to various studies, continuous improvement has important influence on
supply chain (Hyland et al., 2003). However, the political influence of stock return and economic
factors can make the difference (Basheer et al., 2019; Maqbool et al., 2018). Christofi et al. (2008)
expressed that, continuous process improvement is viewed as one of the TQM standards. Ellis and
Castle (2010) conceptualized a parallel connection between continuous process improvement and
instructor research by laying out the basic attributes and processes. Jung and Wang (2006) examined
the association between TQM and continuous improvement. Data was obtained by a cross sectional
method from 100 middle levels to senior level managerial employees to examine the hypotheses. The
research study recommends that the mutual association between soft TQM fundamentals and
continuous improvement is much significant as compared with the relationship among hard TQM
fundamentals. A study conducted by Chapman and Corso (2005) found that continuous improvement
and collaborative innovation had significant positive connection with each other which had influence
in supply chain. Collaboration increases the innovation, as mentioned by Hameed et al. (2018), which
increases the performance of supply chain. Therefore, continuous process improvement increases the
supply chain performance.
H2: CPI has positive effect on SCP.
2.5 Environmental Regulation and Policy (ERP)
Environmental quality is measured through the degree in which ERP is being appropriately followed.
It is a feature of the supervisory socio-natural connection, the functional significance of which depends
on the capability to reflect the maximum procedures of environmental safety techniques (Chervinski,
2014). ERP has strong connection with supply chain, as increases in logistics increases the Carbon
emission. The demand for convincing environmental regulation on item end-of-life and generation
processes is upgraded by customer concerns in respect to the environmental factors (Santos-Reyes &
Lawlor-Wright, 2001). Esty et al. (2005) communicated about the environmental issues dependent on
environmental sustainability index of environmental related concerns. The investigation demonstrated
that no environmental protection and laws issues had been discussed widely as far as the environmental
contamination issues are concerned. The study demonstrated that the environmental data, straight
forwardness and responsibility, sufficient limit with regards to trustworthy requirement and different
strategies would advance the better environmental performance. As the supply chain is majorly related
to the transport and transport is related to the environmental issues (Hensher & Button, 2003; Hesse &
Rodrigue, 2004), therefore, environmental issues may influence on supply chain. Leshinsky (2012)
expressed that the utilization planning to help maintainability and environmental protection through a
logical structure that would draw cooperative planning theory and practice for arranging and
understandings together can be utilized as an instrument to protect environmental qualities and
A. Andriansyah et al. /Uncertain Supply Chain Management 7 (2019)
797
standards. The findings uncovered that environmental policies may have set up great system and
practice to save the earth. The understandings of the policies as an environmental instrument can reduce
the negative impact on environment. Reduces in negative effect on environment has positive role in
supply chain performance. Madu et al. (1995) explained that numerous companies have not considered
the capability of normal environmental quality planning which causes to effect on organization's item
quality, growth and competitive advantage. Apart from other companies, it is more important for supply
chain companies. As the emission of CO2 from logistics transport decreases the environmental safety
(Kim et al., 2009).
H3: ERP has positive effect on SCP.
H4: ERP moderates the relationship between QAP and SCP.
H5: ERP moderates the relationship between CPI and SCP.
3. Research Methodology
3.1 Data Collection Procedure
Data is the set of information needed to test the hypotheses. In this study, the employees of supply
chain companies were preferred to take the data. Firstly, the email addresses of employees were
gathered from the head offices of companies. After that emails were sent to them by attaching the
survey questionnaire. Objective of the study and instructions to fill the questionnaire were also
described in the email. Data were collected from Indonesia. Supply chain companies were selected to
collect the data. Supply chain company’s employees were selected as respondents. Therefore,
questionnaires were distributed among the employees of Indonesian supply chain companies by using
simple random sampling. Data collection was carried out during the period May, 2018-June, 2018. In
the month of May, the questionnaires were distributed with the help of email. After 15 days on 15 May,
first remainder was sent to those respondents who did not respond. Second remainder were sent on 01
June. Finally, the third remainder was sent on 15 June. The response rate is give in below Table 1.
Table 1
Response from respondents
Response
Total questionnaires distributed
Total questionnaires returned
Total Useable questionnaires
Total questionnaires excluded
Total response rate
Total useable response rate
Frequency/Rate
300
210
203
07
70%
67.6%
3.2 Sample Size
Different studies provide various methods to determine the sample size. Most of the studies suggested
that sample size should be based on the total population. In this case, total population of Indonesian
supply chain companies is required. It was found that the total population is not known. Therefore, in
that case the instructions of various studies to take 300 sample size was preferred. Thus, the study used
300 sample size to collect the data.
3.3 Sampling Technique
Due to the limitation of cost and time, the current study followed simple random sampling technique
to collect the data from the employee of supply chain companies in Indonesia. First of all, the lists of
employees were obtained from different companies, after that the respondents were selected from this
list randomly.
798
3.4 Questionnaire Development
A survey instrument including the profile of respondents and scale items were developed with the help
of previous studies. Specificity, a 5-point Likert scale was developed. Questionnaire is suitable in this
study because a questionnaire is a method of gathering information from participants about the
behaviour, knowledge, values and feelings (Polit Denise & Hungler Bernadette, 1999). It comprises
the research items related to main variables including; QAP, CPI, ERP and SCP. Questionnaire was
divided in to two main sections. First section was based on the respondent’s profile such as gender,
age, education and marital status shown in Table 2. Second section was based on the main research
items.
Table 2
Respondents Profile
Variables
Gender
Age
Category
Male
Female
Below 20 years
21-30 years
31-40 years
41-50 years
Above 50 years
Percentage
67
33
03
15
41
25
16
Variables
Marital status
Education
Category
Single
Married
Matriculation
Intermediate
Bachelor
Master
Ph.D.
Percentage
40
60
07
15
42
29
07
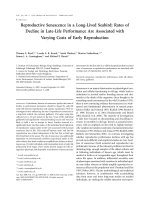
4. Research Analysis and Results
Structural equation modeling is the most acceptable technique to test the hypothesis. It is recommended
by different studies Henseler, Ringle, and Sinkovics (2009) and F. Hair Jr, Sarstedt, Hopkins, and G.
Kuppelwieser (2014). In PLS-SEM, part one is based on an outer model assessment in which reliability
as well as validity were scrutinized. The second major part is based on an inner model assessment in
which hypotheses were tested. In the first part, convergent validity and discriminant validity was
examined. Average variance extracted (AVE) was used to examine convergent validity. Value of factor
loading for each item should be above 0.4, composite reliability above 0.7 and AVE not less than 0.5.
According to Fig. 3, factor loading is more than 0.5, AVE is more than 0.5 and composite reliability is
also more than 0.7. Additionally, discriminant validity is shown in Table 5 and Table 6 through AVE
square root and HTMT criterion, respectively. All the values satisfying the minimum requirements.
Fig. 3. Measurement Model
799
A. Andriansyah et al. /Uncertain Supply Chain Management 7 (2019)
Table 3
Factor Loadings
CPI
0.904
0.861
0.938
0.896
0.926
0.856
CPI1
CPI2
CPI3
CPI4
CPI5
CPI6
ERP1
ERP2
ERP3
ERP4
ERP6
QAP1
QAP2
QAP3
QAP4
QAP5
QAP6
SCP1
SCP2
SCP3
SCP4
SCP5
SCP6
ERP
QAP
SCP
0.815
0.909
0.896
0.858
0.794
0.887
0.904
0.894
0.872
0.913
0.878
0.895
0.879
0.874
0.818
0.884
0.857
Table 4
Measurement Model
CPI
ERP
QAP
SCP
rho_A
0.955
0.918
0.950
0.936
Cronbach's Alpha
0.952
0.909
0.948
0.935
Composite Reliability
0.961
0.932
0.959
0.948
Average Variance Extracted (AVE)
0.806
0.732
0.795
0.754
Table 5
Fornell and Larcker criterion
CPI
ERP
QAP
SCP
CPI
0.898
0.805
0.897
0.700
ERP
QAP
SCP
0.856
0.802
0.727
0.891
0.705
0.868
CPI
ERP
QAP
SCP
0.781
0.745
0.638
0.775
0.679
0.747
Table 6
HTMT criterion
CPI
ERP
QAP
SCP
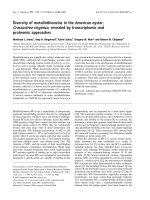
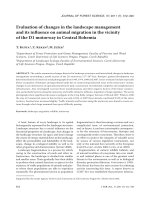
The SEM has been used to analyse the hypotheses developed in literature review. Both moderatinion
and direct hypotheses were tsted with the help of PLS bootstraping. In this process, the p-value was
considered. While analysing the data, 1.96 minimum level of t-value was considered to test the
hypotheses. According to the direct results, it is shown that all hypotheses had t-value above 1.96.
800
Therefore, we accept H1, H2 and H3. All the results of direct effect are shown in Table 7. Moreover, the
PLS bootstrapping process is given Fig. 4 where the t-value is shown for each relationship.
Furthermore, the moderating effect of ERP is shown in Table 8 in which it is clear that the t-value is
above than minimum threshold level for both moderation effect which supports the results of
moderation. Therefore, it supported H4 and H5. Additionally, R-Square is shown in Table 9 which is
0.701. (See Fig. 3).
Fig. 4. Structural Model
Table 7
Hypotheses results without Moderating effect
CPI → SCP
ERP → SCP
QAP → SCP
Original
Sample
(O)
0.218
1.14
0.128
Sample
Mean
(M)
0.205
1.127
0.122
Standard
Deviation
(STDEV)
0.085
0.175
0.045
T Statistics
(|O/STDEV|)
2.565
6.526
2.841
P Values
0.023
0.000
0.015
Decision
Accepted
Accepted
Accepted
Table 8
Hypotheses results (Moderating effect)
CPI×ERP → SCP
QAP× ERP → SCP
Original
Sample
(O)
Sample
Mean
(M)
Standard
Deviation
(STDEV)
T Statistics
(|O/STDEV|)
P Values
Decision
0.111
0.180
0.108
0.174
0.053
0.041
2.051
4.382
0.041
0.000
Moderation
Moderation
Table 9
R-square value
Endogenous Latest Variable
Supply Chain Performance (SCP)
Variance explained
0.701
5. Findings
The objective of this study is to find the role of different policies on SCP. To achieve this objective,
three key policies were selected, namely; quality assurance, process improvement, environmental
regulation and polices. In this study, ERP is taken as moderating variable. To attain the objective, five
hypotheses were formulated concerning the relationship of independent variables (QAP, CPI),
moderating variable (ERP) and dependent variable (DV). Summary of hypotheses is given below;
801
A. Andriansyah et al. /Uncertain Supply Chain Management 7 (2019)
H1: QAP has positive effect on SCP.
H2: CPI has positive effect on SCP.
H3: ERP has positive effect on SCP.
H4: ERP moderates the relationship between QAP and SCP.
H5: ERP moderates the relationship between CPI and SCP.
The results of the study show that QAP had positive effect on SCP with t-value 2.841 and beta value
0.128. It shows a significant positive effect of QAP on SCP. These results supported hypothesis one.
The results also accepted hypothesis two, as the effect of CPI found positive on SCP with beta value
0.218. It also found significant with t-value 2.565. Therefore, an increase in QAP and CPI also increases
the SCP. Indonesian supply chain companies must insure good QAP and CPI to boost performance.
Moreover, it is found the ERP had positive effect on SCP with t-value 6.526 and positive beta value.
Thus, an increase in ERP also increases the SCP supporting the hypothesis three. The hypothesis four
and hypothesis five were accepted as the moderation effect was found significant. ERP moderates the
relationship between QAP and SCP, CPI and SCP. The moderation effect is shown in Fig. 5 and Fig. 6
which shows that moderation effect of ERP strengthens the effect of QAP and CPI on SCP.
Low ERP
SCP
5
High ERP
4
M O D E RATO R
3
2
1
L OW Q A P
H I GH QA P
Fig. 5. Moderation effect of ERP between QAP and SCP
Low ERP
5
High ERP
SCP
4
MODERATO R
3
2
1
LO W CP I
H IG H CPI
Fig. 6. Moderation effect of ERP between CPI and SCP
5. Conclusion
This study has investigated how critical evaluation of policies in supply chain affect the performance
of supply chain companies in Indonesia. Employees of these companies were selected as the
respondents. It has revealed that policies related to quality assurance had major important for
802
performance among supply chain companies. QAP such as strategic plaining, focus on process and
delivery had significant role on performance of supply chain. Better QAP policies increase the
performance. Moreover, continuous improvement in process had also the tendency to influence SCP.
CPI policies increase the operations and delivery of goods and services which increase the SCP.
Moreover, different regulations related to environment had the effect on the relationship of QAP and
SCP. It also has influenced on the relationship of CPI and SCP. ERP increased the positive effect of
QAP and CPI on SCP. Therefore, Indonesian supply chain companies should enhance the policies
related to quality assurance, process improvement and environmental policies to enhance SCP.
References
Abdous, M. H. (2009). E-Learning quality assurance: a process-oriented lifecycle model. Quality assurance
in Education, 17(3), 281-295.
Adebambo, H. O., Ashari, H., & Nordin, N. (2014). Antecedents and outcome of Sustainable environmental
manufacturing practices. International Journal of Management and Sustainability, 3(3), 147-159.
Adina-Petruţa, P., & Roxana, S. (2014). Integrating six sigma with quality management systems for the
development and continuous improvement of higher education institutions. Procedia-Social and
Behavioral Sciences, 143, 643-648.
Al-Fatlawi, S. H. (2018). Nationalists and Environmentalists which are Anti-Globalization and the WTO.
International Journal of Asian Social Science, 8(5), 256-264.
Alkafaji, Y. A. (2007). Quality assurance review programs of auditing firms: an international perspective.
Managerial Auditing Journal, 22(7), 644-660.
Atkinson, C. (1994). Continuous improvement: The ingredients of change. International Journal of
Contemporary Hospitality Management, 6(1/2), 06-08.
Aung, M. M., & Chang, Y. S. (2014). Temperature management for the quality assurance of a perishable
food supply chain. Food Control, 40, 198-207.
Baran, M., & Yilmaz, A. (2018). A study of local environment of Harran historical Domed houses in terms
of environmental sustainability. Journal of Asian Scientific Research, 8(6), 211-220.
Basheer, M., Ahmad, A., & Hassan, S. (2019). Impact of economic and financial factors on tax revenue:
Evidence from the Middle East countries. Accounting, 5(2), 53-60.
Cătălin, S. H., Bogdan, B., & Dimitrie, G. R. (2014). The existing barriers in implementing total quality
management. Annals of the University of Oradea, Economic Science Series, 23(1).
Chapman, R. L., & Corso, M. (2005). From continuous improvement to collaborative innovation: the next
challenge in supply chain management. Production Planning & Control, 16(4), 339-344.
Chen, Z., Hossen, M. M., Muzafary, S. S., & Begum, M. (2018). Green banking for environmental
sustainability-present status and future agenda: Experience from Bangladesh. Asian Economic and
Financial Review, 8(5), 571.
Cheong Cheng, Y. (2003). Quality assurance in education: internal, interface, and future. Quality assurance
in Education, 11(4), 202-213.
Chervinski, A. (2014). Ecological evaluation of economic evaluation of environmental quality. Procedia
Economics and Finance, 8, 150-156.
Chidoko, C. (2014). Labor and economic growth in Zimbabwe. The Economics and Finance Letters, 1(4),
24-29.
Choon Boey Lim, F. (2008). Understanding quality assurance: a cross country case study. Quality assurance
in Education, 16(2), 126-140.
Christofi, P., Sisaye, S., & Bodnar, G. (2008). The integration of total quality management into
sustainability.
INTERNAL
AUDITING-BOSTON-WARREN
GORHAM
AND
LAMONT
INCORPORATED, 23(1), 33.
Christopher, M. (2016). Logistics & supply chain management. Pearson UK.
Danbaba, G., Nabegu, A. B., Binta, A., & Mustapha, A. (2016). Assessment of implementation of the
environmental sanitation policy in the Federal Capital Territory (FCT) Abuja, Nigeria. Global Journal
of Social Sciences Studies, 2(1), 1-13.
Diekola, A. M. (2016). The moderating effect of environmental regulation and policy on the relationship
between total quality management (TQM) and organizational performance in the Malaysian food and
beverage companies. Universiti Utara Malaysia.
A. Andriansyah et al. /Uncertain Supply Chain Management 7 (2019)
803
Ekpung, E. G. (2014). Public infrastructure spending and economic growth in Nigeria: An Error Correction
Mechanism (ECM) approach. Journal of Social Economics Research, 1(7), 129-140.
Ellis, C., & Castle, K. (2010). Teacher research as continuous process improvement. Quality Assurance in
Education, 18(4), 271-285.
Elshamy, H. M., & Ahmed, K. I. S. (2017). Green fiscal reforms, environment and sustainable development.
International Journal of Applied Economics, Finance and Accounting, 1(1), 48-52.
Esty, D. C., Levy, M., Srebotnjak, T., & De Sherbinin, A. (2005). Environmental sustainability index:
Benchmarking national environmental stewardship. New Haven: Yale Center for Environmental Law &
Policy, 47-60.
F. Hair Jr, J., Sarstedt, M., Hopkins, L., & G. Kuppelwieser, V. (2014). Partial least squares structural
equation modeling (PLS-SEM) An emerging tool in business research. European Business Review,
26(2), 106-121.
Fearne, A., Hornibrook, S., & Dedman, S. (2001). The management of perceived risk in the food supply
chain: a comparative study of retailer-led beef quality assurance schemes in Germany and Italy. The
International Food and Agribusiness Management Review, 4(1), 19-36.
Fynes, B., De Búrca, S., & Marshall, D. (2004). Environmental uncertainty, supply chain relationship
quality and performance. Journal of Purchasing and Supply Management, 10(4-5), 179-190.
Fynes, B., Voss, C., & De Búrca, S. (2005). The impact of supply chain relationship dynamics on
manufacturing performance. International Journal of Operations & Production Management, 25(1), 619.
Gideon, Z. (2014). Institutionalising and mainstreaming policy analysis culture in African environments.
International Journal of Public Policy and Administration Research, 1(1), 12-25.
Hameed, W. U., Basheer, M. F., Iqbal, J., Anwar, A., & Ahmad, H. K. (2018). Determinants of Firm’s open
innovation performance and the role of R & D department: an empirical evidence from Malaysian
SME’s. Journal of Global Entrepreneurship Research, 8(1), 29.
Henry, U. (2014). Globalization and environmental issues: A new framework for security analysis.
Humanities and Social Sciences Letters, 2(4), 209-216.
Henseler, J., Ringle, C. M., & Sinkovics, R. R. (2009). The use of partial least squares path modeling in
international marketing New challenges to international marketing (pp. 277-319). Emerald Group
Publishing Limited.
Hensher, D. A., & Button, K. J. (2003). Handbook of Transport and the Environment. Emerald Group
Publishing Limited.
Hesse, M., & Rodrigue, J.-P. (2004). The transport geography of logistics and freight distribution. Journal
of Transport Geography, 12(3), 171-184.
Hugos, M. H. (2018). Essentials of supply chain management. John Wiley & Sons.
Hyland, P. W., Soosay, C., & Sloan, T. R. (2003). Continuous improvement and learning in the supply
chain. International Journal of Physical Distribution & Logistics Management, 33(4), 316-335.
Intra, C., & Zahn, T. (2014). Transformation-waves–a brick for a powerful and holistic continuous
improvement process of a Lean production system. Procedia CIRP, 17, 582-587.
Jørgensen, F., Boer, H., & Gertsen, F. (2003). Jump-starting continuous improvement through selfassessment. International Journal of Operations & Production Management, 23(10), 1260-1278.
Jung, J. Y., & Wang, Y. J. (2006). Relationship between total quality management (TQM) and continuous
improvement of international project management (CIIPM). Technovation, 26(5-6), 716-722.
Kigpiboon, C. (2013). The development of participated environmental education model for sustainable
mangrove forest management on eastern part of Thailand. International Journal of Sustainable
Development & World Policy, 2(3), 33.
Kim, N., Janic, M., & Van Wee, B. (2009). Trade-off between carbon dioxide emissions and logistics costs
based on multiobjective optimization. Transportation Research Record: Journal of the Transportation
Research Board(2139), 107-116.
Krittanathip, V., Rakkarn, S., Cha-um, S., & Jindawattana, A. (2013). Implementation of self-assessment
evaluation for total quality management: A case study of wholesale sectors. Procedia-Social and
Behavioral Sciences, 88, 81-88.
804
Leshinsky, R. (2012). Use of planning agreements to support sustainability and environmental preservation:
A case study from Victoria, Australia. International Journal of Law in the Built Environment, 4(2), 157172.
Luong, N. D., Lon, H. V., Tuan, N. K., & Thai, N. D. (2017). Using rubber aggregate derived from discarded
tires for producing cement concrete towards resource recovery and environmental protection in Vietnam.
International Journal of Sustainable Energy and Environmental Research, 6(2), 36-49.
Madu, C. N., Kuei, C.-h., & Winokur, D. (1995). Environmental quality planning: a strategic total quality
management (STQM) approach. Futures, 27(8), 839-856.
Maqbool, N., Hameed, W., & Habib, M. (2018). Impact of political influences on stock returns.
International Journal of Multidisciplinary Scientific Publication (IJMSP), 1(1).
Marshal, I. (2017). Product brand and customer loyalty: A survey of the Nigeria banking industry. Journal
of Accounting, Business and Finance Research, 1(1), 7-18.
Miles, R. E., Snow, C. C., Meyer, A. D., & Coleman Jr, H. J. (1978). Organizational strategy, structure, and
process. Academy of Management Review, 3(3), 546-562.
Mušić, L. (2017). Ecofeminist pragmatism of female founders in sociology as source of women
empowerment in academia and society. International Journal of Emerging Trends in Social Sciences,
1(1), 29-36.
Polit Denise, F., & Hungler Bernadette, P. (1999). Nursing research principles and methods. Phyladelphia:
Lippincott Williams and Wilkins.
Rushton, A., Croucher, P., & Baker, P. (2014). The handbook of logistics and distribution management:
Understanding the supply chain. Kogan Page Publishers.
Santos-Reyes, D., & Lawlor-Wright, T. (2001). A design for the environment methodology to support an
environmental management system. Integrated Manufacturing Systems, 12(5), 323-332.
Sroufe, R., & Curkovic, S. (2008). An examination of ISO 9000: 2000 and supply chain quality assurance.
Journal of Operations Management, 26(4), 503-520.
Suárez-Barraza, M. F., Ramis-Pujol, J., & Tort-Martorell Llabrés, X. (2009). Continuous process
improvement in Spanish local government: Conclusions and recommendations. International Journal of
Quality and Service Sciences, 1(1), 96-112.
Suryanto, T., Haseeb, M., & Hartani, N. H. (2018). The Correlates of Developing Green Supply Chain
Management Practices: Firms Level Analysis in Malaysia. International Journal of Supply Chain
Management, 7(5), 316.
Töremen, F., Karakuş, M., & Yasan, T. (2009). Total quality management practices in Turkish primary
schools. Quality assurance in Education, 17(1), 30-44.
Tran, H., Cahoon, S., & Chen, S.-L. (2011). A quality management framework for seaports in their supply
chains in the 21st century. The Asian Journal of Shipping and Logistics, 27(3), 363-386.
Van Der Bank, C. M., & Van Der Bank, M. (2014). Learning centred environments supporting the
environment of e-learning in South Africa in law class. Humanities and Social Sciences Letters, 2(2),
93-107.
Zhang, W. B. (2017). Economic development and environmental change with endogenous birth and
mortality rates. Asian Journal of Economic Modelling, 5(1), 77-97.
Zheng, C., Qiu, X., & Mao, J. (2017). Logistics in a low carbon concept: Connotation and realization way.
Paper presented at the AIP Conference Proceedings.
Zomorrodi, A., & Zhou, X. (2016). Role of EKC and PHH in determining environment quality and their
relation to economic growth of a country. Asian Journal of Economics and Empirical Research, 3(2),
139-144.
Zomorrodi, A., & Zhou, X. (2017). Impact of FDI on environmental quality of China. International Journal
of Business, Economics and Management, 4(1), 1-15.
© 2019 by the authors; licensee Growing Science, Canada. This is an open access
article distributed under the terms and conditions of the Creative Commons Attribution
(CC-BY) license ( />