Synthesis, spectroscopic characterization, crystal structure and Hirshfeld surface analysis of Co(III), Ni(II) and VO(IV) metal complexes with a novel Schiff base ligand and their
Bạn đang xem bản rút gọn của tài liệu. Xem và tải ngay bản đầy đủ của tài liệu tại đây (2.56 MB, 14 trang )
Current Chemistry Letters 8 (2019) 39–52
Contents lists available at GrowingScience
Current Chemistry Letters
homepage: www.GrowingScience.com
Synthesis, spectroscopic characterization, crystal structure and Hirshfeld surface
analysis of Co(III), Ni(II) and VO(IV) metal complexes with a novel Schiff base
ligand and their antimicrobial activities
Disha Sharmaa and Hosakere D. Revanasiddappaa*
a
Department of Chemistry, University of Mysore, Manasagangothri, Mysuru 570 006, Karnataka, India
CHRONICLE
Article history:
Received September 3, 2018
Received in revised form
November 18, 2018
Accepted December 18, 2018
Available online
December 19, 2018
Keywords:
Schiff base
Metal complexes
X-ray crystal structure
Hirshfeld surface analysis
Antibacterial and antifungal
ABSTRACT
A new series of transition metal complexes of Co(III), Ni(II) and VO(IV) was synthesized with
the bidentate Schiff base ligand (HL) derived from the condensation of 2-amino-3benzyloxypyridine and 5-bromo salicylaldehyde. The synthesized Schiff base ligand and its
metal complexes C1-C6 were structurally characterized by satisfactory elemental analysis,
spectral studies such as (Mass, IR, 1H and 13C NMR, conductance measurement, UV-vis and
magnetic measurements) and thermal studies. The structure of HL was authenticated by X-ray
single-crystal analysis. Hirshfeld surface analysis was carried out to understand the nature of
intermolecular contacts, the fingerprint plot provides the information about the percentage
contribution. Square-pyramidal geometry is proposed for VO(IV) complexes whereas
octahedral geometry for Co(III) and Ni(II) complexes. The Schiff base ligand and its metal
complexes have been tested in vitro for their antibacterial activities by using well diffusion
method against Gram positive bacteria B. subtilis, S. aureus and Gram negative bacteria S.
typhi, E. coli and antifungal activities against A. niger, A. flavus, C. albicans and A. Solani.
The antimicrobial activity data show that metal complexes are more potent than the parent
ligand.
© 2019 by the authors; licensee Growing Science, Canada.
1. Introduction
Schiff bases derived from an amino and carbonyl compound are an important class of ligands that
coordinate to metal ions via azomethine nitrogen and have been studied extensively. In azomethine
derivatives, the C=N linkage is essential for biological activity, several azomethine have been reported
to possess remarkable antimicrobial,1 anticancer2 and antimalarial activities.3,4
For the past two decades, Schiff bases were in constant emergence because of their simplicity in
preparation and diversity in reactions.5 In comparison to 4d or 5d metal complexes, complexes of 3d
transition metal ion exhibit beneficial properties as low toxicity and easily penetrate to the cell
membrane of microbes.6 Literature survey shows that Schiff bases show bacteriostatic and bactericidal
activity.7 Schiff bases containing o-vanillin possesses antifungal, antibacterial properties8 and it acts
as a weak inhibitor of tyrosinase, display both antimutagenic and co-mutagenic properties in E.coli.9
Imines are possess antibacterial and more antifungal activities. The compounds having antimicrobial
activity may act either by killing the microbe or by inhibiting multiplication of the microbe by blocking
* Corresponding author. Tel: +919449271137, +91821-2419669
E-mail address: (H. D. Revanasiddappa)
© 2019 by the authors; licensee Growing Science, Canada
doi: 10.5267/j.ccl.2018.012.003
40
their active sites.10 Schiff bases derived from salicylaldehydes are well known as polydentate ligands,
coordinating as deprotonated or neutral forms.11 Thus, the chemical literature prompted us to prepare
the transition metal complexes with new Schiff base ligand, here we present the synthesis and
characterization of new Schiff base ligand derived from 2-amino-3-benzyloxypyridine and 5-bromo
salicylaldehyde as well as its Co(III), Ni(II) and VO(IV) metal complexes. Further, the structures of
the complexes are elucidated by various spectral techniques. The bio-relevancy of these complexes
have been professionally studied and explored by antimicrobial studies. The crystal structure of the
HL ligand was studied by X-ray analysis and to same is reported.
2. Results and discussion
The obtained complexes are coloured powders, stable in air, insoluble in water and other common
solvents but are easily soluble in polar coordinating solvents such as DMF and DMSO. Elemental
analysis of the complexes indicates the stoichiometry to be 1:2 metal: ligand for C1, C3 and C5 and
1:1:1 metal: ligand: 1, 10-phenanthroline for C2, C4 and C6. The analytical data of the ligand and metal
complexes are given in Table 1 and are in good agreement with the proposed formulation. The molar
conductivity values corresponding to the Co(III), Ni(II) and VO(IV) complexes at 10-3 M in DMSO
in the range of 9.37-17.55 Ω-1cm2 mol-1 and in this way a structural formula of non-electrolyte for these
complexes can be assigned.
Table. 1. Elemental analysis and physical data of Schiff base ligand and its metal complexes.
Molecular
Formula
Compound
Yield
(%)
Magnetic
moment
µeff BM
Calculated (Found) (%)
HL
C19H15BrN2O2
87
(%)C
59.55
(60.07)
CoC38H30Br2ClN4O5
75
52.97
(53.05)
4.00
(4.32)
6.18
(6.37)
__
C1
CoC31H22BrCl2N4O2
69
53.78
(53.86)
3.20
(3.49)
8.09
(8.47)
__
C2
NiC38H32Br2N4O6
76
54.03
(54.29)
4.31
(4.75)
6.30
(6.53)
3.3
C3
81
55.66
(55.87)
3.99
(4.09)
8.53
(8.71)
3.4
C31H26BrN4O4
VC38H28Br2N4O5
63
55.77
(55.94)
3.98
(4.17)
6.50
(6.71)
1.71
C5
VC31H22BrN4O3
71
59.16
(55.37)
3.52
(3.84)
8.90
(9.05)
1.74
C6
C4
Ni
(%)H
3.95
(3.14)
(%)N
7.31
(6.96)
__
2.1. Description of the X-ray structure of HL
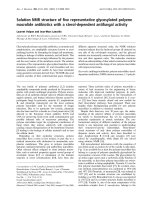
Single crystal X-ray diffraction analysis confirms the molecular structure of the title ligand HL.
ORTEP view structure of the title ligand is shown in Fig. 1. The optimized parameters (bond lengths
and bond angles) are in good agreement with the standard values, the list of selected bond lengths and
bond angles are given in Tables 2 and Table 3. The title ligand exists in orthorhombic crystal system
with Pca21 space group. The unit cell parameters are a = 14.240(3) Å, b = 16.090(3) Å, c = 7.2170(13)
Å and V= 1653.5(5) Å3. The average length of the N1=C7 bond is 1.289(15) Å, and bond angle of
N1-C7-C6 is 120.0(9)° obtained. In the crystal, two types of intermolecular hydrogen-bonding
interactions are present (Table 4). The primary strong O2-H2---N1 hydrogen bond between the imine
group and a carbonyl group generates butterfly structure along the b-axis direction and the secondary
D. Sharma and H. D. Revanasiddappa / Current Chemistry Letters 8 (2019)
41
weak methyl C19-H19---O1i and C19-H19---O2i (where, i=-x+1,-y+1,-z+1/2) hydrogen-bonding
interactions as depicted in Fig. 2.
Table. 2. Selected bond distances (Å) for HL.
Atom
Br1—C2
O1—C12
O1—C13
O2—H2
O2—C5
N2—C9
N2—C8
N1—C7
N1—C8
C15—H15
C15—C14
C15—C16
C9—H9
C9—C10
C4—H4
C4—C5
C4—C3
C10—H10
C10—C11
C11—H11
C11—C12
Length
1.881 (15)
1.373 (12)
1.429 (16)
0.8200
1.337 (15)
1.34 (2)
1.354 (13)
1.289 (15)
1.392 (18
0.9300
1.360 (18)
1.422 (16)
0.9300
1.33 (3)
0.96 (14)
1.42 (2)
1.36 (2)
0.9300
1.405 (18)
0.77 (18)
1.370 (19)
Atom
C2—C1
C2—C3
C1—H1
C1—C6
C5—C6
C6—C7
C3—H3
C7—H7
C18—H18
C18—C17
C18—C19
C8—C12
C17—H17
C17—C16
C13—H13a
C13—H13b
C13—C14
C14—C19
C16—H16
C19—H19
Length
Table. 3. Selected bond angles (°) for HL.
Atom
Angle
Atom
C13—O1—C12
C5—O2—H2
C8—N2—C9
C8—N1—C7
C14—C15—H15
C16—C15—H15
C16—C15—C14
H9—C9—N2
C10—C9—N2
C10—C9—H9
C5—C4—H4
C3—C4—H4
C3—C4—C5
H10—C10—C9
C11—C10—C9
C11—C10—H10
H11—C11—C10
C12—C11—C10
C12—C11—H11
C1—C2—Br1
C3—C2—Br1
C3—C2—C1
H1—C1—C2
C6—C1—C2
C6—C1—H1
C4—C5—O2
C6—C5—O2
C6—C5—C4
C5—C6—C1
C7—C6—C1
C7—C6—C5
C2—C3—C4
H3—C3—C4
H3—C3—C2
C6—C7—N1
H7—C7—N1
H7—C7—C6
C17—C18—H18
N1—C8—N2
C12—C8—N2
C12—C8—N1
H17—C17—C18
C16—C17—C18
C16—C17—H17
C11—C12—O1
C8—C12—O1
C8—C12—C11
H13a—C13—O1
H13b—C13—O1
H13b—C13—H13a
C14—C13—O1
C14—C13—H13a
C14—C13—H13b
C13—C14—C15
C17—C16—C15
H16—C16—C15
H16—C16—C17
C14—C19—C18
116.7 (10)
109.5
117.9 (11)
120.9 (9)
120.3 (6)
120.3 (7)
119.5 (10)
118.3 (7)
123.5 (11)
118.3 (8)
103 (11)
137 (10)
119.7 (9)
119.8 (8)
120.5 (15)
119.8 (10)
127 (14)
117.4 (14)
112 (13)
121.1 (8)
119.4 (11)
119.5 (13)
119.7 (6)
120.6 (9)
119.7 (6)
118.3 (9)
122.1 (12)
119.5 (11)
118.9 (12)
1.37 (2)
1.407 (16)
0.9300
1.420 (18)
1.409 (13)
1.43 (2)
0.9300
0.9300
0.94 (15)
1.38 (2)
1.386 (19)
1.416 (16)
1.10 (14)
1.388 (18)
0.85 (16)
0.80 (18)
1.529 (15)
1.396 (13)
0.98 (18)
0.9300
Angle
119.4 (8)
121.6 (11)
121.7 (13)
119.1 (7)
119.1 (9)
120.0 (9)
120.0 (7)
120.0 (5)
123 (10)
120.6 (11)
121.1 (12)
118.3 (8)
117 (7)
120.5 (9)
118 (8)
126.3 (11)
114.1 (11)
119.6 (10)
99 (11)
91 (12)
120 (15)
108.2 (10)
112 (9)
120 (10)
121.4 (9)
119.0 (12)
118 (7)
123 (7)
119.3 (12)
42
Table. 4. Intermolecular hydrogen bonds and weak intermolecular hydrogen bond geometry for HL [Å
and °].
D-H...A
O2-H2...N1
C19-H19...O1i
C19-H19...O2i
d(D-H)
0.82
0.93
0.93
d(H...A)
1.85(4)
2.78(2)
2.90(1)
d(D...A)
2.565 (13)
3.392 (16)
3.464 (14)
<(DHA)
145 (6)
124 (1)
121 (1)
Symmetry code used: (i) -x+1,-y+1,-z+1/2
Fig. 1. ORTEP structure view of the HL.
Fig. 2. Crystal packing diagram viewed along b with O2—H2--N1 intermolecular hydrogen bond is
shown as a light blue dashed line
D. Sharma and H. D. Revanasiddappa / Current Chemistry Letters 8 (2019)
43
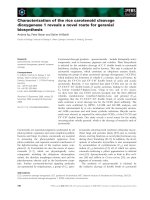
2.2. Hirshfeld-surface analysis
Hirshfeld surface analysis is an effective tool for exploring packing modes and intermolecular
interactions in molecular crystals, as they provide a visual picture of intermolecular interactions and of
molecular shapes in a crystalline environment. Surface features characteristic of different types of
intermolecular interactions can be identified, and these features can be revealed by colour coding
distances from the surface to the nearest atom exterior (de plots) or interior (di plots) to the surface. This
gives a visual picture of different types of interactions present and also reflects their relative
contributions from molecule to molecule.
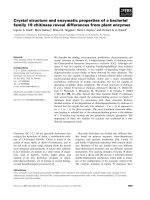
Hirshfeld surfaces and their associated two-dimensional fingerprint plots have been used to quantify
the various intermolecular interactions in the title ligand.12,13 The two dimensional fingerprint plots
from Hirshfeld surface analyses along with the electrostatic potential plots, illustrate the difference
between the intermolecular interaction patterns and the relative contributions to the Hirshfeld surface
(in percentage) for the major intermolecular contacts associated with the title ligand.
The intermolecular interactions of the title ligand are shown in the 2D fingerprint plots shown in
Fig. 4. H---H (34.20%) contacts make the largest contribution to the Hirshfeld surfaces, while the N--H, O--H, H--Br and C---H interactions which make up 7.0, 8.2, 13.3 and 27.9 %of the surface. Plots
also reveal the information regarding the intermolecular hydrogen bonds thus supporting for O—H…N
intermolecular interactions. This intermolecular contact is highlighted by conventional mapping of
dnorm on molecular Hirshfeld surfaces and is shown in Fig. 3. The red spots over the surface indicate
the inter contacts involved in hydrogen bond. The dark-red spots on the dnorm surface arise as a result
of the short interatomic contacts, i.e., weak C—H…O hydrogen bonds, while the other intermolecular
interactions appear as light-red spots.
Fig. 3. Hirshfeld surface mapped with a) dnorm for visualizing the intermolecular interactions of the HL
b) Shape index property for a compound HL c) Hirshfeld surface mapped over curvedness
2.4
de
2.4
de
2.4
2.2
2.2
2.2
2.0
2.0
2.0
1.8
1.8
1.8
1.6
1.6
1.6
1.4
1.4
1.4
1.2
1.2
1.2
1.0
1.0
1.0
0.8
0.8
0.8
0.6
0.6
(Å)
di
100%
0.6
0.8
1.0
1.2
1.4
1.6
1.8
2.0
2.2
2.4
(Å)
HH 34.2%
di
0.6 0.8 1.0 1.2 1.4 1.6 1.8 2.0 2.2 2.4
0.6
(Å)
de
CH 27.9%
di
0.6 0.8 1.0 1.2 1.4 1.6 1.8 2.0 2.2 2.4
44
2.4
de
2.4
de
2.4
2.2
2.2
2.2
2.0
2.0
2.0
1.8
1.8
1.8
1.6
1.6
1.6
1.4
1.4
1.4
1.2
1.2
1.2
1.0
1.0
1.0
0.8
0.8
0.8
0.6
0.6
(Å)
di
HBr 13.3%
0.6
0.8
1.0
1.2
1.4
1.6
1.8
2.0
2.2
2.4
(Å)
di
OH 8.2%
0.6
0.8
1.0
1.2
1.4
1.6
1.8
2.0
2.2
2.4
0.6
de
di
NH 7.0%
(Å)
0.6
0.8
1.0
1.2
1.4
1.6
1.8
2.0
2.2
2.4
Fig. 4. d) Fingerprint plots and corresponding surface area of the title compound showing the individual
contribution of each interaction. di is the closest internal distance from a given point on the
Hirshfeld surface and de is the closest external contacts.
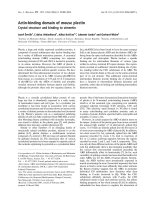
2.3. FTIR spectra
The relevant FTIR data for the ligand and its metal complexes are given in Table 5. The strong
band is observed at 1617 cm−1 in the spectra of the free Schiff base ligand is a characteristic of the
azomethine ν(C=N) stretching vibrations and it is disappeared upon coordination with metal ion.14 The
shifting of this group to lower frequency (1564-1591 cm-1) in the metal complexes suggest the bonding
of unsaturated nitrogen of the azomethine group of HL to the metal ions. The presence of a broad peak
in the range 3500-3450 cm-1 indicates the presence of water molecule. The band for phenolic oxygen
ν(Ph–O) occurs at 1277 cm-1, whereas in complexes, this band is shifted to different frequency
showing a strong band at around 1262-1274 cm-1 region indicates that there existed phen Ocoordination and involved in coordination with metal ion. The characteristic frequency for ligand
corresponding to ether C-O showing a band around 1230 cm-1, which is unaltered in the spectra of
complexes. It shows that the ether C-O is not involved in the coordination.15,16 The metal-terminal
oxygen ν(V=O) of the complexes C5 and C6 occurs at 974 and 969 cm-1 regions, respectively, which
imitates the most of the oxidovanadium(IV) complexes. The new bands existed in the range 467-488
cm-1and 515-549 cm−1 provides an additional proof for M‐N and M‐O, respectively. The appearance
of νM-N and νM-O vibrations supports the proposed mode of coordination as depicted in Fig. 5.
Table. 5. FTIR spectral data of the Schiff base ligand [HL] and its metal complexes
Compound
HL
C1
C2
C3
C4
C5
C6
ν(C=N)
1602
1569
1577
1564
1567
1588
1591
ν(Ph-O)
1277
1274
1265
1270
1262
1273
1269
ν(V=O)
__
__
__
__
__
974
969
ν(M-O)
__
475
467
488
469
472
481
HL
C1
C4
C5
110
100
90
%T
80
70
60
4000
3500
3000
2500
2000
1500
1000
500
-1
Wavenumber (cm )
Fig. 5. IR spectra of HL and its metal complexes
ν(M-N)
__
515
539
527
543
519
549
D. Sharma and H. D. Revanasiddappa / Current Chemistry Letters 8 (2019)
45
2.4. Electronic spectra and magnetic moment Studies
The UV–Vis spectra of complexes in DMSO were recorded in the range of 200–800 nm as shown
in Fig. 6. The geometry of metal complexes has been deduced from electronic spectra data of the
complexes. The electronic spectra of Co(III) complexes shows a broad band at around 259-272, 304341 and a shoulder at 574-616 nm, which may tentatively be assigned to 4T1g(F)→4T1g(P) and
4
T1g(F)→4A2g(F), respectively, indicating an octahedral configuration around cobalt ion.17 The
electronic spectra of Ni(II) complexes are measured in DMSO exhibits bands at 254-258, 307-347 and
592-612 nm assigned to the π→π* intraligand transition band charge transfer transition
3
A2g(F)→3T2g(F) from the metal to antibonding orbital of the ligand and 3A2g(F)→3T1g(P) transitions,
respectively, in an octahedral geometry around Ni(II) ion.18 The observed magnetic moment values
were found in the range of 3.3–3.4 BM, which is in the usual range of reported octahedral around the
Ni(II) ion.19 The electronic spectra of VO(IV) complexes show low intensity d-d bands at 257-274,
321-341 and 569-583 nm assigned to 2b2→2e, 2b2→2b1 and 2b2→ 2a1 transitions, respectively, and it is
in conformity with square pyramidal geometry around VO(IV).20 The room temperature μeff value for
the vanadium complexes were found in the range 1.71-1.74 B.M. The magnetic susceptibilities of the
complexes are consistent with square-pyramidal geometry around the central metal ion.21
0.5
C1
C2
C3
C4
C6
Absorbance
0.4
0.3
0.2
0.1
0.0
200
300
400
500
Wavelength(nm)
600
700
800
Fig. 6. The Electronic spectra of Co(III), Ni(II) and VO(IV) complexes.
2.5. Thermal analysis
Thermogravimetric analysis of representative samples has been studied as a function of
temperature from room temperature to 800 °C under a nitrogen atmosphere at a heating rate of 10 °C
/min. In the cobalt -complexes the first weight loss of 6.57% (calcd. 6.69%) in the 157–229 °C range
indicates the loss of coordinated water and chlorine molecules. The second and third steps correspond
to the complete loss of the ligand molecule in the temperature range between 230–480 and 481–567
°C with a mass loss of 27.62% (calcd.27.89) and 17.39% (calcd.17.75%), respectively. Finally the
most stable CoO is formed. Thermal analysis of Ni-complexes can be divided into three stages. In the
first stage, weight loss is in the range 50–130 °C having mass loss of 13.27% (calcd.13.98%) due to
loss of coordinated water and chloride ion. In continuation to the first stage, gradual weight loss in the
range 150-370 °C having mass loss of 35.77% (calcd. 36.05%) shows partial decomposition of the
ligand moiety around the metal ion. The degradation stage is in the range of 390 -550 °C with an
estimated mass loss of 33.27% (calcd. 33.77%). This mass loss corresponds to the pyrolysis of ligand
molecules leaving NiO as a residue. And, one 1, 10-phenanthroline moiety were decomposed at 560–
660 °C, with mass losses of 29.07% (calcd. 29.57 %) and 30.62% (calcd. 31.17 %) leaving behind the
corresponding metal oxide respectively. The vanadium- complexes decomposes in two stages. The
first stage degradation starts at 190-244 °C with an estimated weight loss of 35.07% (calcd.35.68%)
due to loss of phenanthroline. Further decomposition occurs in the temperature range of 250- 460 °C
having mass loss of 42.57% (calcd. 42.79) indicates the loss of coordinated ligand. Further
46
decomposition occurs in the temperature range of 550-670 °C corresponds to the final residue
estimated as free vanadium oxide22 and is shown in Fig. 7. On the basis of above facts, the proposed
structure of metal complexes are presented in Fig. 8.
Fig. 7. Thermograms of cobalt and vanadium complexes
Br
Cl N
O
N
O
Co
Br
O
Cl
N
O
O
N
N H2O
Br
O
Br
H2O N
O
N
O
N
N Cl
C2
C1
Br
N
Co
H2O
O
O
N
Ni
N
Ni
N
O
O
N H2O
N
Br
C3
N
H2O
C4
Br
Br
O N
O
N
O
V
N
C5
O
O
O
N
N
V
N
O
O
Br
N
N
C6
Fig. 8. Proposed structures of the prepared metal complexes
2.6. Biological activity
2.6.1. Antimicrobial activity
The synthesized compounds of cobalt, nickel and vanadium complexes were screened for
antibacterial activities against Gram positive bacteria Bacillus subtilis (ATCC 21332), Staphylococcus
D. Sharma and H. D. Revanasiddappa / Current Chemistry Letters 8 (2019)
47
aureus (ATCC 25923) and Gram negative bacteria Salmonella typhi (19430), Escherichia coli (ATCC
25922) and antifungal activities against Aspergillus niger (MTCC 1881), Aspergillus lavus (MTCC
873), Candida albicans (MTCC 227) and Alternaia Solani (MTCC 4634) by well diffusion method.23
Chloramphenicol and fluconazole were used as standards drugs for the comparison of the results. The
minimum inhibitory concentration (MIC) profile of the entire compounds against bacteria and fungi
are summarized in Tables 6 and Table 7. Four bacterial stains were incubated for 24 h at 37 °C, and
fungal stains were incubated for 48 h at 37 °C along with standard antibacterial drug under similar
conditions for comparison. The fungi were subcultured in potato dextrose agar medium, and the
standard antifungal drug, fluconazole was used for control. Stock solution (10−3 M) was prepared by
dissolving the compounds in DMSO. Development of any turbidity illustrated that the compound was
not able to inhibit the growth, while no turbidity indicated the inhibition of microorganism by the
sample. All the studies were performed in triplicates and the average zone of inhibition was taken as
the final reading.
Table. 6. Antimicrobial results of the Schiff base ligand and its metal complexes.
Zone of inhibition (in mm)
Compound
HL
C1
C2
C3
C4
C5
C6
Chloramphenicol
Fluconazole
Antibacterial
Gram-positive bacteria
Gram-negative
bacteria
B. subtilis S. aureus S.typhi
E.coli
15
13
17
11
21
19
20
23
29
27
24
28
34
28
31
29
27
22
28
31
32
30
31
33
28
27
30
29
38
33
26
35
-----
Antifungal
A.niger
10
18
19
23
16
22
20
-27
A. flavus
13
16
14
22
20
20
15
-24
C.albicans
11
15
13
27
17
23
17
-29
A.solani
9
13
15
24
19
24
18
-26
The outcome in the above studies shows that the activity of the complexes is higher than that of the
corresponding ligand and this activity enhanced on coordination with metal ions. This enhancement in
the activity may be rationalized on the basis that ligands mainly posses C=N bond. The enhanced
antimicrobial activity of the complex compared with its ligand can be explained using chelation
theory.24 The increase in antimicrobial activity may be considered in light of Searl’s concept and
Tweedy’s chelation theory.25, 26, 27
Table. 7. MIC [μg/ml] values for antimicrobial activity of Schiff base ligand and its corresponding
metal complexes
Compound
HL
C1
C2
C3
C4
C5
C6
Chloramphenicol
Fluconazole
Bacteria
Gram-positive bacteria
Gram-negative bacteria
B. subtilis
S. aureus
S.typhi
E.coli
>100
>100
>100
>100
71
66
69
73
74
72
70
71
83
78
81
72
79
77
75
74
74
76
81
83
78
73
67
65
37
37
37
37
-----
Fungi
A.niger
>100
68
59
77
72
80
71
-37
A. flavus
>100
72
68
82
65
78
69
-37
C.albicans
>100
77
73
74
77
85
73
-37
A.solani
>100
63
70
80
79
75
77
-37
3. Conclusion
In the present work, Co(III), Ni(II) and VO(IV) complexes were prepared from novel Schiff base
and are characterized using various spectral techniques. The IR spectral data demonstrate that the ligand
acts as a bidentate, coordinating through azomethine nitrogen and carbonyl oxygen atoms. Thermal
data provided the number of coordinated and lattice water molecules in the complexes. Magnetic and
electronic spectral studies revealed octahedral geometry for Co(III) and Ni(II) complexes and square-
48
pyramidal for VO(IV) complexes. The crystal structure of ligand HL has also been determined by Xray diffraction studies. The ligand and its Co(III), Ni(II) and VO(IV)complexes were tested for
antimicrobial activity against some pathogen. Antimicrobial study reveals that, metal complexes have
more biological activity than free ligand.
Acknowledgements
The author Disha Sharma is thankful to the University of Mysore, Mysuru for laboratory facilitates.
Also, wish to thank Sagar BK for X-ray diffraction and Hirshfeld surface analysis. I also like to
acknowledge Institute Of Excellence, University of Mysore, Mysuru for providing Instrumentation
Facility.
4. Experimental
4.1. Materials and methods
All the reagents, starting materials as well as solvents were purchased commercially and used
without any further purification. 1, 10-phenanthroline monohydrate and CoCl2.6H2O, NiCl2.6H2O and
VOSO4.2H2O obtained from Merck Specialties Private Limited, Mumbai were used. Melting point was
determined in open capillary tube using Precision Digital Melting Point Apparatus and is uncorrected.
Elemental analysis was performed on Perkin Elmer 240 CHN-analyzer. 1H and 13C NMR spectra were
obtained on Varian-400 MHz spectrometer using TMS (Tetra methyl silane) as an internal reference
(Chemical shifts in δ, ppm) in CDCl3 solvent. Electrospray ionization (ESI) mass spectra were recorded
using a 2010EV LCMS Shimadzu spectrometer. Infrared spectra were measured using Perkin Elmer
Spectrum Version 10.03.09.in the range of 4000-400 cm-1. The magnetic susceptibility of the solid
complexes was determined by Gouy method at room temperature (27±3°C) using Hg[Co(SCN)4] as the
standard. Molar conductance in ~10-3 M DMSO solution was recorded using an Elico Cm-180
conductometer. Electronic spectra of the complexes in the UV-visible region (200-800nm) were
measured using an ELICO SL 117 double beam spectrophotometer with quartz cells. TG and DTA
measurements for the complexes were recorded in nitrogen atmosphere on TGA Q50 instrument
keeping the final temperature at 800 °C with the heating rate of 10 °C/min.
4.2. Synthesis of ligand and its complexes
4.2.1. Synthesis of (E)-2-((3-(benzyloxypyridinylimino) methyl)-4-bromophenol (HL)
A new Schiff base was prepared (as shown in scheme, Fig. 9) by the condensation of equimolar
amounts of 2-amino-3-benzyloxypyridine (0.002 mol) and 5-bromo salicylaldehyde (0.002 mol) were
taken in round bottom flask containing minimum quantity of ethanol. The reaction mixture was
refluxed with a catalytic amount of glacial acetic acid (1-2 drops) for about 7-8 h on a water bath at a
temperature of 70-80 °C. The progress of the reaction was monitored by TLC. On completion of the
reaction, the product was separated by filtration, washed and dried over anhydrous CaCl2 in desiccator
and recrystallized from ethanol. Mass spectrum, 1H NMR, 13C NMR and FT IR spectrum of HL are
depicted in Figs. (10-13). The developed single crystal was used to elucidate the structure of HL by
single crystal X-ray diffractometer.
Ligand (HL): Orange, Yield 87%, melting point 128-130 °C. CHN found (calc.) for C19H15BrN2O2:
C: 59.55(60.07), H: 3.95(3.14), N: 7.31(6.96); MS (m/z): 383[M+]; Found: 385[M+2]; FTIR ʋ (cm-1);
ν (OH) 3406, ν (C=N) 1617; 1H NMR (400 MHz, CDCl3); 9.36(s, HC=N), 14.22(s, Ph-OH), 6.918.0(m, Ar–H), 5.22(-CH2-O); 13C NMR (400 MHz, CDCl3); 161.816, 161.545, 148.771, 147.071,
140.203, 136.219, 135.976, 134.906, 128.706, 128.145, 126.953, 123.720, 121.459, 120.700, 119.623,
110.114, 77.293, 76.974, 76.655. UV-Vis (DMSO): λmax=376 nm.
D. Sharma and H. D. Revanasiddappa / Current Chemistry Letters 8 (2019)
Br
O
N
NH2
+
49
O
O
H
OH
Ethanol, CH3COOH
N
N
OH
Reflux 8 h
Br
Fig. 9. Schematic representation of synthesis of Schiff base ligand
Fig. 10. MS spectrum of HL
Fig. 11. 1H-NMR of HL
Fig. 12. 13C-NMR of HL
HL
50
95
HL
90
85
80
%T
75
70
65
60
4000
3500
3000
2500
2000
1500
1000
-1
Wavelength (cm )
Fig. 13. FT IR spectrum of HL
4.2.2. Preparation of complexes C1, C3 and C5 in the ratio of 1:2
The ethanolic solutions of corresponding metal salts (1 mmol) were added slowly to a hot ethanolic
solution of Schiff base ligand HL (2 mmol). The reaction mixture was refluxed for 6 h at 70 °C on
water bath. The precipitate obtained was filtered, washed with ethanol and dried in desiccators using
calcium chloride.
4.2.3. Preparation of complexes C2, C4 and C6 in the ratio of 1:1:1
The complexes were prepared by mixing equimolar ethanolic solutions of metal salts (1 mmol) and
ligand (1 mmol) with stirring for 30 minutes. A solution of 1, 10-phenanthroline monohydrate (Phen)
(1 mmol) dissolved in 10 ml ethanol was added to the reaction mixture. It was continued to reflux for
6 h on water bath. Then evaporated the solvent and the resulting complexes were used for further
analysis. The development of single crystal of the metal complexes is unsuccessful.
4.3. Crystal structure determination by X-ray crystallography
Single crystal X-ray diffraction data of the Schiff base ligand HL was collected on a Bruker,
Microstar Proteum 8 diffractometer, with Cu-Kα radiation (λ=1.54178 °A) at 296 K. The structure was
solved by direct methods using SHELXS-86 and refined by full-matrix technique using SHELXL2014.28,29 All the non-hydrogen atoms were refined anisotropically. The summary of pertinent crystal
data along with further details of structure determination and refinement are given in Table 8. The
ORTEP, planes and packing diagrams were generated using the Mercury 3.8 software.
Table. 8. Crystal data and structure refinement parameters of the HL.
Identification code
CCDC deposition number
Empirical formula
Formula weight
Temperature
Wavelength
Crystal system
Space group
Unit cell dimensions
Volume
Z
Density (calculated)
Absorption coefficient
F(000)
Crystal size (in mm)
Theta range for data collection
HL
1585783
C19H15BrN2O2
383.2
296 K
1.54178 Å
orthorhombic
Pca21
a = 14.240(3) Å
b = 16.090(3) Å
c = 7.2170(7) Å
1653.5(5) Å3
4
1.539 Mg/m3
3.50 mm-1
775.0352
0.31 x 0.29 x 0.28
5.5to 64.0
α= 90°
β= 90°
γ = 90°
D. Sharma and H. D. Revanasiddappa / Current Chemistry Letters 8 (2019)
Data collection
Index ranges
Reflections collected
Independent reflections
Criterion for observed reflections
Refinement
Refinement method
Data / restraints /constraints / parameters
Goodness-of-fit on F2
Final R indexes [I>=2σ (I)]
R indices (all data)
H-atom parameters treatment
(/σ)max
Largest diff. peak and hole
51
-16 ≤ h ≤ 15, -16≤ k ≤ 18, -7 ≤ l ≤ 8
6340
2173
I >2σ (I)
Full-matrix least-squares on F2
2173 / 01/ 23/ 242
1.20
R1 = 0.138, wR2 = 0.309
R1 = 0.2051, wR2 = 0.3094
mixture of independent and constrained refinement
0.867
max = 2.93 Å-3, min = -0.53 e Å-3
4.4. In-vitro Antimicrobial Screening
In vitro antimicrobial screening effects of the ligand and its metal complexes were tested for their
antibacterial and antifungal activities using disc diffusion method. Chloramphenicol and fluconazole
are the standards for antibacterial and antifungal activities, respectively. All the experiments were
performed in triplicate and the average zone of inhibition was recorded. To get the required test
solutions, the compounds were dissolved in DMSO. The compounds which show significant activities
were selected to determine the minimum inhibitory concentration (MIC) using well diffusion
technique.
References
1.
Isloor A. M., Kalluraya B., and Shetty P. (2009) Regioselective reaction: synthesis, characterization
and pharmacological studies of some new Mannich bases derived from 1,2,4-triazoles. Eur. J. Med.
Chem. 44 (9) 3784–7.
2. Mohareb R. M., El-Sayed N. N. E. and Abdelaziz M. A. (2012) Uses of Cyanoacetylhydrazine in
Heterocyclic Synthesis: Novel Synthesis of Pyrazole Derivatives with Anti-tumor Activities.
Molecules 17 (7) 8449–63.
3. Ziegler J., Schuerle T., Pasierb L., Kelly C., Elamin A., Cole K. A., and Wright D. W. (2000) The
Propionate of Heme Binds N4O2 Schiff Base Antimalarial Drug Complexes. Inorg. Chem. 39 (16)
3731–3733.
4. Annapoorani S., and Krishnan C. N. (2013) Synthesis And Spectroscopic Studies Of Trinuclear N4
Schiff Base Complexess, J. Chem. Tech. Res. 5 (1) 180-185.
5. Shoaib K., Rehman W., Mohammad B. and Ali S. (2013) Synthesis, Characterization and Biological
Applications of Transition Metal Complexes of [no] Donor Schiff Bases. J. Proteomics Bioinform. 6
(7) 153–7.
6. Chang H. Q., Jia L., Xu J., Zhu T. F., Xu Z. Q., and Chen R. H. (2016) Syntheses, crystal structures,
anticancer activities of three reduce Schiff base ligand based transition metal complexes. J. Mol. Struct.
1106, 366–72.
7. Khamamkar A. and Pallapothula V. R. (2014) Synthesis and charecterisation of complexes derived
from succinyl dihydrazide and 3-acetyl-6- methyl-2H-pyran-2, 4(3H)-dione. Acta Biomed. Sci. 1 (4)
179-184.
8. Temel H., and Sekerci M., (2001) Novel complexes of manganese(iii), cobalt(ii), copper(II), and
zinc(II) with Schiff base derived from 1,2-bis(p-amino-phenoxy)ethane and salicylaldehyde. Synth.
React. Inorg. Met. Org. Chem. 31 (5) 849-57.
9. Watanabe K., Ohta T., and Shirasu Y. (1989) Enhancement and inhibition of mutation by o-vanillin in
Escherichia coli. Mutat. Res.218 (2) 105-9.
10. Pelgrift R. Y., and Friedman A. J. (2013) Nanotechnology as a therapeutic tool to combat microbial
resistance. Adv. Drug Deliv. Rev. 65 (13–14) 21803–1815.
11. Boyd D. B. (1983) Substituent effects in cephalosporins as assessed by molecular orbital calculations,
nuclear magnetic resonance, and kinetics. J. Med. Chem. 26 (7) 1010-1013.
52
12. Spackman M. A., and McKinnon J. J. (2002) Fingerprinting intermolecular interactions in molecular
crystals. CrystEng Comm. 4 (66) 378–392.
13. Soman R., Sujatha S., Sushmita De., Rojisha V.C., Parameswaran P., Varghese B., and Arunkumar C.
(2014) Intermolecular Interactions in Fluorinated Tetraarylporphyrins: An Experimental and
Theoretical Study. Eur. J. Inorg. Chem. 2014 (16) 2653–2662.
14. Kumar L. S., Prasad K. S., and Revanasiddappa H. D. (2013) SODs, DNA binding and cleavage studies
of new Mn(III) complexes with 2-((3-(benzyloxy)pyridin-2-ylimino)methyl)phenol. Spectrochim Acta
A Mol Biomol Spectrosc. 107, 203–212.
15. Ma J-X., Li Q-L., Li P-P., Zhao J-X., and Zhao L. (2018) Crystal structure of bis{5-methoxy-2-((E)((4-((E)-1-(methoxyimino)ethyl)phenyl)imino)methyl)phenolato-κ 2N,O}nickel(II), C34H34N4NiO6. Z.
Kristallogr. - New Cryst. Struct. 233 (5) 767-769.
16. Hong Y., Liu W., and Gou G. (2018) Crystal structure of [4-chloro-2-(((2-((3-ethoxy-2oxidobenzylidene)amino)phenyl)imino)(phenyl)methyl)phenolato-κ4N,N′,O,O′}nickel(II) - ethyl
acetate (1/1), C32H29ClN2NiO5. Z. Kristallogr. - New Cryst. Struct. 233 (6) 989-991.
17. Neelakantan M. A., Rusalraj F., Dharmaraja J., Johnsonraja S., Jeyakumar T., and Pillai M.S. (2008)
Spectral characterization, cyclic voltammetry, morphology, biological activities and DNA cleaving
studies of amino acid Schiff base metal(II) complexes. Spectrochim. Acta Part A 71(4) 1599-1609.
18. Gull P., AL-Thabaiti S.A., and Hashmi A.A. (2014) Design, Characterization and antimicrobial activity
of Cu(II), Co(II) and Zn(II) complexes with Schiff base from 1,2-diphenylethane-1,2-dione and N-(1Naphthyl) ethylenediamine. Int. J. Multidiscip. Curr. Res. 2 (6) 1142-1147.
19. Kumar S., Deepak V., Kumari M., and Dutta P.K. (2015) Antibacterial activity of diisocyanatemodified chitosan for biomedical applications. Int. J. Bio. Macro. 84, 349-353.
20. Raman N., Ravichandran S., and Thangaraja C. (2004) Copper(II), cobalt(II), nickel(II) and zinc(II)
complexes of Schiff base derived from benzil-2,4-dinitrophenylhydrazone with aniline. J. Chem.
Sci.116 (4) 215-219.
21. Pranita U.G., Mandlik P.R., and Aswar A.S. (2015) Synthesis and characterization of Cr(III), Mn(III),
Fe(III), VO(IV), Zr(IV) and UO2 (VI) complexes of schiff base derived from isonicotinoylhydrazine.
Indian J. Pharm. Sci. 77 (4) 376-381.
22. Prasad K. S., Kumar L. S., Shekar S. C., Prasad M., and Revanasiddappa H. D. (2011) Oxovanadium
Complexes with Bidentate N, O Ligands: Synthesis, Characterization, DNA Binding, Nuclease
Activity and Antimicrobial Studies. Chem. Sci. J. 2 (1) 1-10.
23. Belaid S., Landreau A., Djebbar S., Benali-Baitich O., Bouet G., and Bouchara J. P. (2008) Synthesis,
characterization and antifungal activity of a series of manganese(II) and copper(II) complexes with
ligands derived from reduced N,N′-O-phenylenebis(salicylideneimine). J. Inorg.Biochem. 102 (1) 63–
69.
24. El-Sherif A. A., Shoukry M. M., and Abd-Elgawad M. M. A. (2012) Synthesis, characterization,
biological activity and equilibrium studies of metal(II) ion complexes with tridentate hydrazone ligand
derived from hydralazine. Spectrochim. Acta A Mol. Biomol. Spectrosc. 98, 307-321
25. Dharamaraj N., Viswanathamurthi P., and Natarajan K. (2001) Ruthenium(II) complexes containing
bidentate Schiff bases and their antifungal activity. Tran. Met. Chem. 26 (1-2) 105–109.
26. Tweedy B.G. (1964) Plant extracts with metal ions as potential antimicrobial agents. Phytopathology
55, 910-914.
27. Takjoo R., Akbari A., Ebrahimipour S.Y., Kubicki M., Mohamadi M., and Mollania N. (2017)
Synthesis, spectral characterization, DFT calculations, antimicrobial activity and molecular docking of
4-bromo-2-((2-hydroxy-5-methylphenylimino)methyl)phenol and its V(V) complex. Inorg. Chim.
Acta 455 (1) 173–182.
28. Sheldrick G. M. (2008) A short history of SHELX. Acta cryst. A 64. 112-122.
29. Sheldrick G. M. (2015) Crystal structure refinement with SHELXL. Acta cryst. C 71 3-8.
© 2018 by the authors; licensee Growing Science, Canada. This is an open access
article distributed under the terms and conditions of the Creative Commons Attribution
(CC-BY) license ( />