Bilateral trade and economic growth of China and India: A comparative study
Bạn đang xem bản rút gọn của tài liệu. Xem và tải ngay bản đầy đủ của tài liệu tại đây (375 KB, 12 trang )
Accounting 2 (2016) 117–128
Contents lists available at GrowingScience
Accounting
homepage: www.GrowingScience.com/ac/ac.html
Bilateral trade and economic growth of China and India: A comparative study
Sibghat Ullah Farooqui*
Department of Commerce, Aligarh Muslim University, Aligarh, Uttar Pradesh, India-202002
CHRONICLE
Article history:
Received October 5, 2015
Received in revised format
December 16 2015
Accepted February 16 2016
Available online
February 16 2016
Keywords:
Bilateral import-export
Terms of trade (TOT)
Total trade
Gross domestic product (GDP)
Trade openness
ABSTRACT
This research paper is an attempt to examine the Bilateral Trade and Economic Growth
between China and India, it also gives attention to draw outcome of trade, economic
cooperation in future. They are the fastest growing economies in Asia as well as in the world.
Both economies are classified by many international agencies as emerging markets with
prospective for rapid economy growth. They play an increasingly dominant role in world
economy affair. Especially, this paper investigates the major trends and changes in the ImportExport, Terms of Trade (TOT), Total Trade, Gross Domestic Product (GDP), and Trade
Openness. By applying various statistical techniques, the results reveal that China has leading
trading partner with India and across the world. The findings are also used to draw policy
implications for future trade and economic co-operation between two Asian developing
economics. The results clearly showed the supremacy of China over India, but India also
elucidates the sign of prominent growing economies in the world.
© 2016 Growing Science Ltd. All rights reserved.
1. Introduction
Trade is an important fuel of economic growth, China and India are two emerging economies of the
world. The growth rates of China and India are estimated at 7.38% 7.17% in 2014, respectively. During
the period 1980-2014, Average growth domestic product (GDP) growth of China was 9.8% compared
with India's 6.23% for the same period. China attains the maximum growth of 15.20% in year 1984 and
minimum 3.80% in 1990. Out of 35 years from 1980 to 2014, China growth by more than 10% in 16
years while India was remained with in only one. India reached an all-time high of 10.26% in 2010 and
a record low of 1.06% in 1991. India's growth rate was 9-10% in 4 years, while China in 7 years. Indian
Rupee was at 10.34 INR per Chinese Yuan (CNY) on 16 December 2015. Value of Indian Rupees has
fallen to 10.18 INR per 1 CNY in 1 Jan 2015.
Bilateral trade between India and China having a potential worth nearly $100 billion in year 2015 has
created huge and unprecedented opportunities for both countries’ business and investors while bringing
about a greater stability in the region. Economic cooperation between India and China during the last
decade has been a remarkable story, from very modest beginning in 2000-01 of $2 billion to $73.90
* Corresponding author.
E-mail address: (S. U. Farooqui)
© 2016 Growing Science Ltd. All rights reserved.
doi: 10.5267/j.ac.2016.2.003
118
billion in 2011. China has become India's largest trade partner and India is China's seventh largest
export destination. India and China while encouraging bilateral trade and investment relations, work
jointly to establish common negotiating strategies in the international forum. Trade deficit between
India and China increased about 34 per cent to USD 48.43 billion in 2014-15 from USD 36.21 billion
in the previous fiscal year. Indian government concern on the rising deficit has been discussed, in order
to boost exports and address the widening trade deficit with China, the government has taken a number
of initiatives to identify specific product lines with export potential, actively taking up issues relating
to tariff and non-tariff barriers in bilateral meetings and institutional dialogues.
The trade gap in India narrowed to USD 9.77 billion in October of 2015, compared to a USD 13.5
billion shortfall, a year earlier. It was the lowest trade deficit since February as exports shrank 17.53
percent on year-to-year basis while imports went down 21.15 percent. From April to October, sales
declined 17.62 percent and purchases decreased 15.17 percent. Balance of Trade in India averaged 2043.65 USD Million from 1957 until 2015, reaching an all-time high of 258.90 USD Million in March
of 1977 and a record low of -20210.90 USD Million in October of 2012. Balance of Trade in India is
reported by the Ministry of Commerce and Industry, India.
India has been recording sustained trade deficits since 1980 mainly due to the high growth of imports,
particularly of crude oil, gold and silver. Export growth has been a major component supporting China's
rapid economic expansion. Exports of goods and services constitute 30% of GDP. China major exports
are: electromechanical products (57 percent of total exports) and labour intensive products like
clothing, textiles, footwear, furniture, plastic products, bags and toys (20 percent). In recent years, the
exports of high tech products have been also growing and in 2012 accounted for 29 percent of total
exports. China’s main export partners are the United States (17 percent), European Union (16 percent),
Asian (10 percent), Japan (7 percent) and South Korea while India Exports in India decreased 17.53
percent year-on-year to 21352.79 USD Million in October of 2015. Exports in India averaged 4426.08
USD Million from 1957 until 2015, reaching an all-time high of 30541.44 USD Million in March of
2013 and a record low of 59.01 USD Million in June of 1958. Exports in India are reported by the
Ministry of Commerce and Industry, India. In recent years, India has become one of the biggest refined
product exporters in Asia with petroleum accounting for around 20 percent of total exports. The country
also exports engineering goods (19 percent of the total shipments), chemical and pharmaceutical
products (14 percent), gems and jewellery (14 percent), agricultural and allied products (10 percent)
and textiles and clothing (10 percent). India’s main export partners are: United Arab Emirates (12.1
percent of the total exports), the United States (12 percent), Singapore (4.5 percent), China (4.5
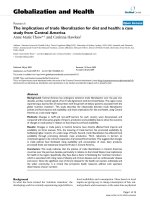
percent), Hong Kong (4 percent) and Netherlands (3.5 percent). Fig. 1 shows the Import of china and
India for the last 33 years. In 1982, the import of china and India were 18900 and 17517.5 US $
(millions) and jumped to 1808720 and 405122 US $ (millions). Fig. 2 shows the comparative export
between India and China during the period 1982 to 2014 in US $ at current prices and current exchange
rates in millions which clearly shows the expanding export of China in the world market as compared
with India. In 1982, China exported 23637 millions US $ (millions) and reached 2243761.3 US $
(millions) in 2014 and comparatively India’s export moved from 12159.03 US $ (millions) to 329633
US Dollar. The terms of trade of China reached at 124.0525 in 2014 which at the highest in 2007 at
135.5943 as compared with India only moved at 81.36635 (see Fig. 3). The GDP of India was worth
2041085 US $ (millions) in 2014. The GDP value of India represents 3.33 percent of the world
economy. The GDP of China reached at 10066674.21 in 2014 which very large as compared with India
(See Fig. 4). The trade openness of China are highly appreciated ruined at 40.25 percent as compared
with India to 35.99 percent which were 14.40 and 14.74 percent in 1982 clearly seems in Fig. 5. The
GDP growth rate also reveals that stability of China growth are more sustain year by year, during 2014
China and India growth rate were 7.4 and 5.4 percent (See Fig. 6), respectively. The Bilateral trade
between India and china in terms of export and import shows that export to china moved from 14.6 to
11966.7 US$ millions and simultaneously import from china expand from 118.9 to 60442.2 US$
millions during 1987 to 2014 See Fig. 7.
119
US Dollars at current prices and
current exchange rates in millions
S. U. Farooqui / Accounting 2 (2016)
LN IMPORT CHINA
LN IMPORT INDIA
Linear (LN IMPORT CHINA)
y = 0.1475x ‐ 282.59
R² = 0.9916
Linear (LN IMPORT INDIA)
y = 0.1106x ‐ 209.72
R² = 0.965
Years
US Dollars at current prices and
current exchange rates in
millions
Fig. 1. The Import of India and China for the period from 1982 to 2014
LN EXPORT CHINA
LN EXPORT INDIA
Linear (LN EXPORT CHINA)
Linear (LN EXPORT INDIA)
y = 0.1563x ‐ 300.07
R² = 0.9939
y = 0.1113x ‐ 211.51
R² = 0.9842
Years
current exchange rates in millions
US Dollars at current prices and
Fig. 2. The Export of India and China for the period from 1982 to 2014
TOT China
TOT India
Linear ( TOT China)
Linear (TOT India)
y = 0.9102x ‐ 1706.4
R² = 0.3313
y = 0.0612x ‐ 45.418
R² = 0.0061
Years
Fig. 3. The Term of Trade (TOT) Import of India and China for the period from 1982 to 2014
120
US Dollars at current prices and
current exchange rates in millions
LN TOTAL TRADE CHINA
LN TOTAL TRADE INDIA
Linear (LN TOTAL TRADE CHINA)
y = 0.152x ‐ 290.74
R² = 0.9944
y = 0.1109x ‐ 209.83
R² = 0.9753
Years
US Dollars at current prices and
current exchange rates in millions
Fig. 4. The Total Trade of India and China for the period from 1982 to 2014
LN GDPChina
LN GDPIndia
Linear (LN GDPChina)
Linear (LN GDPIndia)
y = 0.1163x ‐ 218.37
R² = 0.9633
y = 0.0747x ‐ 136.03
R² = 0.9287
Years
Fig. 5. The Gross Domestic Product (GDP) of India and China for the period from 1982 to 2014
Openness(% China)
Openness(%india)
Linear (Openness(% China))
Linear (Openness(%india))
US $ million
y = 1.1344x ‐ 2229.4
R² = 0.6912
y = 0.8536x ‐ 1680.6
R² = 0.9407
Years
Fig. 6. The Trade Openness of India and China for the period from 1982 to 2014
121
GDP Growth Rate(%)
The annual average growth rate of GDP
is derived on the basis of constant price
series in national currency.
S. U. Farooqui / Accounting 2 (2016)
China (Annual average growth rate)
India (Annual average growth rate)
Linear (China (Annual average growth rate))
y = ‐0.0513x + 112.5
R² = 0.0348
y = 0.0645x ‐ 122.63
R² = 0.0763
Years
Fig. 7. The Gross Domestic Product (Growth Rate %) of India and China for the period from 1982 to
2014
Bilateral LNEXPORT
Bilateral LNIMPORT
Linear (Bilateral LNEXPORT)
Linear (Bilateral LNIMPORT)
(US $ million)
y = 0.2966x + 3.3998
R² = 0.9412
y = 0.2657x + 3.1397
R² = 0.9325
Years
Fig. 8. The Export to china and Import from china for the period from 1982 to 2014
2. Review of Literature
Jinping (2003) measured revealed comparative advantage (RCA) of various industries in China and
other East Asian Economies over the period of 1980-1997, and measured the trade complementarities
between China and other East Asian economies for the same period. The empirical results showed that
China had not had RCA in machinery compared with Japan, Taiwan, South Korea and Singapore.
China's imports are complementary to the exports of Taiwan, South Korea, Indonesia, Malaysia and
Thailand, while the complementarities between China's exports and the imports of these economies are
not obvious. Singh (2005) investigated that booming bilateral trade has come to be the strongest pillar
of China-India rapprochement. This is not only since overtaken the pace of political confidencebuilding but also has a substantial impact on their mutual perceptions. The boom in trade has also
introduced new trends. The two states are no longer only recipients on foreign direct investment but
have entered into a new phase of being investors, both mutually as in other regions. In this new context,
122
the increasing deficit in the energy sector and the competition to capture new markets present major
challenges to sustaining this boom in their bilateral trade. Rajan (2005) explained in his study that the
Global environment was characterized by an intense Global Race for FDI. Hence, Alternatively,
intervention must concentrated on refining the host country’s overall abilities to gain from FDI by
contributing the quality of the employee and infrastructure in a country, contribute to local skills,
technology and domestic learning, and trying to reach a stable and conducive overall macroeconomic
conditions. Mohanty and Chaturvedi (2005) examined that China and India had emerged as highly
dynamic economies during the last few years. In Asia, their growth and economic expansion has
generated its own complementarities. The paper has empirically revealed that surge in the exports of
these two countries have significantly contributed to their overall economic growth. India and China
have made steady progress in frontier technologies such as ICT and biotechnology, and provide easy
access towards technologies to LDCs and other developing countries. Kapur (2005) observed that the
economic reforms of 1991 opened the Indian economy for foreign players. For FDIs, India has now
become burning destination because of its vast potential. The Indian investment setting is constantly
changing and the country has become the third most preferred destination for investors after China and
US. Desai (2005) studied that the contrast between the economic performance of China and India and
its proximate causes. But there were also a lot of similarities between two countries in the path to
modernization and the future prospects for their economies. There have been also political similarities
and contrasts between the two in terms of their 20th century histories and 21st century challenges. The
study argued that India remains a soft state, a consensual polity, and not capable of sustained growth at
the sort of rates which China had attained. Batra and Khan (2005) in their paper revealed comparative
advantage had analyzed at both the two and six digit level of HS classification for both India and China.
The analysis reveals that the pattern of comparative advantage varies at different levels of commodity
disaggregation. Sectors that rank among the top ten according to the value of the index of RCA are not
necessarily capable of keeping their positions. For China, other made textiles, sets, worn clothing is so
positioned. Concurrently, some sectors where either of the countries may be disadvantageously placed
at the combined level but may enjoy comparative advantage at the ingredient commodity level. Wu and
Zhou (2006) studied bilateral trade between China and India and examined and compared international
trade and between the two economies and drew implications for trade and economic cooperation
between China and India in the future. The study investigated the major trends of changes in the
bilateral trade between the two countries, and explored issues associated with trade intensity, intraindustry trade and comparative advantages in the two countries. Chakraborty and Nunnenkamp
(2006) assessed the economic growth implications of FDI in India. It was found that the growth effects
of FDI varied widely across sectors. FDI stocks and output were mutually reinforcing in the
manufacturing sector. Most strikingly, they found only transitory effects of FDI on output in the service
sector, which engrossed the level of FDI in the post-reform era. Subhajit (2008) tried to shape up the
possible effects on a free trade agreement between these trading giants, in addition to a general
overview of how trading relation had gone in the last decades and tried to magnify into the fact that
whether the proposed FTA agreement between India and China could lead to any welfare gains for
India or not. Pillania (2010) illustrated that India and China are among the oldest civilizations of the
world with extensive interaction and relationship. They are the fastest growing economies among the
major economies of the world. Both have made rapid progress after liberalisation. One of the major
events in international trade and economics is the recent fast growth in the bilateral trade. He mentioned
that India emerged as one of the top ten trading partners of China. The bilateral trade enhanced the
further trade and have significant impacts on worldwide trade and economy. Sahoo (2013) examined
the performance of China, in which exports industries enjoys comparative advantage, including textiles
and textile articles, chemical products, machinery, mechanical appliances, footwear, headwear, hides
and skins, whereas India is losing market share. However, India is the leading exporter of essential and
basic commodities to its neighbouring countries. China’s policy for trade was also encouraging for
South Asian countries, such as inviting traders to China for exhibitions, assurance of the provision of
advanced technology and willingness to build capacity, training local people, facilitating trade,
investing in crucial industries, and assisting local projects, particularly in infrastructure. Dutt and
S. U. Farooqui / Accounting 2 (2016)
123
According to Panwar (2014) India and China were the two largest countries in the world in terms of
population, both are also the fastest growing economies in the world. Booming trade relations between
India and China are of at the starting point, more or less matched with the onset of contented levels of
economic development in both countries. India and China jointly are home to the world’s largest pools
of skilful human resources, and there is a general accord that these two countries will continue to be
the devices of global economic growth in the 21st century. Increasing bilateral trade has come to be the
strongest pillar of China-India rapprochement. Kumari and Malhotra (2014) studied that the trade-led
growth theory has received considerable attention over the time period with large amount of literature
devoted to analyse it empirically particularly in case of exported growth hypothesis. The study
concludes that China performed better than India. The difference in performance between India and
China was not simply because of timings of changes in policies but the speed of reforms,
implementation of policies and nature of political governance also mattered. Chellasamy and Menon
(2015) analyzed the impact of foreign trade on GDP of India using annual data during period (from
2004 to 2014). The analysis revealed that there was a significant impact of foreign trade on GDP.
Import contributes positively GDP while, Export input were unenthusiastic.
3. Research gap
The review of literature reveals that numerous studies have been conducted to assess Trade relation
between India and China. Moreover, several research articles have raised the significant issues with
regard to FDI and growth as well. Most of the prior studies that had discussed the relation between
India and China were theoretical in nature. There are few empirical evidences available that have
investigated the trade relation between these two countries on the bases of single trade indices (Export,
Import, FDI, GDP, RCA etc.) or adequately explored. Therefore, this study makes an earnest attempt
to fill the gap by incorporating macro-economic variables and Trade related indices. However, this
study goes a step further to examine the impact of bilateral trade flows between India and China.
3.1. Objectives
To study the overall Export and Import of India and China,
To evaluate the Terms of Trade (TOT),Total Trade, Gross Domestic Product (GDP), Trade
Openness (%) of India and China,
To study the GDP (Growth Rate) of India and China,
To examine the Bilateral Trade between India and China in terms of Export and Import.
3.2. Hypotheses
H01 (Null Hypothesis) = There is no significant difference between the Import of India and China.
H02 (Null Hypothesis) = There is no significant difference between the Export of India and China.
H03 (Null Hypothesis) = There is no significant difference between the Terms of Trade (TOT) of India
and China.
H04 (Null Hypothesis) = There is no significant difference between the Total Trade of India and China.
H05 (Null Hypothesis) = There is no significant difference between the Gross Domestic Product (GDP)
of India and China.
H06 (Null Hypothesis) = There is no significant difference between the Trade Openness (%) of India
and China.
H07 (Null Hypothesis) = There is no significant difference between the GDP (Growth Rate) of India
and China.
H08 (Null Hypothesis) = There is no significant difference between Export to China and Import from
China.
3.3. Research methodology
To accomplish the aforementioned objectives secondary data were collected from various sources such
as periodicals, journals, relevant books, research papers, published theses, articles, news dailies and
124
different websites for better referencing. The publications and review bulletins of regulatory bodies and
institutions, such as RBI, World Bank, UNCTAD, annual reports and handbook of statistics on Indian
economy, Department of Industrial Policy and Promotion (DIPP), SIA newsletter, Fact sheets, books
and journals etc. for the purpose of analyzing the data Independent t-test and f-test are undertaken.
3.4. Analysis and interpretation
H01 (Null Hypothesis) = There is no significant difference between the Import of India and China.
This hypothesis deals with the difference between the Import of India and China. The analysis given in
Table 1 and Table 2 explained that the Levene’s test for equality of variances indicates variances for
the Import of India and China did not differ significantly from each other (P-value=.053). Therefore
equal variance results are used for t-test. The mean for the Import of India is 11.1616 and the mean for
the Import of china is 12.1953 which show significant difference between both the countries. The
standard deviation for India and China are 1.08824 and 1.43270, respectively. The mean did differ
significantly with t-value 3.301 and also the P-value is 0.002 which is less than 0.05 and leads to
rejection of Null Hypothesis. Hence, there is a significant difference between the Import of India and
China.
H02 (Null Hypothesis) = There is no significant difference between the Export of India and China.
Table 1 indicates that thirty three years of Export had a mean of 10.8946 for the India, The thirty three
years of Export had a mean of 12.2991 for the China, but the standard deviation for the India is 1.08494
and for the China 1.51641 and the mean did differ significantly with t- value 4.327 (Table 2). The sigvalue (2-tailed) is 0.000 and this value is less than 0.05 which leads to the conclusion that the difference
is statistically significant. Levene’s test for equality of variances indicates variances for India and China
Export do differ significantly from each other (P-value=.027). Therefore unequal variance results are
used for t-test. Therefore, the Null Hypothesis is rejected. Hence there is a ignificance difference
between Export of India and China. The result of the analysis clarified that Export of China has
significantly increased.
H03 (Null Hypothesis) = There is no significant difference between the Terms of Trade (TOT) of India
and China.
Table 1 and Table 2 indicate the result of third hypothesis that examines the difference between the
Terms of Trade (TOT) of India and China. The mean for the India is 76.9225 and the mean for the
China is 112.0623 which are very high. The descriptive statistics also show the standard deviation
between the Terms of Trade (TOT) of India and China. The standard deviation for the India is 7.58734
and for the China is 15.29125. The t-value is 11.825 and had the P-value is 0.000 which is less than
0.05 and leads to statistically significant. Levene’s test for equality of variances indicates variances for
India and China Terms of Trade (TOT) do differ significantly from each other (P-value=.000).
Therefore, unequal variance results are more powerful for t-test. Therefore Null Hypothesis is rejected.
Hence, it is concluded that there is significant difference between the Terms of Trade (TOT) of India
and China.
H04 (Null Hypothesis) = There is no significant difference between the Total Trade of India and China.
Table 1and Table 2 illustrate the results of this hypothesis that examines the difference between the
Total Trade of India and China. Levene’s test for equality of variances indicates variances for the Total
Trade of India and China did differ significantly from each other (P-value=.037). Therefore unequal
variance results are used for t-test. The mean for the India‘s Total Trade is 11.7312 and for the China
had 12.9444 and the standard deviation for the India and China is (1.08577 V/s 1.47382) and t-value is
3.807. The p- value is at 0.000 which is less than 0.05 indicates that the mean did significantly differ
S. U. Farooqui / Accounting 2 (2016)
125
statistically. The Null Hypothesis is rejected. Hence, there is significant difference between the Total
Trade of India and China.
H05 (Null Hypothesis) = There is no significant difference between the Gross Domestic Product (GDP)
of India and China.
Table 1 and Table 2 show the difference between the GDP of India and China. In description statistics
the mean for the India is 13.1806 and for the China is 14.0061. The thirty three years of data are used
for the analysis. Levene’s test for equality of variances indicates variances for India and China Gross
Domestic Product (GDP) do differ significantly from each other (P-value=.012). Therefore, equal
variance results are used for t-test. The t-value is 3.464 and p-value is 0.001. Since this value is less
than 0.05 which indicates the mean of GDP significantly differs statistically, which lead to Rejection
of Null Hypothesis. Hence, there is significant difference between the Gross Domestic Product (GDP)
of India and China.
H06 (Null Hypothesis) = There is no significant difference between the Trade Openness (%) of India
and China.
Table 1 and Table 2 give an insight of statistical analysis of India and China Trade Openness. Levene’s
test for equality of variances indicates variances for India and China Trade Openness did differ
significantly from each other (P-value=.024). Therefore unequal variance results are used for t-test.
Descriptive statistics revealed that the mean for the India is 24.9435 and the mean for the China is
37.1438 with standard deviation for the India is 8.51050 and for the China 13.19367 and the mean did
differ significantly at the t-value 4.464 and also shows the p-value is 0.000. This value is less 0.05.
Because of this, it can be conclude that there is a statistically significant difference between the Trade
Openness (%) of India and China, which leads to rejection of Null Hypothesis. Hence there is
significant difference between the Trade Openness (%) of India and China.
H07 (Null Hypothesis) = There is no significant difference between the GDP (Growth Rate) of India
and China.
This hypothesis examined the differences between GDP (Growth Rate) of India and China. Table 1 and
2 explained the results. The mean for the India is 6.2277 and for the China is 9.9922 which is high. The
standard deviation for the India is 2.25726 and the mean for the China is 2.65935. Levene’s test for
equality of variances indicates variances for India and China GDP growth rate do not differ significantly
from each other (P-value =.689). Therefore equal variance results are more powerful for t-test.
The Independent samples analysis gives the t-statistic is 6.200 and p-value is 0.000 which is less than
0.05 and leads to conclusion that the difference is statistically significant. The Null hypothesis is
rejected. The performances of China in terms of GDP growth rate are much more growing as compared
to India. Hence, there is significant difference between the GDP (Growth Rate) of India and China.
H08 (Null Hypothesis) = There is no significant difference between Export to China and Import from
China.
The results of analysis explored in Table 3, where twenty eight years of data of Bilateral Export-Import
are undertaken. The mean for the India’s Export to China is 6.9929 and for the India’s Import from
China is 7.6964. The Standard deviation for the India’s Export to China is 2.25387 and for the India’s
Import from China are 2.52080. Levene’s test for equality of variances indicates variances for Export
to China and Import from China did not differ significantly from each other (P-value=.568). Therefore
equal variance results are used for t-test. Table 4 shows that the t-test is further undertaken which gives
the t-value -1.101 and sig-value (2-tailed) is 0.276 which is more than 0.05 therefore it is statistically
126
insignificant and leads to acceptance of Null Hypothesis. Hence there is no significance difference
between Export to China and Import from China.
Table 1
Exhibits the Descriptive Statistics of Comparison of Import, Export Terms of trade, Total Trade, GDP,
Openness Percent, GDP growth rate of India and China
N
Mean
Std. Deviation
Std. Error
Mean
LN IMPORT
GROUP
CHINA INDIA
33
33
12.1953 11.1616
1.43270 1.08824
.24940 .18944
LN EXPORT
GROUP
CHINA INDIA
33
33
12.2991 10.8946
1.51641 1.08494
.26397 .18886
TOT
GROUP
CHINA INDIA
33
33
112.0623 76.9225
15.29125 7.58734
2.66187 1.32079
LN TOTAL
TRADE
GROUP
CHINA
INDIA
33
33
12.9444 11.7312
1.47382 1.08577
.25656
.18901
LN GDP
GROUP
CHINA INDIA
33
33
14.0061 13.1806
1.14584 .74934
.19946 .13044
OPENNESS
PERCENT
GROUP
CHINA
INDIA
33
33
37.1438
24.9435
13.19367
8.51050
2.29672
1.48149
GDP GROWTH
RATE
GROUP
CHINA
INDIA
33
33
9.9922
6.2277
2.65935
2.25726
.46293
.39294
Table 2
The results of F and t-statistics of comparison of Import, Export Terms of trade, Total Trade, GDP,
Openness Percent, GDP growth rate of India and China
Levene's Test for
Equality of
Variances
LN IMPORT
Equal
variances
assumed
Equal
variances not
assumed
LN EXPORT
Equal
variances
assumed
Equal
variances not
assumed
TOT
Equal
variances
assumed
Equal
variances not
assumed
LN TOTAL
Equal
TRADE
variances
assumed
Equal
variances not
assumed
LN GDP
Equal
variances
assumed
Equal
variances not
assumed
Openness
Equal
Percent
variances
assumed
Equal
variances not
assumed
GDP
Equal
GROWTH
variances
RATE
assumed
Equal
variances not
assumed
F
3.896
5.148
7.827
4.547
6.746
5.325
.224
Sig.
.053
.027
.007
.037
.012
.024
.638
t-test for Equality of Means
Sig. (2Mean
Std. Error
tailed) Difference
Difference
.002
1.03374
.31319
95% Confidence Interval
of the Difference
Lower
Upper
.40807
1.65940
t
3.301
df
64
3.301
59.703 .002
1.03374
.31319
.40720
1.66027
4.327
64
.000
1.40446
.32458
.75604
2.05288
4.327
57.959 .000
1.40446
.32458
.75474
2.05419
.000
35.13984
2.97153
29.20352
41.07615
11.825 46.856 .000
35.13984
2.97153
29.16140
41.11827
3.807
64
.000
1.21313
.31866
.57653
1.84974
3.807
58.832 .000
1.21313
.31866
.57545
1.85082
3.464
64
.001
.82549
.23833
.34937
1.30161
3.464
55.139 .001
.82549
.23833
.34789
1.30309
4.464
64
.000
12.20032
2.73308
6.74036
17.66028
4.464
54.699 .000
12.20032
2.73308
6.72242
17.67822
6.200
64
.000
3.76448
.60721
2.55143
4.97753
6.200
62.354 .000
3.76448
.60721
2.55081
4.97815
11.825 64
127
S. U. Farooqui / Accounting 2 (2016)
Table 3
Descriptive statistics of comparison of bilateral Export-Import of India to China
LN BILATERAL EXPORT-IMPORT
GROUP2
EXPORT TO CHINA
IMPORT FROM CHINA
28
28
6.9929
7.6964
2.25387
2.52080
.42594
.47639
N
Mean
Std. Deviation
Std. Error Mean
Table 4
Reveals the F and t-statistics of comparison of bilateral Export-Import of India to China
Levene's Test for
Equality of
Variances
LN BILATERAL
EXPORTIMPORT
Equal
variances
assumed
Equal
variances not
assumed
F
.330
Sig.
.568
t-test for Equality of Means
t
1.101
df
54
Sig. (2tailed)
.276
53.337 .276
1.101
Mean
Std. Error
Difference Difference
-.70357
.63904
95% Confidence
Interval of the
Difference
Lower
Upper
-1.98477
.57762
-.70357
-1.98513
.63904
.57799
4. Conclusion
This empirical study have shown that bilateral trade between India and china were significant for
economic growth of both countries. The results reveal that trade between china and India has significant
difference in terms of Import, Export, Term of Trade, Total trade, GDP trade openness and GDP growth
rate. China has far away from India and opened all roads for the business. The TOT results also have
shown that china was getting more capital from its export and more influence of trade on domestic
activities and makes country stronger as compared to India.
The Bilateral trade between India and china did not show significant difference, but clearly exhibit that
china was more focussed on export to India. The bilateral trade between these two countries was
unfavourable to India and also balance of trade was unfavourable to India. The study have concluded
that China performed better compared with India. The difference in performance between India and
China is not simply because of timing of changes in policies but the speed of reforms, implementation
of policies and nature of political governance also mattered.
References
Batra, A., & Khan, Z. (2005). Revealed comparative advantage: An analysis for India and China. Indian
Council for Research on International Economic Relations, Working Paper, 168, 1-85.
Chakraborty, C., & Nunnenkamp, P. (2006). Economic reforms, foreign direct investment and its
economic effects in India (No. 1272). Kieler Arbeitspapiere.
Chellasamy, P., & Menon, A. A. (2015). Impact of foreign trade on Indian economic growth-with
respect to Gross Domestic Product (GDP). ZENITH International Journal of Business Economics
& Management Research, 5(2), 67-72.
Desai, M. (2005). India and China: an essay in comparative political economy. In India’s and China’s
Recent Experience with Reform and Growth(pp. 1-22). Palgrave Macmillan UK.
Dutt, M. S., & Panwar, (2014). An analysis of Indo-China trade trends (past & projected) in the postliberalisation era.
128
Jinping, Y. (2003). Comparative Advantage and Trade Complementarity between China and Other
Asian Economies[J]. World Economy, 5, 33-40.
Kapur, S. (2005). FDI in India: recent Trends and Prospect, Treasury Management, the ICFAI
University Press, August.
Kumari, D., & Malhotra, (2014) N. Trade-Led Growth in India and China: A Comparative Analysis.
Mohanty, S. K., & Chaturvedi, S. (2005). Emergence of China and India in the New Millennium: Will
it Facilitate Market Access for LDCs and Developing Countries? (No. 22120).
Pillania, R. K. (2010). Indo-China Trade: trends, Composition and Future.Journal of Applied
Economic Sciences, 5(2 (12)/Summer2010), 129-137.
Rajan, R. S (2005) “Foreign Direct Investment and the Internationalization of Production in the Asia
Pacific Region Issues and Policy Conundrums”, Asia Pacific Trade and Investment Review,
1stApril.
Sahoo, P. (2013). The Growing Dominance of China in South Asia: An Indian Perspective. The
International Trade Journal, 27(2), 111-141.
Singh, S. (2005). China-India Bilateral Trade:. Strong Fundamentals, Bright Future. China
Perspectives, (62).
Subhajit, S. (2008). Effects of Free Trade Agreement on Indo-China Trade.Available at SSRN
1152134.
Wu, Y., & Zhou, Z. (2006). Changing bilateral trade between China and India
Websites
India and china GDP’, retrieved from />‘India and china trade centre’, retrieved from />‘India-China trade deficit swells 34% to $48 billion’, retrieved from
/>‘Balance of Trade’, retrieved from />