Measuring the relative efficiency of banks using DEA method
Bạn đang xem bản rút gọn của tài liệu. Xem và tải ngay bản đầy đủ của tài liệu tại đây (625.27 KB, 6 trang )
Accounting 3 (2017) 221–226
Contents lists available at GrowingScience
Accounting
homepage: www.GrowingScience.com/ac/ac.html
Measuring the relative efficiency of banks using DEA method
Mohammad Reza Ghaelia*
a
Faculty of Computer Studies and Information Systems, Douglas College, New Westminster, Canada
CHRONICLE
Article history:
Received September 5, 2016
Received in revised format
November 11 2016
Accepted January 20 2016
Available online
January 23 2017
Keywords:
Data envelopment analysis
(DEA)
Efficiency
Bank Industry
ABSTRACT
Data Envelopment Analysis (DEA) is one of the most popular methods used for measuring the
relative efficiency of similar units by considering various input/output parameters. This paper
implements DEA models to estimate the relative efficiency of selected banks in the United
States. The proposed study uses two inputs, total assets and number of employees, and one
output, net revenue for measuring the relative efficiency of selected banks. The relative
efficiencies of different banks are analyzed. The preliminary results indicate that Santander
Bank is the most efficient banks operating in the United States followed by SunTrust Bank and
HSBC. Other banks preserve lower efficiency compared with these three banks.
© 2017 Growing Science Ltd. All rights reserved.
1. Introduction
Measuring the relative efficiency of banks is one of the primary concerns for making any investment
decisions. Data envelopment analysis (DEA) is one of the most efficient techniques for measuring the
relative efficiency of similar units; e.g. banks, insurance firms, etc. (Fallah et al., 2011). The benefit of
applying DEA is that one may apply the non-financial factors such as the number of employees along
with the financial data to have a fair comparison of various units. DEA is one of the methods to use for
such purpose. During the past several years, there has been substantial interest on applying DEA
techniques for calculating the relative efficiency of banks around the world (Haslem et al., 1999;
Mercan et al., 2003). Yang et al. (2010) applied an integrated bank performance measurement and
management planning using hybrid minimax reference point – DEA approach.
Staub et al. (2010) investigated various factors influencing the relative efficiency of Brazilian banks
such as cost and technical efficiencies from 2000 to 2007. They stated that Brazilian banks influenced
from low levels of efficiency compared with European or North American ones. They also stated that
state-owned banks were substantially more cost efficient than other alternative foreign banks.
Nevertheless, they did not report any evidence to show that the differences in economic efficiency were
* Corresponding author.
E-mail address: (M. R. Ghaeli)
© 2017 Growing Science Ltd. All rights reserved.
doi: 10.5267/j.ac.2017.1.004
222
because of the type of activity and bank size. Avkiran (2010) investigated the relationship between the
supper-efficiency estimations and some other key financial ratios for some Chinese banking sector.
They provided some opportunity to determine the inefficient units where there was a low cooperation
between the supper-efficiency and good financial ratios. Lin et al. (2009) executed various DEA
techniques for 117 branches of a certain banks in Taiwan and stated an overall efficiency of 54.8 percent
for all units. They also showed that most branches were relatively inefficient. Thoraneenitiyan and
Avkiran (2009) investigated the implementation of a combined DEA and SFA to measure the effect of
restructuring and country-specific factors on the efficiency of post-crisis East Asian banking systems
over the period 1997-2001. They stated that banking system inefficiencies were primarily attributed to
country-specific circumstances, such as high interest rates, concentrated markets and economic
development. DEA was also implemented for banking decisions. For example, Che et al. (2010) applied
a combination of Fuzzy analytical hierarchy procedure (AHP) and DEA as a decision making facility
for making decisions on loan assignments.
This paper is organized as follows. We first provide the problem statement of DEA method in section
2. Section 3 gives an in-depth discussion of various DEA models for input and output estimation
together with efficiency improvement and mathematical calculation methods. We provide the
implementation of the DEA approach for banking sector in section 4. Finally, concluding remarks are
given in the last section to summarize the contribution of the paper.
2. Data Envelopment Analysis
The constant return to scale DEA (CCR) was first proposed by Charnes, et al. (1978, 1994) as a
mathematical technique for measuring the relative efficiency of decision making units (DMU). One
may easily learn how a given DMU works whenever a production function becomes available.
Nevertheless, in some cases reaching an analytical form for this function may not be possible. Thus,
we form a set of production feasibility, which consists of some principles such as fixed-scale efficiency,
convexity and feasibility as follows,
n
n
TC ( X , Y ) X j X j , Y j Y j , j 0, j 1, n ,
j 1
j 1
(1)
where X and Y represent the input/output vectors, respectively. The CCR production feasibility set
border describes the relative efficiency in which any off-border DMU is stated as inefficient. The CCR
model can be measured in two types of either input or output oriented. The input CCR plans to decrease
the maximum input level with a ratio of so that, at least, the same output is generated, i.e.:
subject to
min
n
X p j X ij 0,
j 1
(2)
n
j Yrj Yrp ,
j 1
j 0,
j 1,, n.
Model (2) is called envelopment form of input CCR where is the relative efficiency of the DMU and
it is an easy assignment to show that the optimal value of , *, is always between zero and one (Fallah
et al., 2011). For the input oriented DEA one, once the efficiency of a DMU unit, DMU p , reduces in
case of inefficiency, one may directs it towards the border to make it efficient. In the case of the output
oriented DEA model, the primary objective is to maximize the output level, , by applying the same
amount of input (Fallah et al., 2011). The model can be formulated as follows,
M. R. Ghaeli / Accounting 3 (2017)
subject to
223
min
n
j X ij X ip ,
(3)
j 1
n
jY j Yip ,
j 1
j 1,, n.
j 0,
3. DEA Models for Estimating and Improving Inputs and Outputs
3.1 Output estimation
Consider n various DMUs as {DMUj : j=1,...,n} using m inputs to generate s outputs. Let y ri and xij
be the rth output, r (1,, s ) and the ith input, i (1, m) of the jth DMU, j (1, n), respectively
(Fallah et al., 2011). Consider * as the efficiency level of the DMUp where it has a value of one or
higher, i.e. the measured unit is either efficient or inefficient (Fallah et al., 2011). Suppose that we
increase the inputs of DMUp from xp to ip xip xip where x p 0 and x p 0 and we wish to
learn how much output DMUp could be produced. That is we wish to estimate the output vector
y rp ( new) ( y1 p ( new) , y2 p ( new) ,... y sp ( new) ) , where we present them as rp ( 1 p , 2 p ,... sp), for the sake of the
simplicity. We also look at two conditions for the problem statement. First, we assume that as the inputs
increase, * remains unchanged and second, as the inputs increase the efficiency will also increase too.
If efficiency increase is not the target and the efficiency of DMUp remains at * , the outputs of the
measured unit can be calculated by solving the following (Fallah et al., 2011),
max
p ( 1 p ,, sp )
subject to
n
∑
j 1
j X ij ip
(4)
n
j Yrj *p p
j 1
p Yp
j 0
j 1...n.
Model (4) is a multi-purpose problem to solve where we assign weights ( w p ) to each output ( yip )
based on a multiple criteria decision making methods such as AHP. Let
s
rp ( 1 p , 2 p ,... sp ) wr rp . Therefore,
r 1
max
s
p ( 1 p ,, sp ) wr rp
r 1
subject to
n
∑
j 1
j X ij ip
n
j Yrj *p p
j 1
p Yp
j 0
j 1...n.
(5)
224
Let x p be the increase on the inputs of unit p and be the percentage of the increase on * . In order
to reach the output for unit p we replace * with (1 ) * in (5) which gives,
100
max
s
p ( 1 p ,, sp ) wr rp
r 1
subject to
n
∑
j 1
j X ij ip ,
j Yrj (1 / 100) p p ,
(6)
n
j 1
p Yp ,
j 0
j 1...n.
3.2 Input estimation
Let * be the optimal efficiency value of the DMU measured by model (2) and we wish to increase
the production of DMUp by y p 0 , that is y rp ( new) rp y rp y rp . Assuming a constant efficiency
of the measured DMU we can estimate the inputs of the unit p with similar method stated in the previous
section. Let xip ( new) ( x1 p ( new) , x2 p ( new) ,...x mp ( new) ) ip (1 p , 2 p ,... mp ) and to simplify the solution of the
m
multi-purpose function, one could rewrite the target function as ip (1 p , 2 p ,... mp ) wi ip and
i 1
solve the following model (Fallah et al., 2011),
m
min ip ( 1 p , 2 p ,... mp ) wi ip
i 1
subject to
n
∑
j 1
j X ij * ip
n
j Yrj rp
i 1...m
(7)
r 1...s
j 1
ip xip
j 0
j 1...n.
Let be the percentage increase in efficiency of * resulted when the outputs are increased. Let * is
replaced with
(1
100
) *
. Therefore, we have,
m
min ip ( 1 p , 2 p ,... mp ) wi ip
i 1
subject to
n
∑
j 1
j X ij (1 / 100) * ip
n
j Yrj rp
r 1...s
j 1
ip xip
j 0
j 1...n.
i 1...m
(8)
M. R. Ghaeli / Accounting 3 (2017)
225
Nevertheless, if the amount of efficiency increase is not given and the measured organization needs
such increase as a precondition for increase in the outputs, then the input estimation of model (7) will
be changed to model (8) where * is an additional condition.
4. Analysis and Results
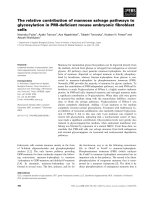
In this section, we present the details of our DEA implementation for measuring the relative efficiency
of selected banks operating in the United States. The data for the input and the output are collected for
the fiscal year of 2016. The study uses two inputs and one output shown in Fig. 1.
Total assets
DMU
Number of
Employees
(Banks)
Net Revenue
Fig. 1. The input and the output of DEA model
The input data for all 26 units are summarized in Table 1 where the second column represents total
assets, the third column shows the number of employees, the fourth column represents the net revenue
and finally, and finally the relative efficiency of all units are given in the last column.
Table 1
The results of the implementation of DEA method
Name
Santander Bank
SunTrust Bank
HSBC
American Express
TD Bank
Ally Financial
U.S. Bancorp
Goldman Sachs
BMO Harris Bank
Wells Fargo
Fifth Third Bank
Capital One
PNC Bank
JPMorgan Chase
Citigroup
BB&T
M&T Bank
Bank of New York
Regions Bank
Morgan Stanley
Northern Trust
Charles Schwab
State Street
Bank of America
Citizens Bank
RBC Bank
Inputs
Total Assets (Billions)
Number of Employee
$126
9,525
$198
24,00
$295
266,273
$159
54,000
$276
85,000
$157
7,100
$438
67,000
$896
34,800
$132
14,500
$1,889
264,700
$143
21,613
$339
45,400
$361
52,500
$2,466
246,303
$1,818
239,000
$221
39,000
$123
16,331
$372
51,200
$126
23,000
$828
55,802
$121
16,500
$198
14,000
$255
33,332
$2,186
210,516
$145
17,852
$151
72,839
Output
Net revenue (Millions)
7,967
1,933
15,096
5,163
6,133
1,289
5,879
6,083
1,712
22,894
1,712
4,050
4,106
24,442
17,242
2,084
1,065
3,158
1,062
6,127
973.8
1447
1,980
15,888
840
143
Efficiency
1
0.962921
0.809311
0.513548
0.351431
0.217053
0.212278
0.208982
0.205119
0.191675
0.189341
0.188943
0.179882
0.156754
0.149993
0.149136
0.136937
0.13426
0.1333
0.131271
0.12728
0.123569
0.122801
0.114946
9.16E-02
1.50E-02
226
As we can observe from the results of Table 1, Santander Bank is the most efficient banks operating in
the United States followed by SunTrust Bank and HSBC. Other banks preserve lower efficiency
compared with these three banks. These banks may reduce the number of their employees or reduce
their physical equipment to increase their efficiencies.
4. Conclusion
In this paper, we have presented an empirical investigation to measure the relative efficiency of some
selected banks in the United States using a well-known method named data envelopment analysis. The
proposed study has considered the banks’ employees and equipment as input and net revenue as the
output. The results have indicated that most banks in United States have performed poorly and must
reduce their employees or make some changes on their physical equipment.
Acknowledgement
The authors would like to thanks the anonymous referees for constructive comments on earlier version
of this paper.
References
Charnes A, Cooper, W. W., Rhodes, E. (1978). Measuring the efficiency of decision making units.
European Journal of the Operational Research, 2, 429–44.
Charnes A, Cooper W. W., Lewin, A., Seiford, L. M. (1994). Data envelopment analysis: theory,
methodology and applications. Massachusetts: Kluwer Academic Publishers.
Fallah, M., Aryanechad, M.B., Najafi, S.E., & Shahsavaripour, N. (2011). An empirical study on
measuring the relative efficiency using DEA method: A case study of bank industry. Management
Science Letters, 1(1), 49-56.
Staub, R. B., Da Silva e Souza, G. & Tabak, B. M. (2010). Evolution of bank efficiency in Brazil: A
DEA approach. European Journal of Operational Research, 202(1), 204-213.
Avkiran, N. K. (2010). Association of DEA super-efficiency estimates with financial ratios:
Investingating the case for Chinese banks. Omega, doi:10.1016/j.omega.2010.08.001.
Lin, T. T., Lee, Ch-Ch., & Chiu, T-F. (2009). Application of DEA in analyzing a bank's operating
performance. Expert Systems with Applications, 36(5), 8883-8891.
Yang, J.B., Wong, B.Y.H., Xu, D.L., Liu, X.B. & Steuer, R.E. (2010). Integrated bank performance
assessment and management planning using hybrid minimax reference point – DEA approach.
European Journal of Operational Research, doi:10.1016/j.ejor.2010.07.001.
Thoraneenitiyan, N., & Avkiran, N. K. (2009). Measuring the impact of restructuring and countryspecific factors on the efficiency of post-crisis East Asian banking systems: Integrating DEA with
SFA. Socio-Economic Planning Sciences, 43(4), 240-252.
Che, Z. H., Wang, H. S., & Chuang, Ch-L. (2010). A fuzzy AHP and DEA approach for making bank
loan decisions for small and medium enterprises in Taiwan, Expert Systems with Applications,
37(10), 7189-7199.
Mercan, M., Reisman, A., Yolalan, R., & Burak Emel, A. (2003). The effect of scale and mode of
ownership on the financial performance of the Turkish banking sector: results of a DEA-based
analysis, Socio-Economic Planning Sciences, 37(3), 185-202.
Haslem, J. A., Scheraga, C. A., & Bedingfield, J. P. (1999). DEA efficiency profiles of U.S. banks
operating internationally. International Review of Economics & Finance, 8(2), 165-182.
© 2017 by the authors; licensee Growing Science, Canada. This is an open access
article distributed under the terms and conditions of the Creative Commons Attribution
(CC-BY) license ( />