Impact of projected climate change on summer Mungbean in Gujarat, India
Bạn đang xem bản rút gọn của tài liệu. Xem và tải ngay bản đầy đủ của tài liệu tại đây (290.23 KB, 12 trang )
Int.J.Curr.Microbiol.App.Sci (2018) 7(8): 4178-4189
International Journal of Current Microbiology and Applied Sciences
ISSN: 2319-7706 Volume 7 Number 08 (2018)
Journal homepage:
Original Research Article
/>
Impact of Projected Climate Change on Summer Mungbean in Gujarat, India
B.I. Karande, H.R. Patel, S.B. Yadav*, M.J. Vasani and D.D. Patil
Department of Agricultural Meteorology, B.A. College of Agriculture, Anand Agricultural
University, Anand, Gujarat, India
*Corresponding author
ABSTRACT
Keywords
Mugbean, PRECIS,
simulation, DSSAT,
Projected climate
Article Info
Accepted:
22 July 2018
Available Online:
10 August 2018
The experimental data collected at Anand station (Latitude 22 o 35’, Longitude 72o55’,
altitude 45.1 MSL) during the year 2015 and 2016 for various irrigation levels, varieties
and spacing (I1- 0.8 IW/CPE ratio, I2- 0.6 IW/CPE ratio, I3- 0.4 IW/CPE ratio, V1- Meha,
V2- GM-4, S1- 45 cm row to row spacing S2- 30 cm row to row spacing). Were used to
calibrate and validate the model. The quantification of the impact of projected changes in
climatic parameter such as atmospheric CO2, temperature and rainfall on mungbean crop
production was assessed using validated DSSAT4.6 (CROPGRO) model for Anand
districts of Gujarat. The normal daily BSS data was used in the model. The DSSAT
(CROPGRO) model was used to simulate the phenology and yield and yield attributes
using daily data of baseline (1961-1990) and projected period (2071-2100). Possible
effects of climate change on plant growth were evaluated using the crop growth simulation
model. Projected CO2 concentration and temperature projections were applied as climate
change study. The PRECIS outputs for the A2- scenarios (2071-2100) indicated that the
mean maximum, minimum temperature and rainfall are expected to increase by 4.6 to 4.3
0
C and 402 mm respectively at Anand district. Results revealed that the reduction in
anthesis days may be highest (16.1%) in treatment I3V2S2 and lowest (5.7%) in treatment
I1V1S1, However the duration of days to physiological maturity are projected to be
reduced, in all treatments of green gram. However the reduction may be highest (23.8%) in
treatment I3V2S2 and lowest (10.5%) in treatment I1V1S2. The grain yield reduction due to
impact of climate change ranged 7.5 per cent to 21.3 per cent at different treatment. The
highest yield reduction was projected in I3V2S2 and lowest was projected in I1V1S2, while
mean yield reduction was 7.5 %.
Introduction
The most important variable in climate change
is temperature. One of the major effects of
increases in temperature is to speed up the
period of growth of the crop, especially in the
grain-filling stage, resulting in lower yields.
This effect is especially pronounced in semitropical and tropical conditions, since in these
areas many crops are already at the outer
limits of the temperatures that they can
tolerate. Other significant consequences of
increased temperatures include increase in the
transpiration rate and accelerated loss of soil
moisture, both of which increase the water
demand of a crop. The daily maximum
temperatures in Gujarat during summer season
are frequently exceeding 39o to 40o C, which
4178
Int.J.Curr.Microbiol.App.Sci (2018) 7(8): 4178-4189
are at tolerance limit of the mungbean.
Therefore, rise in temperature by few degrees
will severely affect growth and yield of
summer mungbean. Using PRECIS model
output as per IPCC scenario the rise of
temperature for Anand was calculated for
period 2071 -2100 AD. This daily PRECIS
model output for different weather parameters
viz., maximum temperature, minimum
temperature and carbon dioxide were used as
input for CROPGRO model and simulated
effects of rise in maximum temperature,
minimum temperature and carbon dioxide on
summer mungbean growth and yield. The
CROPGRO model simulated results were
compared with baseline output of model for
impact of climate change study. According to
the UKMO Climate change induced by
increasing greenhouse gases is likely to affect
crops differently from region to region, on an
average crop yield is expected to drop down to
50% in Pakistan and India (Schneider, 2007).
Cline (2008) studied how climate change
might affect agricultural productivity in the
2080s. His study assumed that no efforts are
made to reduce anthropogenic greenhouse gas
emissions, leading to global warming of
3.3 0C above the pre-industrial level. He
concluded that global agricultural productivity
could be negatively affected by climate
change with the worst effects in developing
countries.
Lobell et al., (2008) assessed how climate
change might affect 12 food-insecure regions
in 2030. The purpose of their analysis was to
assess where adaptation measures to climate
change should be prioritized. They found that
without sufficient adaptation measures, South
Asia and South Africa would likely suffer
negative impacts on several crops which are
important to large food insecure human
populations. The effect of projected climate
change for winter wheat production was
simulated by Kersebaum et al., (2008) for 9
sites across Germany using the dynamic agro-
ecosystem model HERMES and down scaled
climate change scenarios of GCM ECHAM5
output for SRES emission scenario A1B until
2050. Yield reductions between 2 and 11%
were estimated for 8 sites during the period
2031-2050. At higher altitude one site showed
an increase in simulated grain yield compared
to the reference period 1970-1989. Yield
reduction was greatest on sandy sites and dry
eastern parts of Germany.
Yadav et al., (2012) using Info Crop-wheat
model reported that grain yield of two
cultivars (GW-322 and GW-496) of wheat at
Anand during (2071-2100) period would be 56
and 61 % less than current yield levels which
would be mainly due to increasing minimum
and maximum temperatures during projected
period.
Singh et al., (2014a) investigated the impacts
of climate change by using CROPGROGroundnut model on productivity of
groundnut at three sites (Anantapur,
Mahboobnagar and Junagadh) and found that
at Anantapur changes in temperature and
rainfall by 2030 and 2050 decreased the pod
yield by 13% and 20% respectively. At
Mahboobnagar change in temperature and
rainfall significantly decreased the pod yield
by 8 and 11% by 2030 and 2050 and at
Junagadh change in temperature and rainfall
significantly decreased the pod yield by 2 and
7%.
Singh et al., (2014b) investigated the impacts
of climate change on the productivity of
chickpea (Cicer arietinum L.) at selected sites
in South Asia (Hissar, Indore and Nandhyal in
India and Zaloke in Myanmar) and East Africa
(DebreZeit in Ethiopia, Kabete in Kenya and
Ukiriguru in Tanzania). As compared to the
baseline climate, the climate change by 2050
(including CO2) increased the yield of
chickpea by 17% both at Hissar and Indore,
18% at Zaloke, 25% at DebreZeit and 18% at
4179
Int.J.Curr.Microbiol.App.Sci (2018) 7(8): 4178-4189
Kabete; whereas the yields decreased by 16%
at Nandhyal and 7% at Ukiriguru. The yield
benefit due to increased CO2 by 2050 ranged
from 7 to 20% across sites as compared to the
yields under current atmospheric CO2
concentration while the changes in
temperature and rainfall had either positive or
negative impact on yield at the sites. Yield
potential traits (maximum leaf photosynthesis
rate, partitioning of daily growth to pods and
seed-filling duration each increased by 10%)
increased the yield of virtual cultivars up to
12%. Yield benefit due to drought tolerance
across sites was up to 22% under both baseline
and climate change scenarios. Heat tolerance
increased the yield of chickpea up to 9% at
Hissar and Indore under baseline climate, and
up to 13% at Hissar, Indore, Nandhyal and
Ukiriguru under climate change.
Fu et al., (2016) studied the changes in yield
in relation to combined effects of CO2,
temperature and precipitation by CROPGROSoybean model and observed that yield was
projected to decrease under the climate
combination including the extremely high
temperature of +7.4 0C and yield increased
due to elevated CO2 and precipitation.
Materials and Methods
Climate change projection
scenario for Anand
under
A2
Using PRECIS model output as per IPCC
scenario the rise of temperature for middle
Gujarat was calculated for period 2071 -2100
AD. This daily PRECIS model output for
different weather parameters viz., maximum
temperature, minimum temperature, rainfall
and carbon dioxide were used as input for
CROPGRO model to run model and simulated
effects of rise in maximum temperature,
minimum temperature and carbon dioxide on
summer mungbean growth and yield were
evaluated. The CROPGRO model simulated
was compared with baseline output of model
to find out impact of climate change on
summer mungbean.
The PRECIS projection output of scenario A2,
and baseline were considered for projection of
weather for 2071 to 2100. As the baseline
(1961-1990) data generated by PRECIS
showed marked differences with actual (196190) data recorded at Anand station. So, the
projected data were calculated considering
actual data (1961-90) of Anand station. The
difference between PRECIS baseline and A2
scenario was added to actual data of 1961-90
to get weather data for 2071-2100. Two
approaches were adopted (i) day to day actual
data of 1961-90 as baseline and (ii) daily
normal (1961-90) as baseline. The crop model
DSSAT 4.6 CROPGRO was used to study the
mungbean crop response with the weather data
generated using first approach i.e., day to day
sum of actual weather data of 1961-90 and
changes calculated using PRECIS baseline
and A2 scenario projection data.
The grid wise data of maximum, minimum
temperature and rainfall have been separated
for different grid points of Anand district.
Subsequently based on monthly mean, daily
data were generated and used as A2 scenario
daily data for above mentioned parameters.
The DSSAT 4.6 (CROPGRO) model was run
for individual year using A2 scenario daily
weather data for projected period for 2071 to
2100 AD.
The climate change projections for year 2071 2100 were made for Anand district using
PRECIS output of A2scenario and baseline
(1961 to 1990) data. From monthly data to
daily data were derived by regression
interpolation
method.
DSSAT
4.6
(CROPGRO) model was used to study the
crop response with the weather data generated
using first approach i.e., day to day sum of
actual weather data of 1961-90 and changes
4180
Int.J.Curr.Microbiol.App.Sci (2018) 7(8): 4178-4189
calculated using PRECIS baseline and A2
scenario projection data under impact analysis.
Results and Discussion
Projected mean maximum temperature
The annual mean maximum temperature as
projected by PRECIS model output for period
(2071-2100) for Anand with baseline data is
presented in Table 1.
The results indicated that the mean maximum,
minimum temperature and rainfall during
baseline period were 33.20C, 19.8 0C and
919.2 mm of Anand district while during
projected period the maximum, minimum
temperature and rainfall were 37.80C, 24.10C
and 1312.0 mm, respectively. The PRECIS
outputs for the A2- scenarios (2071-2100)
indicated that the mean maximum, minimum
temperature and rainfall are expected to
increase by 4.6 to 4.3 0C and 402 mm
respectively at Anand district. Aggarwal et al.,
(2009) also reported increase in temperature
under Indo Gangetic Plan Zone of Uttar
Pradesh.
Impact of projected climate on mungbean
production at Anand
The PRECIS model generated monthly data of
minimum, maximum temperature and rainfall
obtained from IITM Pune converted to daily
data as per methodology described in Chapter3. The quantification of the impact of
projected changes in climatic parameter such
as atmospheric CO2, temperature and rainfall
on mungbean crop production was assessed
using validated DSSAT4.6 (CROPGRO)
model for Anand districts of Gujarat. The
normal daily BSS data was used in the model.
The DSSAT (CROPGRO) model was used to
simulate the phenology and yield and yield
attributes using daily data of baseline (19611990) and projected period (2071-2100).
Possible effects of climate change on plant
growth were evaluated using the crop growth
simulation
model.
Projected
CO2
concentration and temperature projections
were applied as climate change study. The
effect of climate change as obtained through
simulated model in terms of days to attain
anthesis and physiological maturity, grain
yield and biomass yield are compared with
that obtained from baseline period data and
the percent change are reported and described
in following section.
Impact on days to anthesis of mungbean
The anthesis days of baseline period (1961-90)
and projected periods (2071-2100) under A2
scenario for Anand district for various
irrigation levels, varieties and spacing are
presented in Table 3 and per cent
advancement at Anand districts under
different treatments are presented in Figure 1.
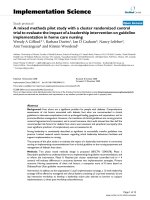
The results presented in Table 3 show that
during baseline (1961-90) period the days to
anthesis in cultivar in different treatments
ranged between 31 days in (I2V2S2, I3V2S2) to
35 days (in I1V1S1, I1V1S2, I2V1S1, I3V1S1 and
I3V1S2) with mean anthesis days of 33.6 over
the treatments. The days to anthesis simulated
during projected period (2071-2100) ranged
between 26 days (in I3V2S2) to 33 days (in
I1V1S1 and I3V1S1) with mean anthesis days of
30.2 days (Table 3). The advancement in
anthesis days due to impact of climate change
ranged between 5.7 percent (2 days) to 16.1
per cent (5 days) in different treatments. The
highest advancement in days to anthesis was
projected in I3V2S2 treatment and lowest was
projected in I1V1S1 treatment, while mean
advancement in days to anthesis in various
treatment of green gram was 10.3 per cent (3.4
days) (Fig. 3).
It may be concluded that due to climate
change the duration of days to anthesis are
4181
Int.J.Curr.Microbiol.App.Sci (2018) 7(8): 4178-4189
projected to be reduced, in all treatments of
mungbean. However the reduction may be
highest (16.1%) in treatment I3V2S2 and
lowest (5.7%) in treatment I1V1S1. It might be
due to Meha cultivar is temperature tolerant as
compared to GM-2.
Impact on days first pod
The First pod days of baseline period (196190) and projected periods (2071-2100) under
A2 scenario for Anand district for various
irrigation levels, varieties and spacing are
presented in Table 3 and per cent
advancement at Anand districts under
different treatments are presented in Figure 1.
The results presented in Table 3 showed that
during baseline (1961-90) period the days to
First pod days in cultivar in different
treatments ranged between 34 days (I1V2S1,
I2V2S2, I1V2S2, I2V2S1 and I3V2S2) to 37 days
(I1V1S1, I1V1S2, I2V1S1, I3V1S1 and I3V1S2)
with mean First pod days of 33.7 over the
treatments. The days to first pod days
simulated during projected period (2071-2100)
ranged between 29 days (I1V2S1, I1V2S2 and
I2V2S1) to 35 days (I1V1S2) with mean first
pod days of 31.5 days (Table 3). The
advancement in first pod days due to impact of
climate change ranged between 5.4 percent (2
days) and 14.5 per cent (05 days) in different
treatments. The highest advancement in days
to first pod days was projected in I1V1S1 and
I1V1S1 treatment and lowest was projected in
I1V1S2 treatment, while mean advancement in
days to first pod days in various treatment of
green gram was 11.7 per cent (4.2 days) (Fig.
1).
Impact on first seed days
The First seed days of baseline period (196190) and projected periods (2071-2100) under
A2 scenario for Anand district for various
irrigation levels, varieties and spacing are
presented in Table 3 and per cent
advancement at Anand districts under
different treatments are presented in Figure 1.
The results presented in Table 3 showed that
during baseline (1961-90) period the days to
first seed days in cultivar in different
treatments ranged between 39 days to 42 days
with mean first seed days of 40.5 over the
treatments. The days to first seed days
simulated during projected period (2071-2100)
ranged between 32 days (in I3V2S2) to 38 days
(in I1V1S2) with mean first pod days of 34.7
days (Table 3). The advancement in first seed
days due to impact of climate change ranged
between 9.5 percent (4 days) to 17.9 per cent
(07 days) in different treatments. The highest
advancement in days to first seed days was
projected in I3V2S2 treatment and lowest was
projected in I1V1S2 treatment, while mean
advancement in days to first seed days in
various treatment of green gram was 14.4 per
cent (5.8 days) (Fig. 1).
Impact on days to Physiological maturity
The days to physiological maturity of baseline
period (1961-90) and projected periods (20712100) under A2 scenario for Anand district for
various irrigation levels, varieties and spacing
are presented in Table 4 and per cent
advancement at Anand districts under
different treatments are presented in Figure 1.
The results presented in Table 4 showed that
during baseline (1961-90) period the days to
days to physiological maturity in cultivar in
different treatments ranged between 63 days
(I3V2S2) to 76 days (I1V1S1 and I1V1S2) with
mean days to physiological maturity days of
69.8 over the treatments. The days to
physiological maturity simulated during
projected period (2071-2100) ranged between
48 days (I3V2S2) to 68 days (I1V1S2) with
mean days to physiological maturity of 57.1
days (Table 4).
4182
Int.J.Curr.Microbiol.App.Sci (2018) 7(8): 4178-4189
Table.1 Trend statistics and slopes of maximum temperature for Anand
Parameter
Period/season
Maximum
temp.
Winter
Summer
Monsoon
Post-monsoon
Annual
Winter
Summer
Monsoon
Post-monsoon
Annual
Annual
Minimum
temp.
Rainfall
Thil-Sen analysis
Slope
Kendall’s tau
0.030
0.290
0.017
0.110
0.016c
0.169
0.039a
0.310
0.027a
0.350
0.017b
0.220
0.027a
0.32
0.017a
0.36
0.025b
0.22
0.024a
0.44
0.05
1.66
Regression analysis
Slope
R2
0.033
0.120
0.043
0.110
0.019
0.070
0.049
0.220
0.033
0.240
0.020
0.120
0.043
0.11
0.019
0.07
0.029
0.11
0.024
0.41
2.14
0.01
Table.2 Baseline and Projected mean maximum, minimum temperature and rainfall at Anand
during crop growth period (1st March to 31st May)
S. No Climatic parameters
1
2
3
4
CO2 Concentration(ppm)
Maximum Temperature(0C)
Minimum Temperature(0C)
Rainfall (mm)
Baseline
(1960-1990)
330
33.2
19.8
4
Scenario
(2071-2100)
724.9
37.8
24.1
6.2
Change
in
parameters
394.9
4.6
4.3
2.2
Table.3 Baseline (B) and Projected (P) days to anthesis, first pod days and first seed days under
various treatments at Anand district of Gujarat
Treatments
I1V1S1
I1V1S2
I1V2S1
I1V2S2
I2V1S1
I2V1S2
I2V2S1
I2V2S2
I3V1S1
I3V1S2
I3V2S1
I3V2S2
Mean
Anthesis
Baseline
Projected
35
33
35
32
33
31
33
32
35
31
34
29
32
28
31
27
35
33
35
31
33
29
31
26
33.6
30.2
First pod day
Baseline
Projected
37
34
37
35
34
29
34
29
37
32
37
33
34
29
34
31
37
32
37
32
36
32
34
30
35.7
31.5
Fist seed day
Baseline
Projected
42
36
42
38
39
35
39
34
42
35
42
36
39
34
39
33
42
35
42
34
39
34
39
32
40.5
34.7
Where, I1- 0.8 IW/CPE ratio, I2- 0.6 IW/CPE ratio, I3- 0.4 IW/CPE ratio, V1- Meha, V2- GM-4, S1- 45 cm row to
row spacing S2- 30 cm row to row spacing.
4183
Int.J.Curr.Microbiol.App.Sci (2018) 7(8): 4178-4189
Table.4 Baseline (B) and Projected (P) days to Physiological maturity, Maximum LAI and
Numbers of podm-2under various treatments at Anand
Treatments
I1V1S1
I1V1S2
I1V2S1
I1V2S2
I2V1S1
I2V1S2
I2V2S1
I2V2S2
I3V1S1
I3V1S2
I3V2S1
I3V2S2
Mean
Physiological maturity
Maximum LAI
Numbers of pod/m2
Baseline
Projected
Baseline
Projected
Baseline
Projected
76
76
67
67
75
74
66
65
73
72
64
63
69.8
65
68
58
55
59
58
55
54
54
61
50
48
57.1
4.1
4.8
3.8
4.1
3.7
4.4
3.2
3.6
3.1
3.5
2.3
2.8
3.6
3.5
4.2
3.1
3.5
3.1
3.5
2.6
3.0
2.6
3.1
2.0
2.3
3.0
711
756
465
565
562
421
402
400
375
290
280
200
452.3
630
687
400
485
485
380
350
340
310
220
231
154
389.3
Table.5 Baseline (B) and Projected (P) days to Physiological maturity, Maximum LAI and
Numbers of podm-2 under various treatments at Anand
Treatments
I1V1S1
I1V1S2
I1V2S1
I1V2S2
I2V1S1
I2V1S2
I2V2S1
I2V2S2
I3V1S1
I3V1S2
I3V2S1
I3V2S2
Mean
Yield
Total above ground biomass
Baseline
Projected
Baseline
Projected
1600
1610
1250
1457
1348
1257
1146
1117
923
673
762
572
1410
1490
1100
1200
1130
1085
987
960
780
530
612
480
4467
4891
4019
4657
4164
4461
3867
4057
2968
3010
2676
2126
3854
4320
3400
3841
3654
3710
3200
3210
2415
2521
2101
1654
1142.9
980.3
3780.3
3156.7
4184
Int.J.Curr.Microbiol.App.Sci (2018) 7(8): 4178-4189
Fig.1 Impact of climate change under A2 scenario (2071-2100) as compared to baseline (196190) on days to anthesis, first pod and first seed under various treatments at Anand
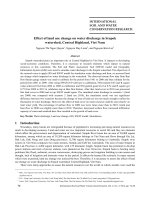
Fig.2 Impact of climate change under A2 scenario (2071-2100) as compared to baseline (196190) on days to physiological maturity, maximum LAI, numbers of podm-2, yield and biomass
under various treatments at Anand
4185
Int.J.Curr.Microbiol.App.Sci (2018) 7(8): 4178-4189
The advancement in days to physiological
maturity due to impact of climate change
ranged between 10.5 percent (8 days) to 23.8
per cent (15 days) in different treatments. The
highest advancement in days to days to
physiological maturity was projected in
I3V2S2 treatment and lowest was projected in
I1V1S2 treatment, while mean advancement in
days to maturity in various treatment of green
gram was 18.3 per cent (12.7 days) (Fig. 1).
It may be concluded that due to climate
change the duration of days to physiological
maturity are projected to be reduced, in all
treatments of green gram. However the
reduction may be highest (23.8%) in
treatment I3V2S2 and lowest (10.5%) in
treatment I1V1S2. It might be due to cv. Meha
(S1) is temperature tolerant as compared to cv.
GM 2 (S2). Pandey and Patel (2011) found
similar result for maize and wheat at AAU,
Anand.
reduction in maximum LAI was projected in
I3V2S2 treatment and lowest was projected in
I3V1S2 treatment, while mean reduction in
maximum LAI in various treatment of
mungbean was 15.8%.
It may be concluded that due to climate
change the duration of maximum LAI are
projected to be reduced, in all treatments of
mungbean. However the reduction may be
highest (21.4%) in treatment I3V2S2 and
lowest (11.4%) in treatment I3V1S2.
Impact on number of pods m-2
The number of pods m-2 of mungbean in
baseline period (1961-90) and projected
periods (2071-2100) under A2 scenario for
Anand district for various irrigation levels,
varieties and spacing are presented in Table 4
and per cent change in pods m-2 due to impact
of climate change at Anand districts under
different treatments are presented in Figure 2.
Impact on maximum LAI
The days to maximum LAI of baseline period
(1961-90) and projected periods (2071-2100)
under A2 scenario for Anand district for
various irrigation levels, varieties and spacing
are presented in Table 4 and per cent
reduction due to climate change during 20712100 AD at Anand districts under different
treatments are presented in Figure 2.
The results presented in Table 4 showed that
during baseline (1961-90) period the
maximum LAI in different treatments ranged
between 2.8 (I3V2S2) to 4.8 (I1V1S2) with
mean LAI of 3.6 over the treatments. The
maximum LAI simulated during projected
period (2071-2100) ranged between 2.0 (in
I3V2S1) to 4.2 (in I1V1S2) with mean
maximum LAI of 3.0 (Table 4). The reduction
in maximum LAI due to impact of climate
change ranged from 11.4 % to 21.4% in
different treatments of mungbean. The highest
The
DSSAT4.6
(CROPGRO)
model
simulated results showed that the number of
pods m-2during baseline period in different
treatment ranged 200 pods m-2 (I3V2S2) to 756
pods m-2 (I1V1S2) with mean pods m-2of 452.3
pods m-2, while the pods m-2 during projected
period ranged between 154 pods m-2 (I3V2S2)
to 687 pods m-2 (I1V1S2) with mean pods m2
of 389.3 pods m-2 (Table 4). The reduction in
pods m-2 due to impact of climate change
ranged 9.1% to 24.1% in different treatments.
The highest yield reduction was projected in
I3V1S2 and lowest was projected in I1V1S2,
while mean reduction in pods m-2 was 15.2%
(Fig. 2).
Impact on yield
The grain yield of green gram under baseline
period (1961-90) and projected periods (20712100) under A2 scenario for Anand district for
various irrigation levels, varieties and spacing
4186
Int.J.Curr.Microbiol.App.Sci (2018) 7(8): 4178-4189
are presented in Table 5 and per cent
impacted by climate change during 20712100AD at Anand districts under different
treatments are presented in Figure 2.
The DSSAT 4.6 (CROPGRO) model
simulated results showed that the green gram
yield during baseline period in different
treatment ranged 572 kgha-1 (I3V2S2) to 1610
kgha-1 (I1V1S2) with mean grain yield of
1142.9 kgha-1, while the grain yield during
projected period ranged between 480 kgha-1
in (I3V2S2) to 1480 kgha-1 in (I1V1S2) with
mean grain yield during projected period was
980.3 kgha-1 (Table 5). The grain yield
reduction due to impact of climate change
ranged 7.5 per cent to 21.3 per cent at
different treatment. The highest yield
reduction was projected in I3V2S2 and lowest
was projected in I1V1S2, while mean yield
reduction was 7.5 % (Fig. 2).
The above mentioned results indicate that the
highest grain yield reduction due to climate
change under I3V2S2 in all treatments and
lowest in I1V1S2 treatment. Aggarwal et al.,
(2010) and Kumar et al., (2012) also found
similar result for wheat crop by model
simulation.
Impact on above ground biomass
The above ground biomass of mungbean in
baseline period (1961-90) and projected
periods (2071-2100) under A2 scenario for
Anand district for various irrigation levels,
varieties and spacing are presented in Table 5
and per cent impacted by climate change
during 2071-2100 AD at Anand under
different treatments are presented in Figure 2.
The
DSSAT4.6
(CROPGRO)
model
simulated results showed that the mungbean
above ground biomass during baseline period
in different treatment ranged 2126 kgha-1
(I3V2S2) to 4891 kgha-1 (I1V1S2) with mean
above ground biomass of 3780 kgha-1, while
the above ground biomass during projected
period ranged between 1654 kgha-1 in (I3V2S2)
to 4320 kgha-1 in (I1V1S2) with mean above
ground biomass during projected period was
3137 kgha-1 (Table 5). The above ground
biomass reduction due to impact of climate
change ranged 11.7% to 22.2% in different
treatments. The highest above ground
biomass reduction was projected in I3V2S2
(22.2%) and lowest was projected in I1V1S2
(11.7), while mean above ground biomass
reduction was 17.0% (Fig. 2).
The above mentioned results indicate that the
highest grain yield reduction due to climate
change under I3V2S2 in all treatments and
lowest in I1V1S2 treatment. Similar results
were reported by Biyan et al., (2012) for
mungbean. Aggarwal et al., (2010) Kumar et
al., (2012), Yadav et al., (2012a) and Zagaria
et al., (2014) reported similar results for
wheat and Yadav et al., (2012b) for peanut
crop by model simulation.
From the above discussion it is concluded that
during the projected period (2071-2100 Ad)
the
CO2
concentration,
maximum
temperature, minimum temperature and
rainfall will increase by 395 ppm, 4.6 ºC, 4.3
and 2.2 mm, respectively compared to
baseline (1960-1990 AD) climate. Hence,
climate change will impact on summer
mungbean production under middle Gujarat
agroclimatic zone.
Under the climate change scenario due to
higher maximum and minimum temperatures
the days required to different phenological
stages reduced by 2 to 5 days, 2 to 5 days, 4
to 7 days and 8 to 15 days to attain anthesis,
first pod, first seed and physiological maturity
under different treatments. The reduction may
be highest (23.8%) in treatment I3V2S2 and
lowest (10.5%) in treatment I1V1S2. It might
be due to cv. Meha is temperature tolerant as
4187
Int.J.Curr.Microbiol.App.Sci (2018) 7(8): 4178-4189
compared to GM 2. Similarly, reduction of
11.4 to 21.4, 9.1 to 24.1, 7.5 to 21.3 and 11.7
to 22.2% in maximum LAI, pods m-2, grain
yield and above ground biomass, respectively
caused due to climate change during 20712100 AD compared to base line (1960-1990)
period. Patel et al., (2015) found similar result
for different rabi and kharif crop at AAU,
Anand and Kadiyala et al., (2016) studied the
impact of climate change on chickpea
productivity at four locations and revealed
that changes in temperature and rainfall by
2069 significantly (p<0.05) decreased the pod
yield by 4.3, 18.6, 18 and 17.2% at
Anantapur, Kadapa, Kurnool and Prakasam
district. Increasing the CO2 concentrations,
pod yield was found to be increased by 11.6,
2.2, 0.8 and 17.2% at Anantapur, Kadapa,
Kurnool and Prakasam districts.
From the above discussion it is concluded that
during the projected period (2071-2100 Ad)
the
CO2
concentration,
maximum
temperature, minimum temperature and
rainfall will increase by 395 ppm, 4.6 0C, 4.3
and 2.2 mm, respectively compared to
baseline (1960-1990 AD) climate. Hence,
climate change will impact on summer
mungbean production under middle Gujarat
agroclimatic zone.
Under the climate change scenario due to
higher maximum and minimum temperatures
the days required to different phenological
stages reduced by 2 to 5 days, 2 to 5 days, 4
to 7 days and 8 to 15 days to attain anthesis,
first pod, first seed and physiological maturity
under different treatments. The reduction may
be highest (23.8%) in treatment I3V2S2 and
lowest (10.5%) in treatment I1V1S2. It might
be due to cv. Meha is temperature tolerant as
compared to GM 2. Similarly, reduction of
11.4 to 21.4, 9.1 to 24.1, 7.5 to 21.3 and 11.7
to 22.2% in maximum LAI, pods m-2, grain
yield and above ground biomass, respectively
caused due to climate change during 2071-
2100 AD compared to base line (1960-1990)
period. Patel et al., (2015) found similar result
for different rabi and kharif crop at AAU,
Anand
References
Aggarwal P. K. Singh A. K., Samra J.S.,
Singh G., Gogoi A.K., Rao, GGSN and
Ramakrishna Y. S. (2009). Introduction.
In Global Climate Change and Indian
Agriculture, Ed: P.K. Aggarwal, ICAR,
New Delhi, pp. 1-5.
Aggarwal, P. K., Katterkandi, B.; and Kumar,
S.N. (2010). Mitigation. Adaptation.
Global climate Change. 15: 413-431 pp.
Biyan, S. C., Basanti, C., Dhuppar, P. and
Rao, D. S. (2012). Summer Mung Crop
Production in the Context of Climate
Change: An Appraisal. Indian Research
Journal of Extension Education, Special
Issue (2): 46-47.
Challinor, A. J. and Wheeler, T. R. (2008).
Crop yield reduction in the tropics
under climate change: Process and
uncertainties. Agric. and Forest
Meteorol. 148: 343-356.
Cline, W. R. (2008). Global Warming and
Agriculture. Finance and Development
(International Monetary Fund) 45 (1).
Archived 17 August 2014.
Fu, T. Ha, B. and Ko, J. (2016). Simulation of
CO2 enrichment and climate change
impacts on soybean production. Int.
Agrophy., 30: 25-37.
Kadiyala, M. D. M., Charyulu, K. D.,
Nedumaran, S., Shyam, M. D, Gumma,
M. K. and Bantilan, M. C. S. (2016).
Agronomic management options for
sustaining chickpea yield under climate
change scenario. J. Agromet., 18 (1):
41-47.
Kersebaum, K., Nendel, C. and Huth, N. I
(2008). Site-specific impacts of climate
change on wheat production across
regions of Germany using different CO2
4188
Int.J.Curr.Microbiol.App.Sci (2018) 7(8): 4178-4189
response functions. Eur. J. Agron., 52:
22-32.
Kumar, N., Tripathy, R. S., Jain, D.
R.,Vishwakarma, A. K., Madhu, M.,
Rao, B. K., Tripathi, K. P. and Anurajan
(2012) sensitivity of wheat crop to
projected climate change in nontraditional areas. J. Agrometeorol,
14(1): 82-86.
Lobell, D., Burke, T. and Mastrandrea, F. N.
(2008). Prioritizing climate change
adaptation needs for food security in
2030. Science 319 (5863): 607–10.
Pandey V. and Patel H. R. (2011). Climate
change and its impact on wheat and
maize yield in Gujarat. In. Challenges
and Opportunities in Agrometeorology
(eds) S. D. Attri, L. S. Rathore, MVK
Sivakumar, S.K.Dash. Springer. pp
321-334
Schneider, S. H.
(2007). "19.3.2.1
Agriculture". In ML Parry, et al., (eds.).
Chapter
19:
Assessing
Key
Vulnerabilities and the Risk from
Climate Change. Climate change 2007:
impacts, adaptation and vulnerability:
contribution of Working Group II to the
fourth assessment report of the
Intergovernmental Panel on Climate
Change. Cambridge University Press
(CUP): Cambridge, UK: Print version:
CUP. This version: IPCC website.
p. 790
Singh, P., Nedumaran, S., Boote, K. J., Gaur,
P. M. Srinivas, K. and Bantilan, M. C.
S. (2014a). Climate change impacts and
potential benefits of drought and heat
tolerance in chickpea in South Asia and
East Africa. Europ. J. Agron. 52 (B):
123-127.
Singh, P., Singh, N. P., Boote, K. J.,
Nedumaran, S., Srinivas, K. and
Bantilan, M. C. (2014b). Management
options
to
increase
groundnut
productivity under climate change at
selected sites in India. J. Agromet., 16
(1): 52-59.
Yadav, S. B., Patel, H.R., Patel, G. G.,
Lunagaria, M. M., Karande, B. I., Shah,
A. V. and Vandey, P. (2012b).
Calibration
and
validation
of
PNUTGRO (DSSAT v4.5) model for
yield and yield attributing characters of
kharif groundnut cultivars in middle
Gujarat region. J. Agrometeorol. 14:
Special Issue, 24-29.
Yadav, S. B., Patel, H. R.; Kumar, A. and
Pandey, V. (2012a). Impact assessment
of climate change on wheat yield of
middle Gujarat region. Int. J. Agri. Sci.
& Tech. 1 (1): 5-13.
How to cite this article:
Karande, B.I., H.R. Patel, S.B. Yadav, M.J. Vasani and Patil, D.D. 2018. Impact of Projected
Climate Change on Summer Mungbean in Gujarat, India. Int.J.Curr.Microbiol.App.Sci. 7(08):
4178-4189. doi: />
4189