Journal of Fisheries science and Technology – No 3/2016
Bạn đang xem bản rút gọn của tài liệu. Xem và tải ngay bản đầy đủ của tài liệu tại đây (6.9 MB, 126 trang )
Journal of Fisheries science and Technology
No.3 - 2016
ACE-INHIBITORY ACTIVITY OF PROTEIN HYDROLYSATE
FROM THE SKIN OF STRIPED CATFISH (Pangasius hypophthalmus)
Hue Quoc Hoa1,2, Nguyen Xuan Duy3
Received: 21/7/2016; Revised: 09/8/2016; Accepted: 26/9/2016
ABSTRACT
There has recently been an increasing demand to produce protein hydrolysates containing peptides with
specific biological properties, which could be marketed as functional food ingredients. The objective of this
study was to evaluate the in vitro angiotensin converting enzyme inhibitory activity of striped catfish skin
hydrolysates and its corresponding fractionates. The striped catfish skin from fillet processing was extracted
in an autoclave at 1210C for 30 minutes to obtain an extracted protein. Then it was further hydrolysed with
Alcalase with the enzyme to substrate ratio of 20 units/gram protein at 50oC, pH 8 for 7h to obtain protein
hydrolysate. The degree of hydrolysis (DH) increased with the increase of hydrolysis time and reached
the highest DH of 91.9% after 7h hydrolysis. The 5-h hydrolysate (DH= 60.8%) exhibited the highest
ACE-inhibitory activity (IC50 = 831 µg/ml). Therefore, the 5-h hydrolysate sample was used as material for
studying enrichment of ACE-inhibitory peptides by ultrafiltration using three different molecular weight
cut-off membranes (10, 5, and 1 kDa). Six sample fractions obtained during ultrafiltration process (permeate
and retentate) were tested for angiotensin converting enzyme inhibition activity. Permeate of 1 kDa membrane
showed the highest activity. The obtained hydrolysates were fractioned using SephadexM G-15. Based on gel
filtration chromatography results, angiotensin converting enzyme inhibitory peptides had molecular weight
ranging of 307 Da to 429 Da. Our findings revealed the potential of using catfish skin as a promising material
for retrieving angiotensin converting enzyme inhibitory substances.
Keywords: Alcalase, ACE-inhibitory activity, hydrolysate, ultrafiltration, Pangasius hypophthalmus
I. INTRODUCTION
High blood pressure is a major risk factor
associated with cardiovascular disease, the
biggest cause of casualty. Hypertension
is commonly treated with antihypertensive
or blood pressure lowering drugs, such as
captopril,
benazepril,
enalapril.
These
drugs are angiotensin I converting enzyme
(ACE) inhibitors. ACE (EC 3.4.15.1) is a
zinc-metallopeptidase that needs zinc and
chloride ions for its activity. In the renin-angiotensin
system (RAS), ACE plays a crucial role in
the regulation of blood pressure as well as
cardiovascular function (Li et al., 2004).
Within the enzyme cascade of the RAS, ACE
converts the inactive angiotensin I by cleaving
dipeptide from the C-terminus into the potent
vasoconstricting angiotensin II. This potent
vasoconstrictor is also involved in the release
of a sodium-retaining steroid, aldosterone,
from the adrenal cortex, which has a tendency
to increase blood pressure. As many synthetic
drugs like ACE inhibitors have side effects,
peptides from food sources provide an attractive
alternative (Howell and Kasase, 2010). Recent
researches have reported discoveries of
peptides, which are isolated and characterized
from a number of fish skin by-products such
as Nile tilapia skin (Vo et al., 2011), Pacific cod
skin (Ngo et al., 2011), Atlantic salmon skin
(Gu et al., 2011), Skate skin (Lee et al., 2011),
Pangasius catfish (Mahmoodani et al., 2014)
Nutraceutical and Functional Food R&D Center, Prince of Songkla University, Thailand
Department of Technology, Dong Thap Community College, Vietnam
3
Faculty of Food Technology, Nha Trang University, Vietnam
* Correcponding email:
1
2
NHA TRANG UNIVERSITY • 3
Journal of Fisheries science and Technology
that inhibited ACE and can be used as
nutraceuticals and functional food ingredients.
A group of peptides from sardine (Fujita, 2001)
could decrease blood pressure and approved
products containing these components can
claim that the product is suitable for individuals
with slightly elevated blood pressure.
A commercial product from sardine peptides
that lowers blood pressure was approved by
food for specified health uses (FOSHU), an
official functional food approved by the
consumer affairs agency of Japan (Shimizu,
T, 2003). Striped catfish (Pangasius
hypophthalmus) is a large freshwater fish. It is
an important species in freshwater aquaculture
in Vietnam, Thailand, Malaysia, Indonesia and
China. The fillet processing generates
considerable quantities of by-products,
including abdominal organs, head, bone and
skin, that in total represent about 65% of the
fish by weight (Thuy et al., 2007). The objective
of this study was to investigate ACE inhibitory
activity of protein hydrolysate from striped
catfish skin by-products by enzymatic
hydrolysis using Alcalase.
II. MATERIALS AND METHODS
1. Materials
Catfish skins were obtained from a striped
catfish processing plant (Dong Thap, Vietnam),
the skins were frozen and stored at -20oC
before use. Alcalase from Bacillus licheniformis
2.4 L, o-phthalaldehyde, DL-dithiothreitol,
ACE from rabbit lung and other chemicals
were purchased from Sigma-Aldrich Chemical
Company. Polysulphone hollow fiber membranes
with 10, 5, and 1 kDa MWCOs (diameter = 1, 1,
and 0.5 mm; area = 0.01, 0.01, and 0.014 m2)
were purchased from GE Healthcare
Bio-Science Ltd. (Bangkok, Thailand).
2. Methods
2.1 Extraction of protein from striped catfish skin
The clean skins were added with distilled
water (1:2, w/v) and the protein was extracted
4 • NHA TRANG UNIVERSITY
No.3 - 2016
using an autoclave at 121oC for 30 min. After
extraction, the extracted protein solution was
filtered through a metal sieve to remove skin
residues. Extracted protein solution was
centrifuged at 3,000g for 20 min at 25oC to
remove insoluble residues and used as a
substrate for enzyme hydrolysis. Protein
content in the skin and the extracted protein
solution were determined by Kjeldahl method
(AOAC, 1999).
2.2. Enzymatic hydrolysis of extracted protein
solution
The extracted protein solution was diluted
to obtain a protein concentration of 1% (w/v)
by 0.1 M sodium phosphate buffer, pH 8.0. The
protein solution was hydrolysed by 20 units/g
protein of Alcalase 2.4 L at pH 8.0 and 50oC in
a 4-L reactor for 6h. The pH of the mixture was
measured by a pH meter (Eutech, Cyber Scan
pH 110, Singapore) and manually adjusted to
pH 8.0 during the hydrolysis by 6N NaOH and
6N HCl. Aliquots of hydrolysate were collected
every 60 mins during the hydrolysis. The
sample aliquots were heated in boiling water
(950C) for 10 mins to inactivate Alcalase.
They were kept in plastic bottles at - 20oC for
analyses.
The degree of hydrolysis (DH) of the
sample was determined by measure the
available cleaved peptides bonds upon
hydrolysis, using the o-phthalaldehyde (OPA)
method as described by Hue et al. (2013).
2.3. Enrichment of ACE-inhibitory peptides
derived from hydrolysate of striped catfish skin
by ultrafiltration
The protein hydrolysate was separated
using three different MWCO membranes (10,
5, and 1 kDa). The operating condition in batch
mode was transmembrane pressure (TMP) of
1.5 bars, and cross flow velocity (CFV) of 1.5 m/s.
The ACE-inhibitory activity of the feed and
permeate were analyzed.
Journal of Fisheries science and Technology
No.3 - 2016
2.4. Angiotensin-I converting enzyme inhibitory
fractionation. It was dried using freeze dryer
activity of protein hydrolysates from striped
(Flexi Dry, Dura Dry, NY, USA). The hydrolysate
catfish skin
was
The
inhibition
of
ACE
activity
was
determined by the method of Cushman
and Cheung (1971) described by Lee et al.
(2010) with some modifications. The reaction
mixture contained 8.3 mM Hippuryl-L-HistidylL-Leucine (Hip-His-Leu) in 0.5M NaCl and
5 mU ACE in 50 mM sodium borate buffer
(pH 8.3). A sample (50 μl) was added to above
reaction mixture (50 μl) and mixed with 8.3 mM
HHL (150 μl) containing 0.5 M NaCl. After
incubation at 37oC for 1 h, the further reaction
was stopped by the addition of 0.1M HCl (250 μl).
The resulting hippuric acid was extracted by
fractioned
using
SephadexM
G-15.
The elution was carried out with 50 mM sodium
phosphate buffer pH 7.0 at a flow rate of 0.3
ml/min. The 3 ml fractions were collected and
their absorbance was read at 220 and 280
nm. A standard distribution was determined by
chromatographing independently using the
following
standards:
Reduced
glutathione
(429 Da), Hip-His-Leu (307 Da), and Tyrosine
(181.91 Da). The fractions of SephadexM G-15
column
were
determined
for
their ACE
inhibitory activity. All fractions were determined
soluble protein content by Lowry method
the addition of 1.5 ml of ethyl acetate. After
(Lowry et al., 1951).
centrifugation (800 x g, 15 mins), 1 ml of the
2.6. Statistical analysis
upper layer was transferred into a glass tube
All experiments were carried out in
and evaporated at room temperature for 2 h in
triplicate. Analysis of variance was performed.
a vacuum. The hippuric acid was redissolved
Mean comparisons were run by Duncan’s
in 3 ml of distilled water, and absorbance was
multiple range tests. Analysis was performed
measured at 228 nm using a spectrophotometer
using an SPSS package.
(GENESYS 10S UV-VIS Thermo Scientific,
Tokyo, Japan). The control and blank were
III. RESULTS AND DISCUSSION
prepared in the same manner, except that 50 μl
1. Effect of hydrolysis time on degree of
of buffer was used instead of the sample. The
hydrolysis (DH)
ACE inhibitory activity was expressed as IC50
value (μg/ml). The IC50 value was defined as
The DH is generally used as a proteolysis
monitoring parameter, and it is the most widely
the concentration of inhibitor required to inhibit
used indicator for comparison among different
50% of the ACE activity. The percentage of
protein hydrolysates (Guérard et al., 2002).
inhibition level was calculated as follows:
Inhibition level (%) =
AControl - ASample
AControl - ABlank
x 100
Where AControl is the absorbance of control
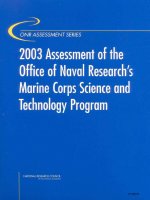
There was a sharp increase of DH in the first
30 min (DH = 28%) and it increased slightly
during 30 to 180 min hydrolysis stage. From
180 min onwards, the DH rose dramatically
ASample is the absorbance of the sample
and reached a peak of 91.9% at the end of the
2.5. Fractionation of ACE-inhibitory peptides
from the increase of short peptides. These
from hydrolysate
results indicated that rapid cleavage of
ABlank is the absorbance of the blank
The obtained hydrolysate from UF with the
highest ACE-inhibitory activity was used for
period (Figure 1). High value of DH resulted
peptides from the extracted protein solution by
Alcalase occurred after 3 h.
NHA TRANG UNIVERSITY • 5
Journal of Fisheries science and Technology
No.3 - 2016
Figure 1. Degree of hydrolysis of protein hydrolysate during hydrolysis with Alcalase
2. Effect of hydrolysis time on ACE
inhibitory activity of hydrolysate
ACE inhibitory activity of hydrolysate with
different hydrolysis time expressed as IC50 is
shown in Figure 2. IC50 value of hydrolysate
decreased as hydrolysis time increased
(p < 0.05). ACE inhibitory activity of extracted
protein (IC50 value of 1,556 ± 16.61 µg/ml)
increased after hydrolysis (IC50 value ranging
from 1,233 ± 29.31 µg/ml to 831 ± 33.39 µg/ml).
It was suggested that peptides with ACE
inhibitory activity could be generated during
hydrolysis. The ACE inhibitory activity
appeared to increase as hydrolysis time
increase because the lengths of peptides
were shortened and increased ACE inhibitory
activity (Je et al., 2004). The highest ACE
inhibitory activity of striped catfish skin protein
hydrolysate (IC50 value of 831 ± 33.39 µg/ml)
was found at hydrolysis time of 5 h. The
highest ACE inhibitory activity of skin
hydrolysate in the present study was almost
similar with that of blacktip shark gelatin (0.94 1.77mg/ml) (Kittiphattanabawon et al., 2013),
salmon skin gelatin (1.17 mg/ml) (Gu et al.,
2011), and skate skin gelatin (1.89 mg/ml)
(Lee et al., 2011). Enzyme hydrolysis was
performed in order to achieve the desired
degree of hydrolysis to obtain biologically
active peptides. From previous studies, ACE
inhibitory activity of peptides increased with
prolonged incubation with enzyme. However,
longer hydrolysis time led to the peptides lost
their ability to inhibit ACE (Wu et al., 2008; Xu
et al., 2014). The structure of amino acid for
interactions between the substrate and the
active site of ACE affected ACE inhibitory
activity (Ondetti et al., 1977). Cushman
and Cheung (1971) reported that peptides
containing aromatic at the C-terminal end and
the branch-chain aliphatic amino acid at the
N-terminal were effective for high ACE inhibitory
activity because of the interaction between
these amino acids at the active site of ACE.
Figure 2. ACE inhibitory activity of striped catfish hydrolysate at various hydrolysis times
Different letters on the bars indicate significant differences (p < 0.05). The lower IC50 value represents the higher ACE inhibitory activity
6 • NHA TRANG UNIVERSITY
Journal of Fisheries science and Technology
3. Effect of different MWCO membranes on
ACE-inhibitory activity of peptides
Permeate of MWCO 1 kDa membrane
showed the highest ACE inhibitory activity.
The results indicated that molecular weight
of most ACE inhibitory peptides, which was
No.3 - 2016
produced and separated from the hydrolysate,
was smaller than 1 kDa. This result was in
accordance with Je et al. (2004), who reported
that Alaska pollack frame protein hydrolysate
that having a molecular mass below 1 kDa
showed the highest ACE inhibitory activity.
Figure 3. ACE inhibitory activity of peptides in permeate and retentate during ultrafiltration
of 5-h hydrolysate in batch mode (TMP = 1.5 bars, CFV = 1.5 m/s, temperature = 50oC)
10 kDa MWCO (A), 5 kDa MWCO (B), and 1 kDa MWCO (C) membranes. The lower IC50 value represents
the higher ACE inhibitory activity
Figure 3 shows filtration time versus ACE
inhibitory activity of peptides in permeation and
retentiveness during ultrafiltration of protein
hydrolysate. In general, the ACE inhibitory
activity of peptides in permeance and retention
fell steadily when the operating time increase
(IC50 value increased steadily). The ACE
inhibitory activity of peptides in permeates
was always higher than that in the retentate
because low molecular weight of peptides
in permeates exhibited high ACE inhibitory
activity. The ACE inhibitory activity (IC50
average value) of permeates of MWCO 10, 5,
and 1 kDa membranes were 159.7, 125.0, and
8.3 µg/ml, respectively.
NHA TRANG UNIVERSITY • 7
Journal of Fisheries science and Technology
No.3 - 2016
4. Fractionation of ACE-inhibitory peptides
activity was obtained at fractions 15 to 18 that
from hydrolysate
having molecular weights 307 Da to 429 Da.
The chromatogram of hydrolysate subjected
Similar findings were also observed from
to Sephadex G-15 column is shown in Figure 4.
previous works by Je et al. (2004); Mahmoodani
Amarowicz and Shahidi (1997) reported that
et al. (2014); Raghavan and Kristinsson (2009),
the optical density at 220 nm (A220) indicates
who reported that peptides with molecular
the peptide bonds and the optical density at
masses below 1 kDa showed the highest ACE
280 nm (A280) represents peptides, proteins
inhibitory activity. The peaked fractions showed
or amino acids with aromatic rings. Figure 4
the highest ACE inhibitory activity (IC50 value
shows the chromatogram of the hydrolysate
ranging from 1.22 to 5.88 µg/ml) (Table 1),
from permeates of UF 1 kDa MWCO membrane
which ranged from 141.45 to 681.72 fold
which was fractionated using Sephadex G-15 gel
higher than hydrolysate (IC50 value 831.7 µg/ml).
filtration chromatography. A peak of A220
Fractions 15-18 showing the highest ACE
was observed in fraction 4, reflecting the
inhibitory activity. The result suggests that
presence of peptides bonds and a distinct peak
peptides without or low ACE inhibitory activity
of A280 was found in the same fraction indicated
was
the presence of peptides containing aromatic
peptides with high ACE inhibitory activity were
amino acids. The highest ACE inhibitory
concentrated.
M
M
removed
during
fractionation
Figure 4. Elution profile of striped catfish skin hydrolysate (from UF 1 kDa MWCO membrane)
separated by size exclusion chromatography on SephadexM G-15
Reduced glutathione (MW = 429 Da), Hip-His-Leu (MW = 307 Da), Tyrosine (MW = 181.91 Da),
were used to calibrate the standard molecular weights
Table 1. ACE inhibitory activity of peaked fractions from SephadexM G-15 column
Fraction No.
ACE inhibitory activity (IC50)
15
4.98 ± 0.03 µg/ml
16
1.22 ± 0.01 µg/ml
22
5.88 ± 0.06 µg/ml
8 • NHA TRANG UNIVERSITY
while
Journal of Fisheries science and Technology
IV. CONCLUSION
This study found that the protein hydrolysate
from striped catfish skin exhibited strong
ACE-inhibitory activity. The ultrafiltration usage
of 1 kDa was successful for separation ACE
inhibitory activity peptides since ultrafiltration
of the hydrolysate resulted in a significant
increase its ACE inhibitory activity in the
permeate fractions (IC50 = 8.3 µg/ml). It
was concluded that peptides receiving from
alcalase hydrolysis of striped catfish skin
No.3 - 2016
could be utilized as a part of functional food or
ingredients of a formulated drug in order to
control high blood pressure.
ACKNOWLEDGMENTS
The authors would like to express their
sincere thanks to the Mekong 1,000 Project The People’s Committee of Dong Thap
Province - Vietnam, and the Faculty of
Agro-Industry, Prince of Songkla University Thailand.
REFERENCES
1.
Amarowicz, R. and Shahidi, F., 1997. Antioxidant activity of peptide fractions of capelin protein hydrolysates.
Food Chem, 58 (4): 355-359.
2.
AOAC, 1999. Official Methods of Analysis, 16th ed. Arlington, VA: Association of Official Analytical Chemists.
3.
Cushman, D. W. and Cheung, H. S., 1971. Spectrophotometric assay and properties of the angiotensin
I-converting enzyme of rabbit lung. Biochem. Pharmacol, 20: 1637-1648.
4.
Fujita, H. 2001. Human study of sardine peptides on blood pressure. Nutrition Reseach, 21: 1149.
5.
Gu, R. Z., Li, C. Y., Liu, W. Y., Yi, W. X. and Cai, M. Y., 2011. Angiotensin I converting enzyme inhibitory
activity of low molecular weight peptides from Atlantic salmon (Salmo salar L.) skin. Food Res. Int, 44:
1536-1540.
6.
Guérard, F., Guimas, L., Binet, A., 2002. Production of tuna waste hydrolysates by a commercial neutral
protease preparation. Journal of Molecular Catalysis B: Enzymology, 19: 489-498.
7.
Howell, N. K. and Kasase, C., 2010. Bioactive Proteins and Peptides as Functional Foods and Nutraceuticals.
Blackwell Publishing Ltd. John Wiley & Sons, Inc. Iowa: 203-219
8.
Hue, Q. H., Youravong, W., Sirinupong, N., 2013. Antioxidant activities of protein hydrolysate from the skin
of striped catfish (Pangasius hypophthalmus) fillet processing waste. J. Fish. Sci. Technol. Special issue: 70-77.
9.
Je, J. Y., Park, P. J., Kwon, J. Y. and Kim, S. K., 2004. A novel angiotensin I converting enzyme inhibitory
peptide from Alaska Pollack (Theragra chalcogramma) frame protein hydrolysate. J. Agric. Food Chem, 52 (26):
7842-7845.
10. Kim, S. K. and Byun, H. G., 2001. Purification and characterization of angiotensin I converting enzyme (ACE)
inhibitory peptides from Alaska pollack (Theragra chalcogramma) skin. Process Biochem, 36: 1155-1162.
11. Kittiphattanabawon, P., Benjakul, S., Visassanguan, W. and Shahidi, F., 2013. Inhibition of angiotensin converting
enzyme, human LDL cholesterol and DNA oxidation by hydrolysates from blacktip shark gelatin. LWT Food
Sci. Technol, 51: 177-182.
12. Li, G. H., Le, G. W., Shi, Y. H. and Shrestha, S. 2004. Angiotensin-converting enzyme inhibitory peptides from
food proteins and their physiological and pharmacological effects. Nutr. Res. 24: 469-486.
13. Lee, J. K., Jeon, J. K. and Byun, H. G., 2011. Effect of angiotensin-I converting enzyme inhibitory peptide
purified from skate skin hydrolysate. Food Chem, 125: 495-499.
14. Lee, S. H., Qian, Z. J. and Kim, S. K., 2010. A novel angiotensin I converting enzyme inhibitory peptide from
tuna frame protein hydrolysate and its antihypertensive effect in spontaneously hypertensive rats. Food Chem,
118: 96-102.
NHA TRANG UNIVERSITY • 9
Journal of Fisheries science and Technology
No.3 - 2016
15. Lowry, O. H., Rosebrough, N. J., Farr, A. L. and Randall, R. J., 1951. Protein measurement with the folin phenol
reagent. J. Bio. Chem, 193: 265-275.
16. Mahmmdani, M., Ghassem, M., Babji, A. S., Yusop, S. M., 2014. ACE inhibitory activity of pangasius catfish
(Pangasius sutchi) skin and bone gelatin hydrolysate/ J. Food. Sci. Technol. 51 (9): 1847-1856.
17. Ngo, D. H., Ryu, B., Vo, T. S., Himaya, S. W. A., Wijesekara, I. and Kim, S. K., 2011. Free radical scavenging
and angiotensin-I converting enzyme inhibitory peptides from Pacific cod (Gadus macrocephalus) skin gelatin.
Int. J. Biol. Macromol, 49: 1110-1116.
18. Ondetti, M.A., Rubin, B. and Cushman, D. W., 1977. Design of specific inhibitors of angiotensin-converting
enzyme: new class of orally active antihypertensive agents. Science, 196: 441–444.
19. Raghavan, S. and Kristinsson, H. G., 2009. ACE inhibitory activity of tilapia protein hydrolysate. Food Chem,
117: 582-588.
20. Shimizu, T. 2003. Health claims on functional foods: the Japanese regulations and an international comparison.
Nutrition Research Reviews, 16: 241-252.
21. Thuy, N. T., N. T. Loc, J. E. Lindberg., Ogle. B., 2007. Survey of the production, processing and nutritive
value of catfish by-product meals in the Mekong Delta of Vietnam. Livestock Research for Rural Development,
19: 124-103.
22. Vo, T. S., Ngo, D. H., Kim, J. A., Ryu, B. and Kim, S. K., 2011. An antihypertensive peptide from Tilapia gelatin
diminishes free radical formation in murine microglial cells. J. Agric. Food Chem, 59: 12193-12197.
23. Wu, H., He, H. L., Chen, X. L., Sun, C. Y., Zhang, Y. Z. and Zhou, B. C., 2008. Purification and identification
of novel angiotensin-I converting enzyme inhibitory peptides from shark meat hydrolysate. Process Biochem,
43: 457-461.
24. Xu, W., Kong, B. H. and Zhao, X. H., 2014. Optimization of some conditions of Neutrase-catalyzed plastein
reaction to mediate ACE-inhibitory activity in vitro of casein hydrolysate prepared by Neutrase. J. Food Sci.
Technol, 51 (2): 276-284.
10 • NHA TRANG UNIVERSITY
Journal of Fisheries science and Technology
No.3 - 2016
POTENTIAL IMPACTS OF CLIMATE CHANGE ON FISHERIES
AND AQUACULTURE IN SRI LANKA (ROAMING THROUGH
THE CLIMATE CHANGE MANAGEMENT STORIES OF SRI LANKA)
Jayasinghe A.D1, Niroshana K.H.H2
Received: 07/6/2016; Revised: 29/7/2016; Accepted: 26/9/2016
ABSTRACT
There is an increasing concern over the effects of climate change on aquaculture worldwide. Given
a mounting evidence of the impacts of climate variability and change on aquatic ecosystems, the resulting
impacts on fisheries and aquaculture are likely to be substantial in Sri Lanka. This paper reviews potential
impacts of climate change on Sri Lankan Fisheries and Aquaculture together with certain possible measures
that the nation can adapt to cope with the impacts. The sea level rise has been identified as the mostly affecting
factor on the Sri Lankan Fisheries and Aquaculture. Through ArcGIS techniques, the study has found that in
Puttalam district 32.8%, 33.7%, 35.8% and 37.6% of aquaculture farm areas will be irreversibly affected by
the future sea level rising in 2025, 2050, 2075 and 2100, respectively. Insights to the possible coping strategies
were also provided in the study for the government, NGOs and the private sector to cooperate collectively in
search of most suitable solutions to deal with climate change.
Keywords: Climate change, impacts, aquaculture
I. INTRODUCTION
It is a well-known fact that Sri Lanka earns
a high amount of income from its fisheries and
moreover the sector provides about 540,000
direct and indirect employment opportunities
people island wide (The Ministry of Fisheries
& Aquatic Resources Development, 2016).
Fishery constitutes the major economic activity
in the coastal region which contains 25% of
the population. The fishery sector has received
much attention in the national development
agenda as shown by its recognition (Climate
Change Secretariat and Ministry of Environment
Sri Lanka, 2010). Although Sri Lanka is endowed
with large fresh and brackish water resources
it does not have a tradition of aquaculture and
only shrimp aquaculture and ornamental fish
culture have been developed to any extent
(FAO, 2016).
Capture fishery of Sri Lanka was given
more weight in the history of the climate change
1
2
impacts on Sri Lanka. Being touched thoroughly
the SL stories of climate change and the fisheries
this paper provides insights on one of the most
critical issue of climate change impact on Sri
Lanka: the sea level rise. Literature is available
in supporting to get predictions on the sea level
rise in the Puttalam District of Sri Lanka. Yet,
no evidence is available in favor of predicting
the possible consequences of such impacts.
This paper consists of two main parts:
(i) the holistic nature of the CC and then the CC
impact on local level specifically Sri Lanka and
(ii) the ArcGIS technique was used to make
predictions about scenarios of sea level rise in
Puttalam District. This paper gives more weight
to the impact of sea level rise on shrimp farming
in the Puttalam district of Sri Lanka as it was
the blood vein of the Sri Lankan export fishery
sector.
Least developed countries in tropical regions
have already been identified as particularly
Institute of Aquaculture, Nha Trang University, Vietnam
Department of Oceanography and Marine Geology, University of Ruhuna
NHA TRANG UNIVERSITY • 11
Journal of Fisheries science and Technology
vulnerable to climate change because of their
greater economic and nutritional dependence
on fish and fewer available resources to invest
in climate adaptation (Barange et al., 2014).
Human population growth is faster in least
developed countries where fish provides a
larger contribution to non-grain protein needs.
South Asian region stands out as a place
that is not only projected to face decreasing
catches, but also has a high dependency on
fisheries and a sizeable, rapidly growing
population whose consumption of fish is likely to
increase with its rapid economic development
(Delgado et al., 2003). Climate change affects
people and nature in countless ways, and it
often increases the prevailing threats that
have already put pressure on the environment.
According to the statistics presented by the
National Aquaculture Development Authority
of Sri Lanka the fish production by inland and
aquaculture sector is much lower than the
production by the marine fish catch. For example,
in the year 2014 total fish catch from fisheries
counted as 459300 million tons (MT) while
the fish catch from aquaculture accounted as
75750 MT. Therefore, studies should prioritize
to investigate the impacts of climate change on
aquaculture in terms. Nevertheless it is also
necessary to highlight that we should revise
the aquaculture impacts on accelerating the
climate change.
II. METHODOLOGY
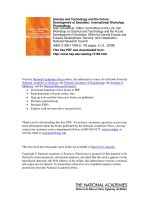
1. Study area
Though Sri Lanka is bestowed with a great
potential of aquaculture there was no virtually
history on aquaculture until the beginning of
1980s along the coastal border of the Puttalam
district of the North Western region of Sri
Lanka. Afterwards there was a rapid expansion
of the shrimp production along the coastal
boarder of the Puttalam district mainly due to
three reasons. Firstly, Puttalam is endowed
with number of abundant natural resources
such as mangrove swamps, coastal lagoons,
12 • NHA TRANG UNIVERSITY
No.3 - 2016
Figure 1. Distribution of aquaculture farms in
Puttalam district, Sri Lanka
Inserted figure is the map of Sri Lanka with the location of
Puttalam district. This map was constructed by using ArcGIS®
software by Esri
tidal flats and estuaries well-suited to shrimp
farming. Secondly, this region is close to the
Katunayake International airport and Colombo
harbor together with good road facilities which
allowed for swift access to infrastructure needs
for the export of special fresh products. And
the third reason is that “industry development
in the Puttalam district coincide with a heavy
demand for shrimp in international markets”
(Munasignhe et al, 2010). Depending on the
aforementioned facts, this study was carried
out in Puttalam District based on mainly IPCC
reports and other secondary data on
Aquaculture industry in Sri Sri Lanka and
Climate Change.
2. Assessing sea level rise impacts on aquaculture
farming industry in Puttalam district
In order to assess the sea level rise
impacts on aquaculture industry in Puttalam
district, information was required on the
distribution of aquaculture farms in Puttalam
district and the areas of inundation due to
predicted sea level rise. Hence, the distribution
of the aquaculture farms in the Puttalam district
were extracted from Google Satellite Images
Journal of Fisheries science and Technology
(Google earth, 2016) and GPS locations were
obtained by Garmin 72 Handheld GPS device
for ground verification. Areas of inundation due
to predicted sea level rise for 2025, 2050, 2075
and 2100 were extracted (by using manual
digitizing method) from predicted sea level rise
maps for 2025, 2050, 2075 and 2100, which
were published in IPCC report in 2007.
No.3 - 2016
Subsequently, the distribution of aquaculture
farms in the study area and inundations
layers for 2025, 2050, 2075 and 2100 were
then overplayed and then potential areas
of aquaculture industry to be affected from
predicted sea level rise were determined. All
these maps were constructed by using ArcGIS
10.1 software by Esri.
III. RESULTS AND DISCUSSSIONS
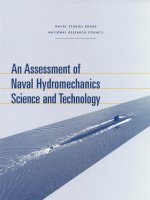
Figure 2. Affected aquaculture farms from inundation due to predicted sea level rise in Puttalam district in (a)
2025, (b) 2050 (c) 2075 and (d) 2100
NHA TRANG UNIVERSITY • 13
Journal of Fisheries science and Technology
The distribution of the aquaculture farms
(both operating and abounded) in Puttalam
district was determined by using area
calculation technique in ArcGIS 10.1 software
and the total area of aquaculture farms in this
district was recorded to be 6766 ha by the
middle of 2016.
The total areas of aquaculture farms to be
affected from predicted sea level rise in Puttalam
district were determined for the years of 2025,
2050, 2075 and 2100, after overlaying the
layer of the distribution of aquaculture farms in
the study area with inundations layers for the
years of 2025, 2050, 2075, and 2100 by using
ArcGIS 10.1 software. The obtained prediction
values revealed that 2216 ha, 2280 ha, 2426
ha and 2547 ha of aquaculture farm areas in
this district will be affected by inundations due
to the predicted sea level rise in 2025, 2050,
2075 and 2100, respectively (Figure 2a, 2b,
2c, 2d). Therefore, in Puttalam district 32.8%,
33.7%, 35.8% and 37.6% of aquaculture farm
areas will be irreversibly affected by the future
sea level rising by 2025, 2050, 2075 and 2100,
respectively.
1. Predicted impacts of sea level rise
According to the Intergovernmental Panel
on Climate Change (IPCC) report in 2007,
for the tropical Asia the most obvious climate
related impact is the sea “Level Rise”.
Furthermore it was also stated that this
densely settled area will be more vulnerable to
coastal erosion and land loss, inundation and
sea flooding and upstream movement the
saline/fresh waterfront, and etc. The national
climate change adaptation strategy, introduced
in December 2010, recognizes the importance
of sea level rise and changes in the oceanic
environment under the areas of fisheries,
urban development, and human settlements
(Rodrigo and Senaratne, 2014).
There are two main causes for sea level
rise: melting of ice and expansion of ocean
water from warmer ocean temperatures. It was
14 • NHA TRANG UNIVERSITY
No.3 - 2016
estimated approximately 15 - 20 cm sea
level rise worldwide during the last century,
out of which 2 - 5 cm has resulted from
melting ice and 2 - 7 from the expansion of water.
The forecasts for global sea level rise in
this century vary considerably, but the
Inter-governmental Panel on Climate Change
(IPCC, 2007) has provided a central estimate
of 0.2 m and 0.5 m rise by the years 2050 and
2100, respectively. According to Sri Lanka
Disaster Knowledge Network (2009), the mean
rate of current sea level rise of SL is 1.8 mm
per year for the past century. More recently it
was found during the satellite altimetry era of
sea level measurement, at rates in the range
of 2.9 - 3.4 ± 0.4 - 0.6 mm per year from 1993 2010. All in all it is obvious that global warming
is the main cause of this sea level rise which
results due to anthropogenic activities such as
burning coal and oil as well as deforestation
which ultimately leads to increase the
atmospheric concentration of heat trapping
gases (Union of Concerned Scientists, 2013).
2. Impacts of sea level rise on shrimp
farming in Sri Lanka
Out of all the fisheries products in the
export market shrimp comprises the highest
value. Production of shrimp has declined
during recent years mainly due to civil war
conflicts as well as due to disease outbreaks
and unsustainable farming practices. When
considering the coastal resources for the
shrimp culture in Sri Lanka thirteen of the twenty
four administrative districts in Sri Lanka have
maritime boundaries and the development
of the coastal aquaculture is limited to these
districts (Wijegoonawardena and Siriwardena,
1996). Furthermore it was also highlighted that
majority of areas suitable for shrimp farming is
located in the northwestern areas with a
significant potential in the southern coastal
areas also (NARA, 1989). In the year 2007,
farmed shrimp export accounts for nearly 50%
of the total export earnings from the Sri Lankan
Journal of Fisheries science and Technology
fisheries (FAO, 2004). Japan is the leading
shrimp exporter from Sri Lanka and the black
tiger shrimp, Penaeus monodon is the main
species cultured (Munasignhe et al, 2010).
With sea level rise an additional issue is
the sinking shoreline causing loss of mangrove
forest protection and increases the chances of
coastal subsidence erosion and storm
damage goes up (Huxham, 2015). Location
of the river estuaries would be triggered by
sea level rise causing a great change in
fish habitat and their breeding grounds. For
example, Penaeid prawns are bred and
developed in brackish water (where salt and
fresh water mixed up). Yet due to the sea level
rise it causes this interface backward changing
habitat of prawn. When considering a different
sea level rise phenomenon for instance
flooding; it causes massive harm to the sector
by overflowing shrimp pond and let the shrimps
to set free in open water (Sarwar, 2005).
IV. CONCLUSION
For Sri Lanka climate change has a
significant impact on many vital livelihood
opportunities and precious ecosystems.
Fisheries and aquaculture are also two of the
No.3 - 2016
most impacted fields. Sea level rise has found
to be the most hazardous impact on the Sri
Lankan fisheries. Since we cannot alter the
nature, there is only one rational way to tackle
with this phenomenon that is adapting with the
upcoming challengers by trying to mitigate the
causes of the impacts of the climate change.
Sri Lankan government together with certain
other parties are running at its maximal
capacity to find adaptation measures towards
these impacts of climate change. As a
concluding remark it needs to be said that
the best approach to cope with the impacts of
climate change on the fisheries and aquaculture
in Sri Lanka is to enhance the adaptive
capacities of the livelihoods who engage in that
field and as well as to enhance the research
possibilities in search of finding technically vital
mitigation methods for both the humans and
marine inland ecosystems, to cope up with
theses impacts. Concerning more on the
adaptive measures, responsible parties should
make sure that the upcoming aquaculture
farms in the areas such as Puttalam are
built after taking into account the predicted
inundation levels due to Sea Level Rise.
REFERENCES
1.
Athulathmudali S, Balasuriya A, Fernando K., 2011. An Exploratory Study on Adapting to Climate Change
in Coastal Areas of Sri Lanka Working Paper no 02/2011, Published by NTNU Globalization Research
Programme, Faculty of Humanities Norwegian University of Science and Technology N 7491 Trondheim.
2.
Basnayake, S., 2004. Impacts & Adaptation to Climate Change - A Sri Lankan Perspective. Paper presented in
SICCIA 28th June - 2nd July 2004, Grainau, Germany
3.
CCD, 2006. Revised Coastal Zone Management Plan. Coast Conservation Department and the Ministry of
Fisheries and Aquatic Resources.
4.
Climate Change Secretariat and Ministry of Environment Sri Lanka, 2010. Sector vulnerability profile:
Agriculture and Fisheries: 37-44, Accessed on; 1st of October 2015, Available at: www.climatechange.lk
5.
Delgado, C. L., Wada, N., Rosegrant, M. W., Meijer, S. & Ahmed, M. Fish to 2020: Supply and demand in
changing global markets. International Food Policy Research Institute and Worldfish Center, 2003.
6.
FAO, National Aquaculture Sector Overview. National aquaculture sector overview - Sri Lanka. National
Aquaculture Sector Overview Fact Sheets. Text by Siriwardena, P. P. G. S. N., in FAO Fisheries and Aquaculture
Department [online], Rome, Italy, 2004, />NHA TRANG UNIVERSITY • 15
Journal of Fisheries science and Technology
No.3 - 2016
7.
Huxham M, 2015. How Shrimp Farming Wreaked Havoc on Sri Lanka’s Coasts, ELSEVIER SciTech Connect,
IPCC, 2007. Sea Level Rise Hazard Profiles of Sri Lanka [PDF], available at ; />hazard/Report/UNDP%20BOOK%20CHAP%2007_%20SEA%20LEVEL%20RISE.pdf
8.
Mawilmada N, et al., 2010. Sector Vulnerability Profile: Agriculture and Fisheries, Prepared with assistance
from ADB TA 7326 (SRI) Strengthening Capacity for Climate Change daptation Implemented by: Climate
Change Secretariat Ministry of Environment Sri Lanka, Accessed on; 10th of October 2015 Available at; www.
climatechange.lk
9.
Michel, D. and Pandya, A., 2010. Coastal Zones and Climate Change, ISBN: 978-0-9821935-5-6 [pdf]
10. Munasinghe M.N, Stephen C, Abeynayake P,Abeygunawardena I.S., 2010. Shrimp Farming Practices in the
Puttallam District of Sri Lanka: Implications for Disease Control, Industry Sustainability, and Rural Development,
Veterinary Medicine International, Volume 2010 (2010), Available at; />11. NARA, 1989. Identification of suitable sites for shrimp farming: Phase I. North western coastal belt.
A consultancy report for Export Development Board and National Development Bank. National Aquatic
Resources Agency (NARA), Colombo, Sri Lanka, 291 p.
12. Rodrigo C, Senaratne A.. 2014. Adapting Sri Lanka’s coasts and ocean resources to a changing climate Accessed on; 4th of October 2015, See more at: />13. Sarwar G.M, 2005. Impacts of Sea Level Rise on the Coastal Zone of Bangladesh, Lund University, pdf.
14. The Ministry of Fisheries & Aquatic Resources Development, 2016. Ministry reports about the Ministry,
Available at; http://www.fisheries.gov.lk/content.php?cnid=abt_mnstry
15. Union of Concerned Scientists, 2013. Causes of Sea Level Rise, Fact Sheet [PDF], Available at; http://www.
ucsusa.org/sites/default/files/legacy/assets/documents/global_warming/Causes-of-Sea-Level-Rise.pdf
16. Weerakoon, D.E.M., and P.P.G.S.N. Siriwardena, 1988. Final report on cage and pen culture roject to the
International Development Research Centre, Canada. Inland Fisheries Division, Ministery of Fisheries,
Colombo, Sri Lanka, 80 p.
17. Wijegoonawardena, P.K.M., and P.P.G.S.N. Siriwardena, 1996. Shrimp farming in Sri Lanka: Health
management and environmental considerations. In Health Management in Asian Aquaculture. Proceedings of the
Regional Expert Consultation on Aquaculture Health Management in Asia and the Pacific. R.P. Subasinghe,
J.R. Arthur & M. Shariff (eds.):127-139. FAO Fisheries Technical Paper No. 360, Rome, FAO. 142p
16 • NHA TRANG UNIVERSITY
Journal of Fisheries science and Technology
No.3 - 2016
EFFECT OF CATION CONCENTRATIONS (K+, Ca2+) AND HORMONAL
STIMULATION ON SPERM MOTILITY OF COMMON CARP
Cyprinus carpio
Le Minh Hoang1, Pham Phuong Linh1
Received: 25/1/2016; Revised: 08/7/2016; Accepted: 26/9/2016
ABTRACT
Semen quality assessment through sperm motility plays an important role in the production of artificial
fish and contributes to the preservation of fish sperm more effectively. This study aims to evaluate the effect of
cation concentrations and hormonal stimulation on sperm motility of common carp. Experiments on the effect
of cation concentrations use two types of cations in the following concentrations: Ca2+ (0.5; 2.5; 5 mM) and
K+ (5; 25; 50 mM), then use the best cation concentration to check the effects of the injection of the hormone
on sperm motility. The results showed that the best cation concentration was 50 mM (K+) and 2.5 mM (Ca2+).
These parameters before and after hormonal stimulation showed no difference. The results of this experiment
can help us to create an environment for carp sperm activity based on the above parameters.
Keywords: Carp, Cyprinus carpio, cation, hormone stimulation
I. INTRODUCTION
Spermatozoa of both marine and freshwater
fish species are immotile in the testis and
seminal plasma. Motility of spermatozoa
occurs after they are released into surrounding
aqueous
environment
during
natural
reproduction or into a diluents artificial
reproduction (Islam and Akhter 2011).
Spermatozoa motility is a prerequisite
parameter in determining fish semen quality
and fertilizing capacity (Le et al. 2011).
However, spermatozoa motility is also
influenced by several factors such as:
temperature, dilution ratio, different diluents,
ion concentration or osmolality (Le et al. 2011)
and time after hormonal stimulation (Kowalski
et al. 2012).
Some studies have carried out with
Persian surgeon - Acipenser persicus (Alavi
et al. 2004), European perch - Perca fluviatilis
(Alavi et al. 2007), yellow croaker - Larimichthys
polyactis (Le et al. 2011), tiger grouper Epinephelus fuscoguttatus (Hoang and Le,
2014). Le and Hoang (2015) reported the
1
effects of diluent ratio, diluents and osmolality
on sperm motility of common carp. Up to now,
there are no studies those related to the effect of
cation concentration and hormonal stimulation
on sperm motility have been done in common
carp spermatozoa.
Common carp is traditional species of
Vietnam. It distributes in ponds, lakes, from
Northern to Southern. Besides, it has high
commercial value on the market. Nowadays,
the indiscriminate exploitation of the wild with
the introduction of new multi-line carp gradually
causes the loss of pure carp seed. The
determination of the optimal environmental
factors for sperm motility of common carp
has an important role in enhancing the rate of
fertilization as well as helps preserve carp
sperm more effectively so that we will preserve
pure carp seed varieties to cater for the breeding
and protection of genentic resources. However,
there is no research or publication on the effect of
cation concentration and hormonal stimulation
on sperm motility of common carp in Vietnam.
Therefore, this study aims to evaluate the
Institute of Aquaculture, Nha Trang University (NTU), Vietnam
NHA TRANG UNIVERSITY • 17
Journal of Fisheries science and Technology
effect of cation concentrations and hormonal
stimulation on sperm motility of common carp.
II. MATERIALS AND METHODS
All experiments were carried out at the
Institute of Aquaculture in Nha Trang University.
Male carp were collected from the wild and
then semen were stripped in 1.5 ml eppendofe
and held on ice and immediately brought to the
laboratory for observation and analysis.
Spermatozoa motility (SM) assessment:
SM was determined immedicately after semen
collection. The percentage of sperm exhibiting
rapid, vigorous and forward movement were
classified under a microscope by diluting the
sperm into distilled water at ratio 1:100 (mixing
1µl semen and 99 µl distilled water).
* Effect of cation concentrations on SM:
To assess the effect of cation concentrations
on motility, semen was diluted at ratio 1:25 in
cation solution concentrantions: KCl (5 mM,
25 mM or 50 mM) and CaCl2 (0.5 mM, 2.5
mM, 5mM). Then, check SM and analyse this
results to find the optimal cation concentration.
* Effect of injection hormone on SM: All
treatments of effect of injection hormone
on motility were conducted similar to the
above experiments. Males were injected with
No.3 - 2016
hormone LHRHa. Then semen was stripped
after 6 hours and 12 hours. These sperm were
tested by the best dilution ratio 1:25, the best
diluents as 0.3% NaCl, the best osmolality at
100 mOsm/kg (Le and Hoang, 2015) and the
best ion Ca2+ and ion K+ (in this study).
Data representing influence of dilution
ratio, diluents and cation concentration on
motility were analyzed by one-way ANOVA
using SPSS 16.0. Results are presented
as mean±standard error. Difference with a
probability value (P) of 0.05 (P<0.05) were
considered significant.
III. RESULT AND DISCUSSION
1. Effect of K+ and Ca2+ concentrations on
sperm motility
1.1. Ion K+
Effect of the change of ions and osmotic
pressure level of ambient environment on SM
has demonstrated by Morisawa (Seifi et al.
2011) and they have considered as two
factor of influence SM. In family carp, ion K+
may increase velocity and motile sperm so that
channel K+ has capacity inhibited movement
of sperm flagellum (Islam and Akhter 2011).
Effect of K+ concentration was described in
Figure 1.
Figure 1. Effect of K+ concentrations on sperm motility of common carp.
Values with different alphabetic letters on each bar indicate significant difference between concentrations of K+ (P<0.05)
18 • NHA TRANG UNIVERSITY
Journal of Fisheries science and Technology
The results showed in Figure 1 indicated
that the best concentration of K+ is 50 mM with
time and percentage motility is 835.5±292.2 s
and 92.5±1.1%, respectively. No significant
difference between concentrations of 5, 25 or
50 mM, however, time motility at 5 and 25 mM
is lower than 50 mM. Alavi et al (Alavi and
Cosson 2006) also indicated the same result
that solution containing 50-200 mM KCl is
able to stimulate SM effectively. Increasing the
concentration of K+ of solution also increase
velocity of SM in European perch - Perca
fluviatilis and the best SM has observed at
50 mM K+ but ion K+ has no significant effect
on the proportion SM. In general, the highest
No.3 - 2016
percentage motility has observed at
concentration of K+ above 20 mM when
measured within 15 s after activation (Alavi et
al. 2007). For yellow croaker - Larimichthys
polyactis, the best SM at concentration of 0.4 M
(Le et al. 2011). Therefore, the concentration of
K+ is different on each fish species.
1.2. Ion Ca2+
Sperm motility can be initiated by alteration
of the concentration of Ca2+ ions in many
species, such as in cyprinids (Islam and Akhter
2011). The presence of extracellular Ca 2+
is necessary for the initiation of SM in carp
(Krasznai et al. 2000). Effect of concentrations
Ca2+ on SM in carp was described in Figure 2.
Figure 2. Effect of Ca2+ concentrations on sperm motility of common carp.
Values with different alphabetic letters on each bar indicate significant difference between concentrations of Ca2+ (P<0.05)
The result showed that the optimal
concentration of Ca2+ in carp sperm is 2.5 mM
with time and percentage motility is 51±0.5 s
and 86.6±2.5%, respectively. At concentrations
of 0.5 or 5 mM, motile time is 46.3±1.7 s and
40.8±2.4 s. No significant difference between
concentrations of Ca2+. Some studies have
indicated that the role of concentration Ca2+ in
increasing sperm motility patameters includes
time total motility, percentage motility and
velocity of sperm. Studying on European
perch-Perca fluviatilis indicated that the
concentration of Ca2+ at 2.5 mM increased
motile sperm percentage (Alavi et al. 2007).
For yellow croaker-Larimichthys polyactis,
the highest motile sperm obtained in solution
containing 0.2 M CaCl2 (Le et al. 2011).
When extracellular Ca2+ enters into the cell
membrane of sperm, it will increase the
concentration of intracellular Ca2+ and
stimulate sperm motility. Therefore, Ca2+ is an
important ion to stimulate motile sperm.
2. Effect of hormonal stimulation on sperm motility
Using hormone to stimulate maturation of
gonad fish is a popular factor in aquaculture
(Zohar and Mylonas 2001). Wild carp
stimulation to produce of milt in captivily
requires hormonal (Seifi et al. 2011). Comparing
effect of injecting hormone on SM was
described in Figure 3.
NHA TRANG UNIVERSITY • 19
Journal of Fisheries science and Technology
No.3 - 2016
Figure 3. Sperm motility in relation time of hormonal stimulation.
Different alphabetic letters on each bar indicate significant difference (P<0.05)
The activation medium as NaCl 0.3%
was used to analyse the motile sperm before
and after hormone injection. After analyzing,
the result showed that there is no significant
difference (P>0.05). At concentration of 100
mOsm/kg, 24 hours after injection, motile
sperm increased slightly but not with significant
difference (P>0.05) for both K+ and Ca2+ ions.
Studying on other species, Krol et al (Krol et al.
2009) observed time of motile sperm in
European smelt-Osmerus eperlanus increase
when stimulating by ovaprim+domperidone.
For European eel-Anguilla Anguilla, injection
of HCG does not effect SM (Austriano et
al. 2006). Frequently, using hormone to
stimulate releasion of sperm in carp does not
effect sperm motility.
IV. CONCLUSION AND RECOMMENDATION
- The optimal ion K+ concentration was
50 mM with time and percentage motility
835.5±292.2 s and 92.5±1.1%, respectively
- The optimal ion Ca2+ concentration was
2.5 mM with motile time at 51±0.5 s and
percentage of motile sperm at 86.6±2.5%.
- Be able to use NaCl 0.3%, medium 100
mOsm/kg, medium KCl 50 mM and CaCl2 2.5 mM
for
evaluating
parameters
sperm
before
motility
and
after
but
these
hormonal
stimulation show no difference.
- Future research should use another
hormones and fertility test for evaluating sperm
motility.
REFERENCES
1.
Alavi S.M.H. and Cosson J., 2006. Sperm motility in fishes. (II) Effects of ions and osmolality: A review. Cell
Biology International, 30:1-14.
2.
Alavi S.M.H., Cosson J., Karami M., Amiri M.B. and Akhoundzadeh M.A., 2004. Spermatozoa motility
in the Persian sturgeon, Acipenser persicus: effects of pH, dilution rate, ions and osmolality. Reproduction,
128:819-828.
20 • NHA TRANG UNIVERSITY
Journal of Fisheries science and Technology
No.3 - 2016
3.
Alavi S.M.H., Rodina M., Policar T., Kozak P., Psenicka M. and Linhart O., 2007. Semen of Perca fluviatilis
L.: Sperm volume and density, seminal plasma indices and effects of dilution ratio, ions and osmolality on sperm
motility. Theriogenology, 68: 276-283.
4.
Austriano J.F., Mrco-Jimenez F., Perez L., Balasch S., Garzon Penaranda D.L., Vicente D.S., Viudes-de-Castro
J.S. and Jover M., 2006. Effect of HCG as spermiation inducer on European eel semen quality. Theriogenology,
66:1012-1020.
5.
Bastami K.D., Imanpour M.R. and Hoseinifar S.H., 2010. Sperm of feral carp Cyprinus carpio: optimization of
activation solution. Aquaculture International, 18: 771-776.
6.
Cabrita E., Robles V. and Herráez P., 2009. Sperm quality assessment. In: E. Cabrit, V. Robles, and P. Herráe
(eds). Methods in Reproductive Aquaculture Marine and Freshwater Species: CRC Press Taylor & Francis
Group:93-149.
7.
Cosson J., Groison L.A., Suquet M., Fauvel C., Dreanno C. and Billard R., 2008. Marine fish spermatozoa:
racing ephemeral swimmers. Reproduction September 1, 136:277-294.
8.
Islam S.M. and Akhter T., 2011. Tale of fish sperm and factors affecting Sperm Motility: A Review. Advances
in Life Sciences, 1:11-19.
9.
Krasznai Z., Marian T., Izumi H., Damjanovich S., Balkay L., Tron J. and Morisawa M., 2000. Membrane
hyperpolarization removes inactivation of Ca2+ channels, leading to Ca2+ influx and subsequent initiation of
sperm motility in the common carp. Proc. Natl Acad Sci USA, 97.
10. Krol J., Kowalski R.K., Hliwa A., Dietrich G.J., Stabinski R. and Ciereszko A., 2009. The effects of commercial
preparations containing two different GnRH analogues and dopamine antagonists on spermiation and sperm
characteristics in the European smelt Osmerus eperlanus. Aquaculture International, 286:328-331.
11. Kowalski R.K., Hliwa P., Cejko B.I., Krol J., Stabinski R. and Ciereszko A., 2012. Quality and quantity of
smelt (Osmerus eperlanus) sperm in relation to time after hormonal stimulation. Biology of Reproduction, 12:
231-246.
12. Lahnsteiner F., Berger B., Weismann T. and Patzner A.R., 1997. Sperm structure and motility of the freshwater
teleost Cottus gobio. Journal of Fish Biology, 50: 564-574.
13. Le M.H., Lim H.K., Min B.H., Park M.S., Son M.H., Lee J.U. and Chang Y.J., 2011. Effects of varying dilutions,
pH, temperature and cations on spermatozoa motility in fish Larimichthys polyactis. Environmental Biology,
32:271-276.
14. Le M.H. and Hoang H.G., 2015. Effect of dilutions ratio, diluents and osmolality on sperm motility in common
carp Cyprinus carpio. Journal of Fisheries Science and Technology, 4: 34-38.
15. Seifi T., Imanpoor R.M. and Golpour A., 2011. The Effect of Different Hormonal Treatments on Semen Quality
Parameters in Cultured and Wild Carp. Turkish Journal of Fisheries and Aquatic Sciences, 11:595-602.
16. Zohar Y. and Mylonas C.C., 2001. Endocrine manipulation of spawning induction in cultured fish from hormone
to gene. Aquaculture International, 197:99-139.
NHA TRANG UNIVERSITY • 21
Journal of Fisheries science and Technology
No.3 - 2016
EFFECT OF PACKAGING TO QUALITY AND SHELF-LIFE OF FRESH
SEA GRAPES (CAULERPA LENTILLIFERA J.AGARDH, 1837)
Le Thi Tuong1, Nguyen Thi My Trang1, Vu Ngoc Boi1, Nguyen Huu Dai2
Received: 23/8/2016; Revised: 20/9/2016; Accepted: 26/9/2016
ABSTRACT
Fresh sea grapes are succulent, soft, loose and easily perishable by environmental factors. The purpose
of this study was to determine the type of packaging which is suitable for preserving fresh sea grapes. Three
types of packaging, namely Polyamide (PA), Polypropylene (PP) and polyvinyl chloride (PVC) were used to
research. The results showed that while the shelf-life of sea grapes preserved in PVC was only 2 days, that in
PA, PP were up to 10 days. Moreover, the weight loss, the rate of damage and total aerobic microorganisms of
grape seaweeds preserved in PA were lower than that in PP. This means that suitable packaging will help to
maintain the quality and extend the shelf life of fresh sea grapes.
Keywords: Sea grapes, shelf-life
I. INTRODUCTION
Sea grapes (Caulerpa lentillifera, J.Agardh,
1837) is a seaweed belonging to species of
Caulerpa. They wereinternationally documented
since the 70s of the 16th century. They fully
contain essential nutrients, including fiber,
vitamins, amino acids, minerals and bioactive
compounds which can be seen as a potential
food. Sea grapes, nowadays, are significantly
cultured, growth and processed in many
countries such as Japan, China, Korea, India
and the Philippines [8, 9, 10, 11, 12, 13].
In Vietnam, sea grapes were known in
the early years of the 20th century. There had
been certain successful aquaculture research
in coastal areas in Khanh Hoa, Binh Thuan and
Phu Yen provinces [3]. The estimated capacity
reached up to 100 tons of fresh seaweed per
year in 2002. However, the characteristics of
sea grapes are succulent, soft-loose so immuno
ability and stability are low. Sea grapes are
easily perishable under room temperature [4].
Therefore, it is crucial to study suitable
containers to prolong self-life of sea grapes
and maintain its quality.
1
2
Faculty of Food Technology, Nha Trang University, Vietnam
Dai Phat B Plus Company, Cam Ranh city, Khanh Hoa province
22 • NHA TRANG UNIVERSITY
II. MATERIALS AND METHODS
1. Materials
Sea grapes: sea grapes were purchased
at Dai Phat B Plus Company, Cam Ranh city,
Khanh Hoa province. Then, the sea grapes
are immediately transported to a Nha Trang
University’s laboratory.
PA (Polyamide) containers were 20x30cm in
size and 0,9µm in thickness. These containers
were transparent and high-gloss surface.
Besides, they were high gas permeability
resistance, particularly resistance to oxygen
but low water vapor permeability. PP
(Polypropylene) containers were 20x30cm in
size and 0,6µm in thickness. PVC (Polyvinyl
chloride) containers were not plasticized and
20x30cm in size, 14µm in thickness. They
were transparent, high mechanical strength
and surface gloss. PVC containers were better
than PA and PP containers in water vapor and
gas permeability.
PA, PP and PVC containers were supplied
by the A Chau plastic packaging Co-operation
company. Tan Binh District, Ho Chi Minh City.
Journal of Fisheries science and Technology
No.3 - 2016
The containers were produced following food safety standards, particularly QCVN 12-1:2011/BYT
standard regarding plastic packaging containers that directly contact food [5].
2. Methods
2.1. Sampling and sample preparation
Sea grapes were harvested in the early morning, then transported to the laboratory. Next, they
were washed and re-growth before being storage. The number of each collection were around 6kg.
All experiments were run in triplicate.
2.2. General process
2.3. Experimental design
Washing: Washing removes impurities and
reduce the risk of damage during storage. Sea
grapes are washed with 15 liters sea water/1kg
in 7 minutes/time and washing times are 3. With
the above washing conditions, sea grapes are
clean and their quality is not affected.
Re-growth: To restore the health of harvested
sea grapes. They are re-grown with 1kg/40
liter of water for 3 days and the oxygen
concentration in the water is saturated. With
such conditions, the texture and color of sea
grapes are improved the best.
Centrifugation: In order to remove water
on sea grape surfaces after re-growth process
and reduce damage during storage, the sea
grapes are centrifuged at the speed of 120 rpm
for 2 minutes. With these conditions, water is
removed significantly and the quality of the sea
grapes are not affected.
Determination on the rate of sea grapes
that are damaged during storage time: Putting
exact 250g preliminarily treated sea grapes
in PA, PP and PVC containers, then securely
closing the lid. All samples were stored at room
temperature (290C±1). They were checked for
every two days, damaged sea grapes were
collected, then weighted to determine the rate
of sea grapes damage during storage time.
Similar experimental designs were established
to determine the rate of weight loss, aerobic
bacteria total, and average sensory score of
sea grapes.
2.4. Analytical methods
The rate of weight loss and sea grapes
damage were determined by weighting
using a Germany electronic balance branded
QUINTIX SARTORIUS224-1S, scales 220g,
accuracy 10-4g
Damage features of sea grapes: sea
grapes’ trunks were soft, thrombocytes were
broken off and slimy. The color of sea grapes
turns to white or yellow or dark blue. There
stenches of rotting sea grapes.
Aerobic bacteria total was determined by
NMKL86:2006 [7] method.
Sensory quality assessment was conducted
following TCVN 3215- 79 [6]. There were 5
members in assessment board. All members
were equipped and trained with assessing
method before doing experiments.
2.5. Data analysis
All experiments were run in triplicate.
Analysis of variance (ANOVA) was performed
to compare difference with means at the
α = 0,05% significance level. Then SPSS
soft ware was applied to determine statistical
variance between means.
NHA TRANG UNIVERSITY • 23
Journal of Fisheries science and Technology
No.3 - 2016
III. RESULTS
1. Effect of packaging containers and storage time on total sensory scores
Figure 1. Effect of packaging containers and storage time on total sensory scores
a,b,c,d,e: Presenting statistical variance between pairs of means according to storage time; x, y: present statistical
variance between pairs of means according to packaging containers.
The results in figure 1 showed that the
packaging containers could strongly affect
the average sensory-score total regarding
storage time.
In term of PVC containers, after 2 days,
there was a significant decrease in sensory
quality of sea grapes, particularly average
sensory-score total was 20 at 0 storage day
then reduced to 4.2 after 2 days stored. This
means that the sea grapes were damaged
after 2 days. There was a similar trend
witnessed to control samples (without packaging).
In opposite, regarding PP containers,
samples were good at quality after 6 stored
days (scored at 16). However, after 8 days,
the sensory quality was at medium (11,2
points) while PA containers showed the
sensory quality was still at good (15,2 points)
after 10 days stored. Thus, the results
indicated that using PA containers provided
better sensory quality and longer shelf-life than
that using PP and PVC containers.
2. Effect of packaging containers and
storage time on weight loss
Figure 2. Effect of packaging containers and storage time on weight loss
a,b,c,d,e: Presenting statistical variance between pairs of means according to storage time; x, y: present statistical variance
between pairs of means according to packaging containers
24 • NHA TRANG UNIVERSITY
Journal of Fisheries science and Technology
No.3 - 2016
The results in figure 2 showed that the
variance between two forms of containers in
packaging containers could affect the weight
the first 6 stored days. However, the difference
loss regarding storage time. PVC containers
appeared after 6 stored days. For examples,
and the control samples (without packaging)
the weight loss after 10 stored days packed by
were seen to be significantly influenced.
For examples, after 2 stored days, PVC
containers and the control samples showed the
weight loss reached 35% in comparison to 0
stored day, while the weight loss was remarkably
PA was 11.9% while it was 15.5% in that by
PP containers. This means that PA containers
were less effect to weight loss than that of PP
and PVC containers.
lower (under 10%) in term of PA and PP
3. Effect of packaging containers and
containers. In addition, there was no statistical
storage time to sea grapes damage
Figure 3. Effect of packaging containers and storage time on sea grapes damage
a,b,c,d: Presenting statistical variance between pairs of means according to storage time; x, y: present statistical
variance between pairs of means according to packaging containers
As can be seen in Figure 3, the spoilage
containers after 4 stored days. While sea
rate of sea grapes increased in accordance
grapes which packed by PA containers had not
with storage time in almost samples. However,
appeared damage after 4 days, the damage
the increase depended on forms of containers.
For example, sea grapes which were packed
with PVC showed a remarkable increase in
the rate of damage. After 2 stored days, this
percentage was 39.4% in comparison to the
day of zero.
There was also difference in the spoilage
rates of sea grapes packed by PA and PP
was witnessed to samples packed by PP
containers, particularly low percentage (smaller
than 5%). After 10 days of storage, the damage
rate in sea grapes packed by PA and PP were
15.1% and 21.1%, respectively. This showed
that PA containers was better to be selected
than that of PP containers.
NHA TRANG UNIVERSITY • 25
Journal of Fisheries science and Technology
No.3 - 2016
4. Effect of packaging containers and storage time on total aerobic bacteria
Figure 4. Effect of packaging containers and storage time on total aerobic bacteria
a,b,c,d,e,f: Presenting statistical variance between pairs of means according to storage time; x, y, z: present statistical
variance between pairs of means according to packaging containers
Bacteria were important criteria which
directly effects on sea grapes damage and food
safety. Therefore, it was crucial to study the
variance of sea grapes related to storage time.
The results showed that the microbial population
significantly increased in samples packed
by PVC containers after 2 days of storage.
This number was 6 times more than of 0 day
of storage. Regarding control samples (without
packaging), the microbial population raised 5
times more than that of 0 days of storage.
Besides, there were moderate increases in
samples packed by PP and PA containers
during storage time.
Thus, the results in Figure 1; 2; 3 and 4
showed that PA were the best containers which
should be used to preserve fresh sea grapes.
PVC containers could preserve fresh sea
grapes in 2 days but it was 10 days to PA and
PP containers. However, the weight loss, the
rate of damage and aerobic bacteria total of
samples packed by PA containers were lower
than those of PP containers, and sea grapes
packed by PA containers also provided better
sensory quality than that of PP containers. This
couldexplain that PVC containers were able to
26 • NHA TRANG UNIVERSITY
be high gas and water vapor impermeability
(higher than those of PP containers and PA
containers) [1]. Therefore, during storage time,
respiratory speed increased leading to
increasing temperature and produced water
vapor so the sea grapes damaged quickly.
IV. CONCLUSION AND PETITION
1. Conclusion
Sea grapes packed by PVC containers
could be kept fresh in 2 days of storage but
PA and PP containers could be 10 days of
storage. However, weight loss, rate of spoilage and total aerobic bacteria of sea grapes
which were packed by PA containers were
lower than those of PP containers. Besides,
PA containers showed that the sensory quality
was maintained better than that of PP containers.
This means that, the selection of appropriate
packaging containers could maintain the
quality and prolong the shelf-life of fresh
sea grapes.
2. Recommendation
It is necessary to continue to study the
effects of temperature and storage conditions
to maintain the quality of fresh sea grapes.
Journal of Fisheries science and Technology
No.3 - 2016
REFERENCES
In Vietnamese
1.
Đống Thị Anh Đào, 2005. Kỹ thuật bao bì thực phẩm. NXB Đại học quốc gia Thành phố Hồ Chí Minh: 188-204.
2.
Hà Văn Thuyết, Trần Quang Bình, 2000. Bảo quản rau quả tươi và bán phế phẩm. NXB Nông Nghiệp.
3.
Nguyễn Hữu Đại, 2009. Di nhập và trồng rong nho biển (Caulerpa lntillifera) ở Khánh Hòa. Hội nghị khoa học
toàn quốc về sinh thái và tài nguyên sinh vật lần III. Hà Nội 22/10/2009: 942-949.
4.
Nguyễn Xuân Hòa, Nguyễn Hữu Đại, Nguyễn Thị Lĩnh, Phạm Hữu Trí, 2004. Nghiên cứu các đặc điểm sinh
lý, sinh thái của loài rong Nho biển (Caulerpa lentillifera) nhập nội có nguồn gốc từ Nhật Bản làm cơ sở nuôi
trồng. Báo cáo tổng kết đề tài cơ sở năm 2004, Phòng Thực vật biển, Viện Hải dương học Nha Trang, Nha Trang.
5.
Quy chuẩn quốc gia QCVN 12-1:2011/BYT về an toàn vệ sinh đối với bao bì, dụng cụ bằng nhựa tổng hợp tiếp
xúc trực tiếp với thực phẩm.
6.
Tiêu chuẩn quốc gia TCVN 3215-79. Đánh giá cảm quan chất lượng của các sản phẩm thực phẩm bằng phương
pháp cho điểm.
7.
Xác định tổng số vi sinh vật hiếu khí bằng phương pháp Nordic Committee on Food Analysis: Ủy ban Phân tích
thực phẩm Bắc Âu (MNKL86 - 2006).
In English
8.
Darcy-Vrillon B., 1993. Nutritional aspects of the developing use of marine macroalgae for the human food
industry. Int J Food Sc Nutr 44:23-35.
9.
Fleurence J., 1999. Seaweed proteins: biochemical, nutritional aspects and potential uses. Trends in Food
Science and Technology 10: 25-28
10. Fu L., X.-R. Xu, R.-Y. Gan, Y. Zhang, E.-Q. Xia & H.- B. Li, 2011. Antioxidant capacities and total phenolic
contents of 62 fruits. Food Chemistry 129(2): 345-350.
11. Matanjun P, Mohamed S, Mustapha NM, Muhammad K, Ming CH, 2008. Antioxidant activities and
phenolics content of eight species of seaweeds from north Borneo. J Appl Phycol DOI 10.1007/s10811007-9264-6
12. Nisizawa K., H. Noda, R. Kikuchi and T. Watanabe, 1987. The main seaweed food in Japan. Hydrobilologia
151/152: 5-29.
13. Trono G. C. & Jr. (1988), Manual on seaweed culture: Pond culture of Caulerpa, Manual No.3. ASEAN/ SF/88.
NHA TRANG UNIVERSITY • 27