Study on the interaction of paeoniflorin with human serum albumin (HSA) by spectroscopic and molecular docking techniques
Bạn đang xem bản rút gọn của tài liệu. Xem và tải ngay bản đầy đủ của tài liệu tại đây (1.78 MB, 12 trang )
Xu et al. Chemistry Central Journal (2017) 11:116
DOI 10.1186/s13065-017-0348-3
Open Access
RESEARCH ARTICLE
Study on the interaction of paeoniflorin
with human serum albumin (HSA)
by spectroscopic and molecular docking
techniques
Liang Xu1, Yan‑Xi Hu1, Yan‑Cheng Li1, Yu‑Feng Liu1,2*, Li Zhang3, Hai‑Xin Ai3,4,5 and Hong‑Sheng Liu3,4,5*
Abstract
The interaction of paeoniflorin with human serum albumin (HSA) was investigated using fluorescence, UV–vis
absorption, circular dichroism (CD) spectra and molecular docking techniques under simulative physiological condi‑
tions. The results clarified that the fluorescence quenching of HSA by paeoniflorin was a static quenching process
and energy transfer as a result of a newly formed complex (1:1). Paeoniflorin spontaneously bound to HSA in site I
(subdomain IIA), which was primarily driven by hydrophobic forces and hydrogen bonds (ΔH° = − 9.98 kJ mol−1,
ΔS° = 28.18 J mol−1 K−1). The binding constant was calculated to be 1.909 × 10³ L mol−1 at 288 K and it decreased
with the increase of the temperature. The binding distance was estimated to be 1.74 nm at 288 K, showing the occur‑
rence of fluorescence energy transfer. The results of CD and three-dimensional fluorescence spectra showed that
paeoniflorin induced the conformational changes of HSA. Meanwhile, the study of molecular docking also indicated
that paeoniflorin could bind to the site I of HSA mainly by hydrophobic and hydrogen bond interactions.
Keywords: Paeoniflorin, Human serum albumin, Fluorescence quenching, Molecular docking
Introduction
Radix Paeoniae Rubra (RPR), the dried root of Paeonia
lactiflora Pall or Paeonia veitchii Lynch, has been widely
used by Chinese medicine practitioners to treat cardiovascular, inflammation and female reproductive diseases
[1]. Based on the principle of Chinese medicine, historical literatures described RPR with the functions of tonifying blood, cooling blood, cleansing heat and invigorating
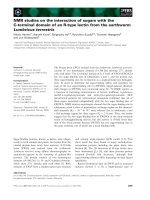
blood circulation [2]. The most abundant and active components in RPR are identified as paeoniflorin (PF) [3,
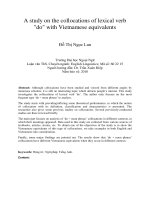
4] (C23H28O11, Fig. 1), which is reported to have many
biological properties including antipyretic, antiallergic,
*Correspondence: ;
2
Natural Products Pharmaceutical Engineering Technology Research
Center of Liaoning Province, Shenyang 110036, People’s Republic
of China
3
School of Life Science, Liaoning University, Shenyang 110036, People’s
Republic of China
Full list of author information is available at the end of the article
antioxidative, antiinflammatory, and anxiolytic activities
[5–7].
Protein is an important chemical substance in our life
and one of the main targets of all medicines in organism.
Human serum albumin (HSA) is the most studied serum
albumin because its primary structure is well known and
it can interact with many endogenous and exogenous
substances [8]. It is a single-chain, non-glycosylated globular protein consisting of 585 amino acid residues, and 17
disulfide bridges assist in maintaining its familiar heartlike shape [9]. Crystallographic data show that HSA contains three homologous a-helical domains (I, II, and III): I
(residues 1–195), II (196–383), and III (384–585), each of
which includes 10 helices that are divided into six-helix
and four-helix subdomains (A and B) [9]. The principal regions of ligand binding sites in HSA are located in
hydrophobic cavities in subdomains IIA and IIIA, called
site I and site II, respectively [10]. These multiple binding sites underline the exceptional ability of HSA to act
as a major depot and transport protein which is capable
© The Author(s) 2017. This article is distributed under the terms of the Creative Commons Attribution 4.0 International License
( which permits unrestricted use, distribution, and reproduction in any medium,
provided you give appropriate credit to the original author(s) and the source, provide a link to the Creative Commons license,
and indicate if changes were made. The Creative Commons Public Domain Dedication waiver ( />publicdomain/zero/1.0/) applies to the data made available in this article, unless otherwise stated.
Xu et al. Chemistry Central Journal (2017) 11:116
Page 2 of 12
theoretical results. By comparing our results with those
of previous studies, we can investigate the similarities
and differences between paeoniflorin and two kinds of
serum albumin.
Experimental
Materials
Fig. 1 The structure of paeoniflorin
of binding, transporting and delivering an extraordinarily diverse range of endogenous and exogenous compounds in the bloodstream to their target organs [11].
The binding affinity between serum albumin and many
bioactive compounds is closely linked with the distribution and metabolism of these active ingredients [12–14].
Therefore, investigation of the binding of drug to HSA is
of great importance to understand its effect on protein
function during the blood transportation process and its
biological activity in vivo.
HSA and BSA, two of the most extensively studied
serum albumins, are homologous proteins. However,
there are still some differences between them [15]. HSA
contains a single tryptophan (Trp-214) [9], while BSA
has two tryptophan residues that possess intrinsic fluorescence: Trp-212 is located within a hydrophobic binding pocket of the protein and Trp-134 is located on the
surface of the molecule [16]. Therefore, the experimental
results of the interaction between drugs and BSA cannot be completely identical with those of HSA. Although
some spectroscopic studies on the interaction between
paeoniflorin and bovine serum albumin (BSA) have been
published [17–20], to our knowledge, a series of accurate
and full basic data for clarifying the binding mechanisms
of paeoniflorin to HSA remain unclear. Consequently, the
binding characteristics of paeoniflorin with HSA including the quenching mechanism, quenching and binding
constants were investigated in this study, by using fluorescence quenching method through the thermodynamic
analysis. In addition, the conformational changes of HSA
induced by paeoniflorin were also investigated by means
of circular dichroism (CD) and three-dimensional fluorescence measurements. Finally, paeoniflorin molecule
has been docked into the 3D structure of HSA in order
to envisage a connection between the experimental and
Commercially prepared human serum albumin (HSA,
purity > 99.0%) was purchased from Sigma-Aldrich
Co. (USA), and stored in refrigerator at 4.0 °C. Paeoniflorin, ibuprofen and warfarin were purchased from the
National Institute for the Control of Pharmaceutical and
Products (China). Samples were weighed accurately on a
microbalance (Sartorius BP211D, Germany) with a resolution of 0.01 mg. The stock solutions of paeoniflorin,
warfarin and ibuprofen (each 1.25 × 10⁻³ mol L−1) were
prepared with 0.05 mol L−1 Tris–HCl buffer containing
NaCl (0.05 mol L−1, pH 7.4). The HSA stock solution
was dissolved and diluted to 1.0 × 10⁻⁵ mol L−1 with the
same buffer, then was stored in the dark at 4 °C before
fluorescence and UV–vis absorption essay. In the analysis
of CD spectra, HSA stock solution (1.0 × 10⁻⁶ mol L−1)
was prepared with phosphate buffer (0.05 mol L−1, pH
7.4). All other reagents were all of analytical reagent
grade and were used as purchased without further purification. Double distilled water was used for all solution
preparation.
Methods
Fluorescence spectra
All the fluorescence spectra were carried out on an
F-7000 fluorescence spectrophotometer (Hitachi Hightechnologies Co., Japan) equipped with a thermostatic
bath. The fluorescence measurements were performed
at three temperatures (288, 298, 310 K) in the range
of 200–700 nm. The concentration of HSA was fixed
at 1.0 × 10⁻⁵ mol L−1 and the concentrations of paeoniflorin changed from 0 to 1.25 × 10⁻⁵ mol L−1 at
2.5 × 10⁻⁶ mol L−1 intervals. The excitation and emission slit widths were both set at 5 nm. An excitation
wavelength of 280 nm was set and the temperature of
samples was maintained by recycling water during the
whole experiment. All fluorescence titration experiments
were done manually by the 25 μL microsyringe [21, 22].
In this work, the absorption wavelength of paeoniflorin
was overlapped with the absorption wavelength of HSA.
Thus, the fluorescence intensities of all HSA solutions
were corrected for the inner-filter effect of fluorescence
according to the following equation [23, 24]:
Fcorr = Fobs × e (Aex + Aem )/2
where F
corr and F
obs are the fluorescence intensity corrected and observed at the emission wavelength,
Xu et al. Chemistry Central Journal (2017) 11:116
respectively. Aex and A
em are the absorbance of HSA at
the excitation and emission wavelengths, respectively.
UV–vis absorption spectra
The UV–vis absorption spectra were recorded on a
UV-2550 spectrophotometer (Shimadzu Co., Japan) over
a wavelength range of 200–700 nm in a pH 7.4 Tris–HCl
buffer at 298 K. Spectra of free paeoniflorin and paeoniflorin with 2.5 mL HSA solution were both measured.
The concentrations of paeoniflorin varied from 0 to
5.0 × 10⁻⁵ mol L−1 at 1.0 × 10⁻⁵ mol L−1 intervals.
Binding competitive experiment
Two classical site probes, warfarin and ibuprofen, were
selected as the markers of site I and site II separately.
The concentrations of HSA and paeoniflorin were both
fixed at 1.0 × 10⁻⁵ mol L−1, while the concentrations
of the probes varied from 0 to 2.5 × 10⁻⁵ mol L−1 at
5.0 × 10⁻⁶ mol L−1 intervals. The experiment was carried
out at room temperature. The wavelength range and the
excitation wavelength remained unchanged [25].
Circular dichroism (CD) spectra
The CD spectra were measured on a J-810 automatic
recording spectropolarimeter (Jasco Co., Japan) in the
spectral range 200–240 nm under constant nitrogen
flush. The solutions of HSA (1.0 × 10⁻⁶ mol L−1) and
paeoniflorin (2.5 × 10⁻⁵ mol L−1) were both prepared
with phosphate buffer.
Molecular docking
The molecular docking studies were performed to
explore the interaction between paeoniflorin and HSA by
using AutoDock program version 4.2.5.1 and AutoDockTools version 1.5.6, which is the graphical user interface
of AutoDock supplied by MGL Tools [26]. The 3D structure of ligand (paeoniflorin) was constructed by ChemDraw. The default root, rotatable bonds and torsions of
the ligand were set by AutoDockTools. The crystal structure of the Human Serum Albumin (PDB ID: 1AO6) was
downloaded from the protein data bank (http://www.
rcsb.org/pdb). All bound waters were removed from
the protein using Pymol version 1.8.2.0. Polar hydrogen atoms were added, and AutoDock 4 atom types and
Geisteger charges were assigned to the receptor protein
using AutoDockTools. The docking site for the ligands
on HSA was defined at the active site with grid box size
of 60 × 60 × 60, spacing of 0.375 Å, and grid centre of
33.175, 30.604, and 34.136. The AutoGrid4 utility in
AutoDock program was used to calculate the electrostatic map and atomic interaction maps for all atom types
of the ligand molecule. The Lamarckian Genetic Algorithm (LGA) was selected with the population size of 150
Page 3 of 12
individuals and with a maximum number of generations
and energy evaluations of 27,000 and 2.5 million, respectively. During the docking procedure, the ligand was
treated as flexible molecule and the receptor was kept
rigid. Finally, 100 possible binding conformations were
generated by AutoDock run. The best confirmation with
least binding energy was visualized and analyzed by using
PyMOl version 1.8.2.0 and Ligplot+ version 1.4.5 [27].
Results and discussion
Binding interaction of paeoniflorin with HSA
Quenching mechanism
It has been reported that the tryptophan, tyrosine and
phenylalanine residues give rise to the fluorescence of
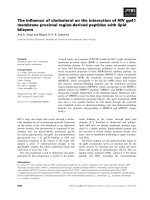
HSA [28]. As seen in Fig. 2, the emission of HSA was
found to decrease progressively with increasing concentrations of paeoniflorin, showing that HSA had interacted
with paeoniflorin.
Fluorescence quenching is usually classified into two
types: dynamic quenching and static quenching. It can be
distinguished by their different dependence on temperature and excited-state lifetime [23, 29]. For the dynamic
quenching, higher temperatures will result in faster diffusion and larger amounts of collisional quenching. Therefore the quenching constant values will go up with the
increase in temperature, but the reversed effect will be
observed for static quenching [30]. To analyze the fluorescence quenching mechanism, the Stern–Volmer equation [31] was used:
F0 /F = 1 + KSV [Q] = 1 + Kq τ0 [Q]
F0 and F represent the fluorescence intensities of paeoniflorin in the absence and presence of the quencher,
respectively. [Q] denotes the concentration of the
quencher. KSV, Kq, τ0 are the Stern–Volmer dynamic
quenching constant, the quenching rate constant of the
biomolecule (Kq = KSV/τ0), and the average lifetime of the
fluorophore in the absence of quencher (τ0 = 6.0×10⁻⁹ s)
[32], orderly.
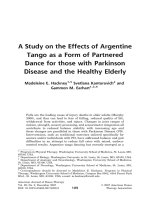
As it was presented in Fig. 3 and Table 1, all of the
three plots showed good linear relationship and the
dynamic quenching rate constant was larger than
the limiting diffusion constant of the biomolecule
(2.0 × 10¹⁰ L mol−1 s−1) [33]. All of the above in this
part declared that the quenching mechanism was static
quenching.
UV absorption measurement is a very simple method
and applicable to explore the complex formation [34,
35]. To confirm the result of fluorescence spectra, the
UV spectra of HSA with the absence and presence of
paeoniflorin were performed (Fig. 4). It revealed that
the absorption of paeoniflorin was weak and the peak
intensity of HSA rose with the addition of paeoniflorin.
Xu et al. Chemistry Central Journal (2017) 11:116
Fluorescence Intensity
1000
a
F0 /F
a 1200
Page 4 of 12
f
1.06
1.04
600
400
1.02
200
b 1200
1.00
350
400
Wavelength (nm)
450
800
200
0.9
1.2
[paeoniflorin] (10-5 mol/L)
Binding constants and the number of binding sites
0
300
350
400
Wavelength (nm)
450
c 1200
To further elucidate the binding constants (Ka) and the
number of binding sites (n), the modified Stern–Volmer
equation was used [37]:
lg[(F0 − F)/F] = lg Ka + n lg [Q]
a
f
600
400
200
0
300
0.6
there was an interaction between paeoniflorin and HSA
and a protein–ligand complex with certain new structure
was formed [36]. And the quenching mechanism was the
same as that of with BSA [18].
400
800
0.3
f
600
1000
0.0
Fig. 3 Stern–Volmer plots of HSA + paeoniflorin solutions with
paeoniflorin concentrations (from 0.0 × 10⁻⁵ to 1.25 × 10⁻⁵ mol L−1
at 2.5 × 10⁻⁶ mol L−1 intervals) at three temperatures
([HSA] = 1.0 × 10⁻⁵ mol L−1)
a
1000
Fluorescence Intensity
288 K
298 K
310 K
800
0
300
Fluorescence Intensity
1.08
350
400
Wavelength (nm)
450
Fig. 2 Fluorescence spectra of HSA + paeoniflorin solu‑
tions with paeoniflorin concentrations (a–f ) (from 0.0 × 10⁻⁵
to 1.25 × 10⁻⁵ mol L−1 at 2.5 × 10⁻⁶ mol L−1 intervals)
([HSA] = 1.0 × 10⁻⁵ mol L−1, T = 288 K (a); 298 K (b); 310 K (c))
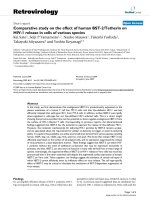
In addition, the inset in Fig. 4 demonstrated that the
absorption values of simply adding free HSA and free
paeoniflorin were obviously lower than those of HSA–
paeoniflorin mixed solutions with the increasing concentrations of paeoniflorin. These results indicated that
where Ka and n represent the binding constant and the
number of binding sites, respectively. The other parameters in the equation have the same meaning as the Stern–
Volmer equation above.
A linear plot based on lg [(F0 − F)/F] versus lg [Q] is
expected, and n and Ka can be estimated from the slope
and intercept.
The double logarithm plots at different temperatures
were presented in Fig. 5 and the related statistics were
listed in Table 1. The Ka values were in the order of 1
0 3,
revealed the binding of HSA–paeoniflorin complex was
weak. The binding constant (Ka) is especially significant
to understand drug distribution in plasma. The drug like
paeoniflorin with low binding constants of protein can
improve the plasma concentrations of free drug, and
then enhance its distribution and pharmacological effect
[22]. Hence paeoniflorin usually has fast elimination and
short maintenance time in vivo, which is in accordance
with previous studies [38, 39]. In addition, it was clear
that Ka declined as the temperature was on the rise, indicating that the stability of HSA–paeoniflorin complex
decreased with the increasing temperature [40]. Besides,
Xu et al. Chemistry Central Journal (2017) 11:116
Page 5 of 12
Table 1 Quenching constants (KSV and Kq), stability constants (Ka), correlation coefficients (R) and binding site numbers (n) and thermodynamic parameters calculated according to Stern–Volmer plots and double logarithm plots
of HSA + paeoniflorin system at three temperatures
HSA + paeoniflorin (K)
KSV (L mol−1) Kq (L mol−1 s−1) R2
KA (L mol−1) n
288
0.569 × 10⁴
0.9483 × 10¹²
0.9965 1.909 × 10³
298
0.545 × 10⁴
0.9083 × 10¹²
0.9941 1.680 × 10³
310
0.521 × 10⁴
0.8683 × 10¹²
0.9873 1.421 × 10³
∆G0 (kJ mol−1) ∆H0 (kJ mol−1) ∆S0 (J mol−1 K−1)
0.9053 − 18.10
0.8977 − 18.38
28.18
− 9.98
0.8868 − 18.72
From 0.00 × 10⁻⁵ to 1.25 × 10⁻⁵ mol L−1 at 2.50 × 10⁻⁶ mol L−1 intervals ([HSA] = 1.0 × 10⁻⁵ mol L−1, T = 288, 298 and 310 K)
the number of binding sites approximated to 1. Thus,
there was only one binding site between HSA and paeoniflorin which was the similar to BSA-paeoniflorin complex [18].
There are mainly four interaction forces between small
molecules and biomolecules including Van der Waals
forces, electrostatic forces, hydrogen bonds and hydrophobic interactions [28]. The thermodynamic parameters are important when determining the interaction
force. The binding force was examined by Van’t Hoff
equation:
G◦ =
H◦ − T S◦
As shown in Fig. 6 and Table 1, the free energy change
(ΔG°) demonstrated the process of binding was spontaneous. Researchers [41] had concluded the rules of
thermodynamics to determine the binding properties of
biomolecules and small molecules. As the aqueous solution in the complex formation of paeoniflorin with HSA,
the positive value of ΔS° (28.18 J mol−1 K−1) is regularly
regarded as an evidence of hydrophobic interaction,
because the water molecules that are arranged in an
orderly way around the ligand and protein acquire a more
random configuration [42]. Besides, the negative value of
ΔH° (− 9.98 kJ mol−1) can be mainly attributed to hydrogen bonds since the structure of paeoniflorin consists
of an ester group and several hydroxyl groups. Therefore, hydrophobic interactions and hydrogen bonds play
major roles in the binding process and contribute to the
stability of the paeoniflorin–HSA complex [36, 42]. It is
Absorbance
g
0.46
0.44
0.42
0.40
b
1.0
2.0
3.0
4.0
5.0
[paeoniflorin] (10 -5 mol·L-1 )
0.20
a
0.00
240
ln Ka = −�H◦ /RT + �S◦ /R
ΔH° and ΔS° are the enthalpy change and the entropy
change, respectively, both of which can be evaluated from
the slope and intercept of the linear plot of ln Ka against
1/T. Ka is the binding constant at different temperature.
R and T represent the gas constant and temperature,
respectively.
Obtaining the enthalpy change and the entropy change,
the free energy change (ΔG°) can be calculated as well
from the equation:
HSA-paeoniflorin
HSA+paeoniflorin
0.48
0.60
Absorbance
Thermodynamics of the HSA–paeoniflorin interactions
0.80
260
280
300
Wavelength (nm)
320
340
Fig. 4 Absorption spectra of paeoniflorin alone (a) and HSA in
the presence of different concentrations of paeoniflorin (b–g);
Inset: comparison of the absorption values at 280 nm between the
HSA–paeoniflorin mixed solutions and the sum values of free HSA
and free paeoniflorin, a: [paeoniflorin] = 1.0 × 10⁻⁵ mol L−1; b–g:
[HSA] = 1.0 × 10⁻⁵ mol L−1, [paeoniflorin] = 0, 1.0, 2.0, 3.0, 4.0,
5.0 × 10⁻⁵ mol L−1
obvious that the binding forces obtained in this study are
more reasonable than that in Haiyan Wen et al’s work.
Binding site
There are two main sub-domains of HSA namely subdomains IIA and sub-domains IIIA which are the major
ligand-binding sites: site I and site II [43]. To further
detect the binding site of paeoniflorin with HSA, the
competitive binding experiment was carried out. Warfarin and ibuprofen especially bound to site I and site
II, respectively, were chosen as the site markers [23, 44].
According to the Fig. 7, the impact of warfarin on the
fluorescence intensity was significant whereas there was
almost no change caused by ibuprofen. With the increasing addition of warfarin, there was an obvious decline of
the fluorescence intensity. Therefore, paeoniflorin shared
a common binding site with warfarin, namely site I.
The energy transfer of paeoniflorin with HSA
According to the Förster’s non-radioactive energy transfer theory, when there was an overlapping phenomenon
Page 6 of 12
1.0
-1.1
288 K
298 K
310 K
-1.2
-1.3
0.8
F2 /F1
-1.4
-1.5
-1.6
warfarlin
ibuprofen
0.0
-1.8
-5.5
-5.4
-5.3
-5.2
-5.1
-5.0
-4.9
-5
lg[paeoniflorin] (10 mol/L)
Fig. 5 Double logarithm plot of HSA + paeoniflorin solutions with
paeoniflorin concentrations (from 0.0 × 10⁻⁵ to 1.25 × 10⁻⁵ mol L−1
at 2.5 × 10⁻⁶ mol L−1 intervals) at three temperatures
([HSA] = 1.0 × 10⁻⁵ mol L−1)
7.60
ln ka = 1200.7 /T +3.3896
R = 0.9978
0.5
1.0
1.5
2.0
2.5
[probe]/[HSA]
Fig. 7 Effect of site maker probes on the fluorescence of HSA + pae‑
oniflorin system ([HSA] = [paeoniflorin] = 1.0 × 10⁻⁵ mol L−1)
Intensity (a.u.)
-5.6
1200
0.10
900
600
7.50
lnka
0.4
0.2
-1.7
7.55
0.6
Abs (a.u.)
lg [(F0 -F)/F]
Xu et al. Chemistry Central Journal (2017) 11:116
0.05
7.45
300
7.40
0
7.35
7.30
7.25
0.00320 0.00325 0.00330 0.00335 0.00340 0.00345 0.00350
1/T
Fig. 6 Van’t Hoff plot for the interaction of paeoniflorin with
HSA with paeoniflorin concentrations (from 0.0 × 10⁻⁵ to
1.25 × 10⁻⁵ mol L−1 at 2.5 × 10⁻⁶ mol L−1 intervals) at three tem‑
peratures ([HSA] = 1.0 × 10⁻⁵ mol L−1)
between the emission peak of the donor (HSA) and the
absorption peak of the acceptor (paeoniflorin) as shown
in Fig. 8, fluorescence energy transfer would occur [45].
Depending on the equations of Förster resonance energy
transfer as follows, the binding distance of the complex
was worked out in Table 2.
The efficiency of energy transfer (E) was calculated by:
E = 1− F/F0 = R6 / R6 + r6
F and F
0 indicate the fluorescence intensities of HSA
in the presence and absence of paeoniflorin, respectively.
R and r denote the critical binding distance and binding
distance between HSA and drug.
300
400
0.00
500
Wavelength (nm)
Fig. 8 Spectral overlap of fluorescence of HSA solution
and absorption of paeoniflorin solutions ([HSA] = [paeoni‑
florin] = 1.0 × 10⁻⁵ mol L−1, T = 288 K)
Table 2 Energy transfer efficiency (E), critical binding
distance (R), overlap integral (J) and binding distance (r)
calculated according to Föster’s non-radioactive energy
transfer theory
System
E (%)
HSA + paeoniflorin
5.37
−5
R (nm)
J (cm3 L mol−1)
r (nm)
1.08
0.729 × 10⁻¹⁶
1.74
−1
([HSA] = [paeoniflorin] = 1.00 × 10 mol L , T = 288 K)
The critical distance (R) was obtained by the following
equation:
R6 = 8.78 × 10⁻²³ k2 N−4 φJ
where k2 stands for the dipole orientation factor; N is
the refractive index of the medium; φ and J signify the
fluorescence quantum yield of the donor and the overlap
integral, separately.
Xu et al. Chemistry Central Journal (2017) 11:116
Page 7 of 12
The overlap integral was got from the equation:
J =
F( )ε( )
4
� /
F( )�
in which F(λ) represents the fluorescence intensity of the
fluorescent donor at wavelength λ, and ε(λ) is the molar
absorption coefficient of the acceptor at wavelength λ
[46].
According to calculation, the values of E, R, J, r were
5.37%, 1.08 nm, 0.729 × 10⁻¹⁶ cm3 L mol−1 and 1.74 nm,
respectively. The result of binding distance (r) below
8 nm and the fulfillment of the required condition 0.5
R < r < 2 R suggested that a high probability of the energy
transfer occurred between paeoniflorin and HSA [47],
which was reported for the first time.
Conformation investigation
In general, the conformation of HSA will change when it
is bound to small molecules. In this part, three-dimensional fluorescence spectra, CD spectra and molecular
modeling were introduced to investigate it.
Three‑dimensional (3D) fluorescence spectra
Three-dimensional fluorescence spectra have gained
growing popularity in detecting protein conformational
changes that make the result more visual and credible
[48, 49]. Both the three-dimensional spectra and the contour diagrams of HSA in the absence and presence of
paeoniflorin were exhibited in Fig. 9. The corresponding
characteristic parameters were shown in Table 3. In the
3D figures, peak 1 denoted the intrinsic fluorescence of
tryptophan and tyrosine residues. Peak 2 revealed the
spectral behavior of polypeptide backbone structures,
and it was also connected with the change of secondary
structure of HSA. According to the figure and the table,
it was clear that there was a drop in fluorescence intensity of both peak 1 and 2 when paeoniflorin was added
to HSA. Meanwhile, the addition of paeoniflorin caused
blue shift (5 nm) of peak 1. It suggested that paeoniflorin interacted with HSA and led to the conformational
change of the biomolecule [48].
CD spectra
CD spectra is a sensitive method to identify the conformational changes of protein [50]. As seen from Fig. 10,
there were two obvious negative bands of HSA in the
ultraviolet region at 210, 222 nm that were the characteristic structure of α-helix of protein [51]. In the presence of paeoniflorin, the signal of CD decreased. Changes
in α-helical content can be investigated by the peak
Fig. 9 Three-dimensional fluorescence spectra and corresponding contour diagrams of free HSA, HSA + paeoniflorin systems
([HSA] = 1.0 × 10⁻⁵ mol L−1, [paeoniflorin] = 1.25 × 10⁻⁵ mol L−1)
Table 3 Three-dimensional fluorescence spectral characteristic parameters of free HSA system, HSA + paeoniflorin systems
System
Peak 1
Peak position
λex/λem (nm/nm)
Peak 2
Strokes shift
Δλ (nm)
Intensity
Peak position
λex/λem (nm/nm)
Strokes shift
Δλ (nm)
Intensity
Free HSA
280.0/345.0
65
1149
280.0/665.0
380
49.18
HSA + paeoniflorin
280.0/340.0
60
1112
280.0/670.0
390
47.07
θ [mdeg]
Xu et al. Chemistry Central Journal (2017) 11:116
Page 8 of 12
0
-20
α-helix(%)
-40
b 53.4%
a 54.2%
b
-60
-80
a
200
210
220
230
240
Wavelength (nm)
Fig. 10 CD spectra of HSA in the absence (a) and pres‑
ence of (b) paeoniflorin ([HSA] = 1.0×10⁻⁶ mol L−1, [paeoni‑
florin] = 2.5×10⁻⁵ mol L−1)
decreasing or increasing and also be calculated by the following two equations:
MRE = observed CD mdeg /(10 × Cpnl)
α-helix (%) = [(−MRE208 − 4000)/(33000 − 4000)] × 100
wherein MRE (mean residue ellipticity) is ellipse rate of
the average residues; Cp is the mole fraction of protein;
n is the number of amino acid residues; l is the light path
of sample cell. According to the calculation result, the
percentage of α-helix of HSA declined slightly from 54.2
to 53.4%, indicating that paeoniflorin induced a slight
change of helical structure content of HSA [52, 53].
Molecular docking
The thermodynamics study illustrated that the main
forces among the HSA–paeoniflorin complex were
hydrophobic forces and hydrogen bonding which were
not completely identical with Han-Yan Wen’s work [18].
Meanwhile, molecular docking was used to verify the
theoretical calculations in this experiment.
Molecular docking, visually exhibiting the stereo binding modes, is increasingly used in the study of interaction between biomolecule and small molecules. The
possible HSA–paeoniflorin binding mode was predicted
by molecular docking software AutoDock. On the basis
of the best binding confirmation, the molecular interactions were depicted below (Figs. 11, 12). This result
confirmed that paeoniflorin bound into the sub-domain
Fig. 11 Paeoniflorin docked in the binding pocket of HSA
IIA of HSA, namely site I [44, 46, 52]. It revealed that
Y150, E153, K195, Q196, L198, K199, W214, R218, R222,
L238, H242, R257, S287, H288, I290, A291 and E292 of
HSA interacted with paeoniflorin. In addition, according
to the analysis of Ligplot+ (Fig. 13), K195, Q196, K199,
R222, H242 and R257 of HSA combined paeoniflorin
with hydrogen bonds and Y150, E153, A291, L198, W214,
E292, L238, S287 and I290 bound paeoniflorin via hydrophobic forces, which has not been reported before. Based
upon the molecular docking results, it was concluded
that several amino acid residues played an important
role in forming the binding of paeoniflorin and HSA. The
molecular docking results indicated that the interaction
between paeoniflorin and HSA was dominated by hydrophobic forces as well as hydrogen bonding, which were
consistent with our experimental results.
Conclusions
In this paper, the interaction of paeoniflorin with HSA
was investigated by fluorescence, UV–vis, CD and
molecular docking techniques under simulated physiological conditions. In addition, our results compared with
previous work were also discussed. The results demonstrated that the fluorescence of HSA would be quenched
with the addition of paeoniflorin. This change was via
Xu et al. Chemistry Central Journal (2017) 11:116
Page 9 of 12
Fig. 12 The active site residues of HSA and paeoniflorin. The HSA is presented by ribbon structure whereas paeoniflorin by stick model
static quenching and energy transfer. According to
Stern–Volmer equation, the binding constant was calculated (1.909 × 10³ L mol−1, 288 K). Besides, the study of
thermodynamics parameters with negative value of ∆H°,
∆G°, and positive value of ∆S° indicated that the process was spontaneous and was mainly driven by hydrophobic interactions and hydrogen bonds. In accordance
with the Förster’s non-radioactive energy transfer theory,
the binding distance between paeoniflorin and HSA was
evaluated as 1.74 nm. The results of the current study
suggest that paeoniflorin can bind to HSA and form 1:1
complex. Analysis of molecular probes and molecular
docking showed that the binding site located in Sudlow’s
site I. Combined with paeoniflorin, the conformation
of HSA changed according to the results of 3D, UV–vis
and CD spectra. Additionally, paeoniflorin may induce
conformational changes of HSA and affect its biological
function as the carrier protein.
The conclusions are important in the field of pharmacology and biochemistry and are helpful for understanding the effect of paeoniflorin on protein function
during the blood transportation process and its biological
Xu et al. Chemistry Central Journal (2017) 11:116
Page 10 of 12
Fig. 13 The interaction model of paeoniflorin at site I of HSA with its hydrogen bodings and hydrophobic interactions
activity in vivo. The clear and quantitative information on
the nature of paeoniflorin–HSA interaction may provide
some information for its rational use in clinical practice.
Authors’ contributions
The fluorescence spectroscopy, UV–vis absorption, fluorescence probe
experiments, synchronous fluorescence, circular dichroism (CD) spectra and
three-dimensional spectra study on interaction of paeoniflorin with human
serum albumin (HSA) was accomplished by LX and YL together with their
students YH and YL. The molecular docking study was accomplished by HL
and HA together with their student LZ. LX and YL accomplished the writing of
the article. YL and HL were the study designers and corresponding authors. All
authors read and approved the final manuscript.
Author details
College of Pharmacy, Liaoning University, Shenyang 110036, People’s
Republic of China. 2 Natural Products Pharmaceutical Engineering Technology
Research Center of Liaoning Province, Shenyang 110036, People’s Republic
of China. 3 School of Life Science, Liaoning University, Shenyang 110036, Peo‑
ple’s Republic of China. 4 Research Center for Computer Simulating and Infor‑
mation Processing of Bio-macromolecules of Liaoning Province, Shen‑
yang 110036, People’s Republic of China. 5 Liaoning Engineering Laboratory
for Molecular Simulation and Designing of Drug Molecules, Shenyang 110036,
People’s Republic of China.
1
Acknowledgements
The authors greatly acknowledge the National Natural Science Foundation of
China (81403177), the Science and Technology Planning Project of Shenyang
Science and Technology Bureau (F12-277-1-14) and Innovation Team Project
Xu et al. Chemistry Central Journal (2017) 11:116
of the Education Department of Liaoning Province (LT2015011) for financial
supports.
Competing interests
The authors declare that they have no competing interests.
Availability of data and materials
The dataset supporting the conclusions of this article is included within the
article and its additional file.
Consent for publication
Not applicable.
Ethics approval and consent to participate
Not applicable.
Funding
The fluorescence spectroscopy, UV–vis absorption, fluorescence probe
experiments, synchronous fluorescence, circular dichroism (CD) spectra and
three-dimensional spectra study was funded by the National Natural Science
Foundation of China (81403177) and the Science and Technology Planning
Project of Shenyang Science and Technology Bureau (F12-277-1-14). The
molecular docking study was funded by Innovation Team Project of the Edu‑
cation Department of Liaoning Province (LT2015011).
Publisher’s Note
Springer Nature remains neutral with regard to jurisdictional claims in pub‑
lished maps and institutional affiliations.
Received: 25 May 2017 Accepted: 10 November 2017
References
1. Wu S-H, Wu D-G, Chen Y-W (2010) Chemical constituents and bioactivi‑
ties of plants from the genus Paeonia. Chem Biodivers 7(1):90–104
2. Lee K-H (1999) Chinese materia medica: chemistry, pharmacology and
applications. By You-Ping Zhu (China–Netherlands Medical and Phar‑
maceutical Centre, Groningen, The Netherlands). Harwood Academic
Publishers, Amsterdam, Netherlands. 1998. vii+ 706 pp. 17 × 24.5 cm.
$120.00. ISBN 90-5702-285-0. J Nat Prod 62(7):1077
3. Shibata S, Nakahara M (1963) The constituents of Japanese and Chinese
crude drugs. VIII. Paeoniflorin, a glucoside of Chinese peony roots. Chem
Pharm Bull 11:372–378
4. Kaneda M, Iitaka Y, Shibata S (1972) Chemical studies on the oriental
plant drugs. XXXIII. Absolute structure of paeoniflorin, albiflorin, oxypae‑
oniflorin, and benzoylpaeoniflorin isolated from Chinese paeony root.
Tetrahedron 28(16):4309–4317
5. Wu Y, Ren K, Liang C, Yuan L, Qi X, Dong J et al (2009) Renoprotective
effect of total glucosides of paeony (TGP) and its mechanism in experi‑
mental diabetes. J Pharmacol Sci 109(1):78–87
6. Ikuta A, Kamiya K, Satakek T, Saiki Y (1995) Triterpenoids from callus tissue
cultures of Paeonia species. Phytochemistry 38(5):1203–1207
7. Kim N, Park K-R, Park I-S, Park Y-H (2006) Application of novel HPLC
method to the analysis of regional and seasonal variation of the active
compounds in Paeonia lactiflora. Food Chem 96(3):496–502
8. Cui F, Cui Y, Luo H, Yao X, Fan J, Lu Y (2006) Interaction of APT with BSA or
HSA. Chin Sci Bull 51(18):2201–2207
9. He XM, Carter DC (1992) Atomic structure and chemistry of human
serum albumin. Nature 358(6383):209–215
10. Sudlow G, Birkett DJ, Wade DN (1975) Characterization of two spe‑
cific drug binding sites on human serum albumin. Mol Pharmacol
11(6):824–832
11. Ibrahim N, Ibrahim H, Kim S, Nallet J-P, Nepveu F (2010) Interactions
between antimalarial indolone-N-oxide derivatives and human serum
albumin. Biomacromolecules 11(12):3341–3351
12. Colmenarejo G (2003) In silico prediction of drug-binding strengths to
human serum albumin. Med Res Rev 23(3):275–301
Page 11 of 12
13. Zhang Y-Z, Xiang X, Mei P, Dai J, Zhang L-L, Liu Y (2009) Spectroscopic
studies on the interaction of Congo Red with bovine serum albumin.
Spectrochim Acta Part A 72A(4):907–914
14. Ghuman J, Zunszain PA, Petitpas I, Bhattacharya AA, Otagiri M, Curry S
(2005) Structural basis of the drug-binding specificity of human serum
albumin. J Mol Biol 353(1):38–52
15. Han X-L, Tian F-F, Ge Y-S, Jiang F-L, Lai L, Li D-W et al (2012) Spectroscopic,
structural and thermodynamic properties of chlorpyrifos bound to serum
albumin: a comparative study between BSA and HSA. J Photochem
Photobiol B 109:1–11
16. Papadopoulou A, Green RJ, Frazier RA (2005) Interaction of flavonoids
with bovine serum albumin: a fluorescence quenching study. J Agric
Food Chem 53(1):158–163
17. Kanaoka M, Yano S, Kato H, Nakanishi K, Yoshizaki M (1984) Studies on the
enzyme immunoassay of bio-active constituents contained in oriental
medicinal drugs. III. Enzyme immunoassay of paeoniflorin, a constituent
of Chinese peony root. Chem Pharm Bull 32(4):1461–1466
18. Wen H, Zhang H, Wang Y, Zhang X, Hu P (2010) Investigation of the inter‑
action between bovine serum albumin with paeoniflorin and loganin.
Yaowu Fenxi Zazhi 30(1):6–11
19. Chen Y, Du X, Zhou Y, Liu Z, Zhang Y, Yang Y et al (2015) Paeoniflorin pro‑
tects HUVECs from AGE-BSA-induced injury via an autophagic pathway
by acting on the RAGE. Int J Clin Exp Pathol 8(1):53–62
20. Zhao Y, Qu H, Wang X, Zhang Y, Shan W, Wang Q (2015) A sensitive and
specific indirect competitive enzyme-linked immunosorbent assay
for detection of paeoniflorin and its application in pharmacokinetic
interactions between paeoniflorin and glycyrrhizinic acid. Planta Med
81(9):765–770
21. Liu B-M, Zhang J, Hao A-J, Xu L, Wang D, Ji H et al (2016) The increased
binding affinity of curcumin with human serum albumin in the presence
of rutin and baicalin: a potential for drug delivery system. Spectrochim
Acta Part A 155:88–94
22. Liu B-M, Zhang J, Bai C-L, Wang X, Qiu X-Z, Wang X-L et al (2015) Spec‑
troscopic study on flavonoid–drug interactions: competitive binding
for human serum albumin between three flavonoid compounds and
ticagrelor, a new antiplatelet drug. J Lumin 168:69–76
23. Li X, Yang Z (2015) Interaction of oridonin with human serum albumin by
isothermal titration calorimetry and spectroscopic techniques. Chem Biol
Interact 232:77–84
24. Rehman SU, Sarwar T, Husain MA, Ishqi HM, Tabish M (2015) Studying
non-covalent drug–DNA interactions. Arch Biochem Biophys 576:49–60
25. Zhang G, Ma Y (2013) Mechanistic and conformational studies on the
interaction of food dye amaranth with human serum albumin by multi‑
spectroscopic methods. Food Chem 136(2):442–449
26. Morris GM, Huey R, Lindstrom W, Sanner MF, Belew RK, Goodsell DS et al
(2009) AutoDock and AutoDockTools: automated docking with selective
receptor flexibility. J Comput Chem 30(16):2785–2791
27. Laskowski RA, Swindells MB (2011) LigPlot+: multiple ligand–pro‑
tein interaction diagrams for drug discovery. J Chem Inf Model
51(10):2778–2786
28. Tabassum S, Ahmad M, Afzal M, Zaki M, Bharadwaj PK (2014) Synthesis
and structure elucidation of a copper(II) Schiff-base complex: in vitro
DNA binding, pBR322 plasmid cleavage and HSA binding studies. J
Photochem Photobiol B 140:321–331
29. Zhang G, Wang L, Pan J (2012) Probing the binding of the flavonoid
diosmetin to human serum albumin by multispectroscopic techniques. J
Agric Food Chem 60(10):2721–2729
30. Matei I, Hillebrand M (2010) Interaction of kaempferol with human serum
albumin: a fluorescence and circular dichroism study. J Pharm Biomed
Anal 51(3):768–773
31. Lakowicz JR (1988) Principles of frequency-domain fluorescence
spectroscopy and applications to cell membranes. Subcell Biochem
13:89–126
32. Zhang G, Fu P, Pan J (2013) Multispectroscopic studies of paeoniflorin
binding to calf thymus DNA in vitro. J Lumin 134:303–309
33. Bordbar A-K, Taheri-Kafrani A (2007) Binding and fluorescence study on
interaction of human serum albumin (HSA) with cetylpyridinium chloride
(CPC). Colloids Surf B 55(1):84–89
34. Bi S, Song D, Tian Y, Zhou X, Liu Z, Zhang H (2005) Molecular spectro‑
scopic study on the interaction of tetracyclines with serum albumins.
Spectrochim Acta Part A 61A(4):629–636
Xu et al. Chemistry Central Journal (2017) 11:116
35. Kandagal PB, Ashoka S, Seetharamappa J, Vani V, Shaikh SMT (2006)
Study of the interaction between doxepin and human serum albumin by
spectroscopic methods. J Photochem Photobiol A 179(1–2):161–166
36. Wang X, Liu Y, He L-L, Liu B, Zhang S-Y, Ye X et al (2015) Spectroscopic
investigation on the food components–drug interaction: the influence
of flavonoids on the affinity of nifedipine to human serum albumin. Food
Chem Toxicol 78:42–51
37. Tabrizi L, Chiniforoshan H, Tavakol H (2015) New mixed ligand
palladium(II) complexes based on the antiepileptic drug sodium val‑
proate and bioactive nitrogen-donor ligands: synthesis, structural char‑
acterization, binding interactions with DNA and BSA, in vitro cytotoxicity
studies and DFT calculations. Spectrochim Acta Part A 141:16–26
38. Luo N, Li Z, Qian D, Qian Y, Guo J, J-A Duan et al (2014) Simultaneous
determination of bioactive components of Radix Angelicae Sinensis–
Radix Paeoniae Alba herb couple in rat plasma and tissues by UPLC–MS/
MS and its application to pharmacokinetics and tissue distribution. J
Chromatogr B Anal Technol Biomed Life Sci 963:29–39
39. Wu H, Zhu Z, Zhang G, Zhao L, Zhang H, Zhu D et al (2009) Comparative
pharmacokinetic study of paeoniflorin after oral administration of pure
paeoniflorin, extract of Cortex Moutan and Shuang-Dan prescription to
rats. J Ethnopharmacol 125(3):444–449
40. Zhang G, Zhao N, Hu X, Tian J (2010) Interaction of alpinetin with bovine
serum albumin: probing of the mechanism and binding site by spectro‑
scopic methods. Spectrochim Acta Part A 76A(3–4):410–417
41. Ross PD, Subramanian S (1981) Thermodynamics of protein association
reactions: forces contributing to stability. Biochemistry 20(11):3096–3102
42. Guo X, Li X, Jiang Y, Yi L, Wu Q, Chang H et al (2014) A spectroscopic study
on the interaction between p-nitrophenol and bovine serum albumin. J
Lumin 149:353–360
43. Chatterjee T, Pal A, Dey S, Chatterjee BK, Chakrabarti P (2012) Interac‑
tion of virstatin with human serum albumin: spectroscopic analysis and
molecular modeling. PLoS ONE 7(5):e37468
44. Shahabadi N, Khorshidi A, Moghadam NH (2013) Study on the interaction
of the epilepsy drug, zonisamide with human serum albumin (HSA) by
spectroscopic and molecular docking techniques. Spectrochim Acta Part
A 114:627–632
Page 12 of 12
45. Sato H (2013) A modern solvation theory: quantum chemistry and statis‑
tical chemistry. Phys Chem Chem Phys 15(20):7450–7465
46. Cui F, Zhang Q, Yan Y, Yao X, Qu G, Lu Y (2008) Study of characterization
and application on the binding between 5-iodouridine with HSA by
spectroscopic and modeling. Carbohydr Polym 73(3):464–472
47. Hosainzadeh A, Gharanfoli M, Saberi MR, Chamani J (2012) Probing the
interaction of human serum albumin with bilirubin in the presence of
aspirin by multi-spectroscopic, molecular modeling and zeta potential
techniques: insight on binary and ternary systems. J Biomol Struct Dyn
29(5):1013–1050
48. Tabassum S, Al-Asbahy WM, Afzal M, Arjmand F, Hasan KR (2012) Interac‑
tion and photo-induced cleavage studies of a copper based chemother‑
apeutic drug with human serum albumin: spectroscopic and molecular
docking study. Mol Biosyst 8(9):2424–2433
49. Iranfar H, Rajabi O, Salari R, Chamani J (2012) Probing the interaction of
human serum albumin with ciprofloxacin in the presence of silver nano‑
particles of three sizes: multispectroscopic and ζ potential investigation. J
Phys Chem B 116(6):1951–1964
50. Ahmad B, Parveen S, Khan RH (2006) Effect of albumin conformation on
the binding of ciprofloxacin to human serum albumin: a novel approach
directly assigning binding site. Biomacromolecules 7(4):1350–1356
51. Bi S, Zhao T, Zhou H, Wang Y, Li Z (2016) Probing the interactions of
bromchlorbuterol-HCl and phenylethanolamine A with HSA by multispectroscopic and molecular docking technique. J Chem Thermodyn
97:113–121
52. Tabassum S, Al-Asbahy WM, Afzal M, Arjmand F (2012) Synthesis, char‑
acterization and interaction studies of copper based drug with human
serum albumin (HSA): spectroscopic and molecular docking investiga‑
tions. J Photochem Photobiol B 114:132–139
53. Kandagal PB, Ashoka S, Seetharamappa J, Shaikh SMT, Jadegoud Y, Ijare
OB (2006) Study of the interaction of an anticancer drug with human and
bovine serum albumin: spectroscopic approach. J Pharm Biomed Anal
41(2):393–399