Determination of lesinurad in rat plasma by a UHPLC–MS/MS assay
Bạn đang xem bản rút gọn của tài liệu. Xem và tải ngay bản đầy đủ của tài liệu tại đây (890.13 KB, 7 trang )
Zhou et al. Chemistry Central Journal (2017) 11:121
DOI 10.1186/s13065-017-0353-6
Open Access
RESEARCH ARTICLE
Determination of lesinurad in rat plasma
by a UHPLC–MS/MS assay
Xiao‑Yang Zhou1 , Ling‑Jing Yuan2, Zhe Chen2, Peng‑Fei Tang2, Xiang‑Yu Li2, Guo‑Xin Hu2 and Jian‑Ping Cai1*
Abstract
Lesinurad is an oral inhibitor of urate-anion exchanger transporter 1 and has been approved by the US Food and Drug
Administration for combination therapy with a xanthine oxidase inhibitor for the treatment of hyperuricemia associ‑
ated with refractory gout. In the present study, a sensitive and specific ultra high-performance liquid chromatography
with tandem mass spectrometry assay was established and verified for the determination of lesinurad in rat plasma
and was described in details for the first time. Chromatographic separation of lesinurad and diazepam (internal stand‑
ard, IS) was performed on a Rapid Resolution HT C18 column (3.0 × 100 mm, 1.8 µm) using methanol–water (70:30,
v/v) as the mobile phase at a flow rate of 0.3 mL/min. Lesinurad and IS were extracted from plasma by liquid–liquid
extraction using ethyl acetate. The mass spectrometric detection was carried out using an electrospray ionization
source in positive mode. Multiple reaction monitoring was used for quantification of the precursor to product ion at
m/z 405.6 → 220.9 for lesinurad and m/z 285.1 → 192.8 for IS. The assay was well validated for selectivity, accuracy,
precision, recovery, linearity, matrix effects, and stability. The verified method was applied to obtain the pharmacoki‑
netic parameters and concentration–time profiles for lesinurad after oral/intravenous administration in rats. The study
might provide an important reference and a necessary complement for the qualitative and quantitative evaluation of
lesinurad.
Keywords: Lesinurad, UHPLC–MS/MS, Rat plasma, Pharmacokinetics
Introduction
Gout is a metabolic disorder resulting from the deposition of urate crystals caused by altered purine metabolism leading to hyperuricemia. It has various clinical
manifestations, including arthritis, soft-tissue masses
(i.e., tophi), nephrolithiasis, and urate nephropathy,
which occur because of the deposition of monosodium
urate crystals in the joints, soft tissues, and kidneys. Gout
prevalence in the USA was 3.9% in 2007–2008 [1], 2.49%
in the UK in 2012 [2], and 1.1% in mainland China [3].
Epidemiological studies suggest that there has been a rise
in the prevalence of gout over recent decades. Gout and
hyperuricemia are associated with hypertension, metabolic syndrome, and cardiovascular diseases [4–7].
*Correspondence:
1
The MOH Key Laboratory of Geriatrics, Beijing Hospital, National Center
of Gerontology, Beijing 100730, People’s Republic of China
Full list of author information is available at the end of the article
Uric acid is the final oxidation product of purine
metabolism. Urate homeostasis depends on the balance between production, intestinal secretion, and renal
excretion [8]. It has been estimated that approximately
one-third of total urate disposal is by intestinal uricolysis
and two-thirds are by urinary uric acid excretion involving secretion and reabsorption in the kidney tubules [7,
9, 10]. Hyperuricemia may be caused by either overproduction or underexcretion of uric acid. It is generally accepted that decreased efficiency of renal uric acid
excretion is primarily responsible for hyperuricemia in
the majority of gout patients [7].
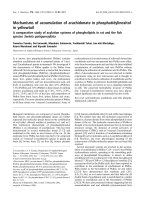
Lesinurad (Fig. 1), a newer drug to treat hyperuricemia
associated with refractory gout that functions by targeting the urate-anion exchanger transporter (URAT1),
was approved by the US Food and Drug Administration (USFDA) in December 2015 [11, 12], for combination therapy with a xanthine oxidase inhibitor. It was also
approved by the European Medicines Agency’s Committee for Medicinal Products for Human Use for this
© The Author(s) 2017. This article is distributed under the terms of the Creative Commons Attribution 4.0 International License
( which permits unrestricted use, distribution, and reproduction in any medium,
provided you give appropriate credit to the original author(s) and the source, provide a link to the Creative Commons license,
and indicate if changes were made. The Creative Commons Public Domain Dedication waiver ( />publicdomain/zero/1.0/) applies to the data made available in this article, unless otherwise stated.
Zhou et al. Chemistry Central Journal (2017) 11:121
Page 2 of 7
Germany). The water used throughout the study was
obtained from a Milli-Q Reagent Water System (Millipore, Billerica, MA, USA).
UHPLC–MS/MS analysis
Fig. 1 Chemical structures of a lesinurad and b diazepam (IS)
clinical indication throughout the European Union in
February 2016 [13]. URAT1, a transmembrane protein
that serves as a highly urate-specific and organic anion
exchanger, is localized to the luminal membrane of the
proximal tubular epithelial cells [14]. All or nearly all
uric acid is freely filtered at the glomerulus and most of
the filtered urate is reabsorbed in the proximal tubule
through URAT1. Lesinurad functions as a selective uric
acid reabsorption inhibitor by inhibiting URAT1 and
organic anion transporter 4 (OAT4), and so increases the
urinary excretion of uric acid [15, 16].
The previously studies primarily focused on descriptions of pharmacokinetics and pharmacodynamics of lesinurad in healthy individuals or gout patients under given
different therapeutic regimes. In these researches, the
determinations of lesinurad in plasma were all performed
by Ardea Biosciences (San Diego, CA, USA) using highperformance liquid chromatography–tandem mass spectrometry/mass spectrometry (HPLC–MS/MS) and their
methods were not elaborated at all [17–20]. The aim of
this study was to develop and elaborate on a sensitive
and validated UHPLC–MS/MS method for the quantitative evaluation of lesinurad in rat plasma samples. The
validation of this method was also performed, taking into
account the selectivity, sensitivity, accuracy, precision,
linearity, recovery, and stability, and the method was then
implemented to estimate and determine the pharmacokinetic properties of lesinurad. Our data was intend to provide an important reference and a necessary complement
for the assay for the determination of lesinurad.
Plasma samples were analyzed by the LC–MS/MS
method. The system was composed of an Agilent 1290
LC system (Agilent Technologies, Santa Clara, CA,
USA) with a 1.8 μm Rapid Resolution HT C18 column
(3.0 × 100 mm, Agilent Technologies) coupled to an Agilent 6490 Triple Quadrupole mass spectrometer (Agilent
Technologies) equipped with an electrospray ionization
(ESI) source. The mobile phase consisted of methanol–
water (70:30, v/v). The flow rate was 0.3 mL/min and the
injection volume was 5 µL. The total run time was 5 min.
Under the above conditions, lesinurad and diazepam (IS)
were well separated and their retention times were 2.90
and 3.57 min, respectively. For the determination of lesinurad and IS, the positive-ion mode was used according
to the conditions shown in Table 1. A dynamic multiple
reaction monitoring (MRM) method was performed to
identify the specific precursor and product ions of the
lesinurad and IS inside their retention time windows. The
capillary voltage was set to 4.0 kV in positive mode and
the nebulizer pressure was set to 15 psi. The gas temperature was set to 300 °C at a flow rate of 6 L/min.
Sample preparation
HCl (1 M, 50 µL) and ethyl acetate (1000 µL) were added
to samples of rat plasma (100 µL) and diazepam (1 µg/
mL, 20 µL) was added as an internal standard. The tube
was thoroughly mixed by vortexing for 2 min. After centrifugation at 13,000g for 10 min, the organic phase was
transferred to a new clear tube and evaporated to dryness
under a nitrogen stream at 45 °C. The dried samples were
dissolved in the mobile phase (100 µL) and used for the
LC–MS/MS analysis.
Calibration standards and quality control samples
The stock solutions of lesinurad were dissolved in dimethyl sulfoxide (DMSO) to make the calibration standards.
Working solutions of lesinurad for calibration and controls were prepared from the corresponding stock solutions by dilution with methanol. The lesinurad calibration
standards were prepared by adding 5 µL of the working
Methods
Reagents and materials
Lesinurad was purchased from Toronto Research Chemicals (Toronto, Canada) and diazepam (internal standard, IS) was obtained from Sigma (St. Louis, MO, USA).
HPLC-grade methanol, formic acid, and ethyl acetate
were purchased from Merck Company (Darmstadt,
Table 1 MS parameters for lesinurad and diazepam
Compound
name
Precursor
ion (m/z)
Product ion Collision
(m/z)
energy (eV)
Fragmentor
voltage (V)
Lesinurad
405.6
220.9
35
380
Diazepam
285.1
192.8
32
380
Zhou et al. Chemistry Central Journal (2017) 11:121
solution to 95 µL of the blank rat plasma. The calibration
plots were carried out with various final concentrations
(50, 100, 250, 1000, 5000, 10,000, 50,000 ng/mL) of lesinurad calibration standards with appropriate amounts
of the working standard solution of IS in rat plasma. The
stock solution of IS was dissolved in methanol to a final
concentration of 1 µg/mL. Quality control (QC) samples
were prepared by the same method as the calibration
standards at three different concentrations (100, 1000,
and 25,000 ng/mL). All of the solutions were stored at
− 20 °C and brought to room temperature before use.
Method validation
Method validation was carried out according to the
United States Food and Drug Administration (USFDA)
guidance for bioanalytical method validation [21]. Validation was performed for specificity, linearity, accuracy and
precision, matrix effects and stability.
Selectivity and specificity
Selectivity is the ability of an analytical method to differentiate and quantify the analyte in the presence of
other sample components [21]. The method selectivity
was verified by analyzing blank plasma samples from six
rats, blank samples spiked with lesinurad and IS, and rat
plasma samples. The degree of interference was assessed
through comparison of the chromatograms of blank
plasma with the chromatograms of plasma spiked with
lesinurad and IS.
Accuracy, precision and recovery
QC samples at three concentrations (100, 1000,
25,000 ng/mL) and LLOQ samples (50 ng/mL) in rat
plasma (n = 6) were analyzed repeatedly over three
separate days. Relative standard deviation (RSD %) and
relative error (RE %) were calculated to assess the accuracy and precision of the method. Recovery experiments revealed the extraction efficiency of the analytical
method and were performed by comparing the peak
areas of extracted QC samples at three concentrations
with those of unextracted standards at the same concentrations in post-extracted blank plasma (n = 6).
Linearity and lower limit of quantification
Calibration curves were constructed by measuring
calibration samples at seven different concentrations
(50–50,000 ng/mL) on three separate days. The lowest
concentration of lesinurad in the calibration curves that
could be reproducibly quantified with precision (< 20%)
and accuracy (80–120%) was accepted as the lower limit
of quantification (LLOQ). Additionally, the analyte signal
of the LLOQ sample should be at least five times the signal of a blank sample.
Page 3 of 7
Matrix effects
Six different blank rat plasma samples were extracted and
spiked with the QC samples at three concentrations (10,
1000, and 25,000 ng/mL). The ratios of the peak areas of
the analytes added into post-extracted blank plasma and
the peak areas of pure authentic standards at equivalent
concentrations were measured and defined as the matrix
effect (ME).
Stability
To evaluate the stability of the method, lesinurad levels in rat plasma were assessed using six replications at
three concentrations (10, 1000, and 25,000 ng/mL). These
experiments evaluated the stability of the QCs during
sample collection and handling under various storage
conditions and the analytical process, including freeze–
thaw stability (from − 70 °C to room temperature for
three cycles), short-term temperature stability (ca. 22 °C
for 12 h), long-term stability (− 20 °C for 30 days), and
post-preparation stability (in the autosampler at 4 °C for
48 h). RSD values of the mean test signals within 15%
were regarded as indicative of stability.
Pharmacokinetic study in rats
Twelve male Sprague–Dawley rats (330 ± 30 g) were
purchased from the Laboratory Animal Center of Wenzhou Medical University (Wenzhou, China). Animal
experiments were demonstrated to be ethically acceptable and were carried out according to the Guidelines
of the Experimental Animal Care and Use of Laboratory Animals of Wenzhou Medical University (ethical
committee approval number: wydw2016-0018). After
fasting for 12 h, all rats were divided into two groups,
which received lesinurad by either intragastric administration (20 mg/kg) or intravenous administration (5 mg/
kg). Blood samples (ca. 0.3 mL) were collected from the
tail vein into heparinized tubes at various times (0.083,
0.25, 0.5, 0.75, 1, 2, 4, 6, 8, 10, 12, and 24 h). The blood
samples were centrifuged at 13,000g for 10 min at 4 °C
and then pipetted into clean tubes and stored at − 80 °C
until analysis. The pharmacokinetic parameters were
calculated using DAS software (version 3.0, Shanghai
University of Traditional Chinese Medicine, Shanghai,
China).
Results and discussion
Method development
Chromatographic conditions
The chromatographic conditions were optimized to
achieve efficient separation of lesinurad and IS with good
resolution, short runtimes and symmetrical peak shapes.
In this study, methanol–water (70:30, v/v) with or without 0.1% formic acid was used as the mobile phase with
Zhou et al. Chemistry Central Journal (2017) 11:121
Page 4 of 7
isocratic elution. The total chromatographic analysis run
time was 5 min, with lesinurad and diazepam (IS) eluting after 2.90 and 3.57 min, respectively. The optimum
peak resolution was obtained using the Rapid Resolution
HT C18 column (100 × 3.0 mm diameter) with a column
oven temperature of 35 °C.
Mass spectrometry
The mass spectrometry operating parameters, such
as ESI source gas temperature, source gas flow, capillary and fragmentor voltages, ion modes, and collision
energy, were optimized to obtain the optimum response
and resolution of lesinurad and IS. After the optimization
experiments, the following conditions were selected: gas
temperature 300 °C, source gas flow 6 L/min, capillary
voltage 4.0 kV in positive mode, and nebulizer pressure
15 psi (Table 1). Diazepam was selected as the IS because
of its similar extraction recovery and chromatographic
performance to lesinurad, and its detection sensitivity in
the ESI positive-ion mode.
Optimization of sample extraction
The optimization of sample extraction was carried out in
order to improve sensitivity and reliability of UHPLC–
MS/MS assay. Protein precipitation and liquid–liquid
extraction, which are common sample extraction options,
were compared and optimized in the study. It was proven
that ethyl acetate liquid extraction exhibited a better
recovery (98.94–106.87%), and lower matrix effects as
well. Consequently, ethyl acetate liquid–liquid extraction was used as plasma samples extraction method in
the study. A further optimization was applied to sample
treatment by evaporation of solvent under a nitrogen
stream and redissolution in the mobile phase to achieve
high sensitivity of the assay.
Method validation
Selectivity
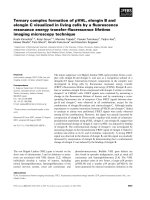
Typical LC–MS/MS chromatograms of blank plasma,
blank plasma spiked with lesinurad (50 ng/mL) and IS
(200 ng/mL), and a rat plasma sample taken 1 h after oral
administration of a single dose of 20 mg/kg lesinurad are
shown in Fig. 2. There was no endogenous interference
in the blank plasma at the retention time of lesinurad
(2.90 min) or the IS (3.57 min).
Linearity and lower limit of quantification
The linearity was evaluated by linear regression of lesinurad/IS peak area ratios versus lesinurad concentrations.
The assay was identified to be linear with a correlation
coefficient (R2) of 0.998 in the range of 50–50,000 ng/mL
for lesinurad in rat plasma. The lowest concentration on
the standard curve was recognized as the LLOQ (50 ng/
Fig. 2 Representative UHPLC–MS/MS chromatograms of lesinurad
and IS in rat plasma samples. a A blank plasma sample; b a blank
plasma sample spiked with lesinurad and IS; c a rat plasma sample
obtained 1 h after oral administration of lesinurad
µL) for this assay. The bioavailability of lesinurad was
57.36%. Compared with previous study, the LLQQ identified in our study was lower than that applied for determination of lesinurad in human plasma [18]. Our further
experiments were carried out and showed that the limit
of quantitation (LOQ) of this assay was 0.5 ng/ml (Additional file 1: Figure S1).
Precision and accuracy
QC samples at three concentration levels (100, 1000,
and 25,000 ng/mL) and LLOQ samples were analyzed
to determine the accuracy and precision of the method.
The results are shown in Table 2. The intra-day and interday precision values (RSD %) were ≤ 8.25 and ≤ 7.79%,
respectively. The intra-day and inter-day accuracy values
were in the ranges of 93.98–101.93 and 93.23–102.93%,
respectively, compared to the true values. The analysis
proved that the present method exhibits good accuracy
and precision.
Recovery and matrix effects
The recovery and MEs of lesinurad at three different concentrations (100, 1000, and 25,000 ng/mL)
are presented in Table 2. The recoveries of lesinurad
were 98.94–106.87% and the MEs were in the range of
6.83
2.06
942.97 ± 64.4
25,481.66 ± 525.4
1000
25,000
8.46
8.25
54.81 ± 4.6
93.98 ± 7.8
50
4.88
0.84
2.79
3.37
101.93
94.30
93.98
109.62
Accuracy (%)
25732.98 ± 2005.4
932.26 ± 11.6
99.26 ± 6.4
56.70 ± 3.6
Mean ± SD
RE (%)
Mean ± SD
RSD (%)
Inter-day
Intra-day
100
Concentration (ng/mL)
Table 2 Precision, accuracy, recovery, and ME for lesinurad for samples in rat plasma (n = 6)
7.79
1.24
6.43
6.38
RSD (%)
0.01
0.05
2.64
2.85
RE (%)
102.93
93.23
99.26
113.4
Accuracy (%)
101.12
98.94
106.87
–
Recovery (%)
107.21
109.19
101.95
–
ME (%)
Zhou et al. Chemistry Central Journal (2017) 11:121
Page 5 of 7
Zhou et al. Chemistry Central Journal (2017) 11:121
Page 6 of 7
Table 3 Stability tests of lesinurad in rat plasma under different storage conditions (n = 6)
Concentration (ng/mL)
Room temperature
4 °C
RSD %
RSD %
100
6.48
1000
4.82
25,000
3.41
RE %
− 2.54
− 6.62
− 4.54
8.25
6.83
2.06
Table
4 The pharmacokinetic parameters of lesinurad
in rat plasma after oral or intravenous administration
Parameter
Unit
Lesinurad (mean ± SD)
iv 5 mg/kg
po 20 mg/kg
AUC(0–t)
µg/L h 46,219.33 ± 5420.8
106,044.73 ± 32,137.3
AUC(0–∞)
µg/L h 46,541.72 ± 32,232.5
106,613.55 ± 32,232.5
t1/2
h
3.92 ± 1.6
3.22 ± 0.4
Tmax
h
0.14 ± 0.1
2.46 ± 1.7
V
L/kg
0.61 ± 0.2
0.94 ± 0.3
CL
L/h/kg 0.11 ± 0.0
0.20 ± 0.1
Cmax
µg/L
12,441.84 ± 1694.2
16,719.45 ± 2966.5
MRT(0–t)
h
3.39 ± 0.3
5.06 ± 0.6
MRT(0–∞)
h
3.58 ± 0.3
5.19 ± 0.6
Absolute bioavailability
57.36%
101.95–109.19% (< 15%). The recovery and MEs for IS
(200 ng/mL) were 108.76 and 99.42%, respectively, compared to the true values. The results indicated that the
recovery of lesinurad by liquid–liquid extraction was feasible and consistent, and that the plasma had little effect
on the response of the lesinurad signal.
RE %
− 6.02
− 5.70
1.93
Freeze–thaw (3 cycles)
− 20 °C (30 days)
RSD %
RSD %
RE %
RE %
9.22
0.39
1.83
0.32
7.82
− 10.16
6.71
− 8.77
8.19
6.48
7.38
8.45
Stability
The stability data for lesinurad at three different concentrations (100, 1000, and 25,000 ng/mL) in rat plasma
under various conditions are shown in Table 3. The REs
were < 15% of their true values. These results demonstrated that lesinurad was stable in rat plasma under a
range of storage conditions (at room temperature for
12 h, at − 20 °C for 30 days, at 4 °C for 48 h, and after
three freeze–thaw cycles).
Pharmacokinetic study in rats
The validated UHPLC–MS/MS assay was applied to a
single-dose pharmacokinetic study of lesinurad in male
Sprague–Dawley rats. The data for the pharmacokinetic
parameters of lesinurad after oral (20 mg/kg) or intravenous (5 mg/kg) administration, which were derived using
non-compartmental analysis by DAS software, are summarized in Table 4. Lesinurad was found to be absorbed
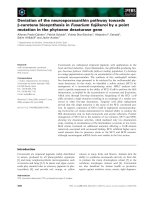
quickly (Tmax) and eliminated rapidly (t1/2). The mean
plasma concentration versus time curves after oral and
intravenous administration are shown in Fig. 3. A double-peak phenomenon was observed in the mean plasma
concentration versus time curve after oral administration
of lesinurad, which is different from the results obtained
Fig. 3 Mean plasma concentration versus time curves after oral or intravenous administration of lesinurad in rats. a Oral administration (20 mg/kg);
b intravenous administration (5 mg/kg)
Zhou et al. Chemistry Central Journal (2017) 11:121
from studies in gout patients [17] or healthy adults [18,
19].
Conclusions
A selective, sensitive, accurate, reliable, and reproducible
UHPLC–MS/MS assay for the quantification of lesinurad
in rat plasma has been established and verified. The validated assay has been successfully applied to deliver reliable data on the pharmacokinetic profile of lesinurad in
rats.
Additional file
Additional file 1: Figure S1. Identification for the limit of quantitation of
this assay. (A) 0.25 ng/mL; (B) 0.5 ng/mL; (C) 1.0 ng/mL; (D) 2.5 ng/mL; (E)
5 ng/mL; (F) 10 ng/mL.
Authors’ contributions
ZY, YJ, CP conceived and designed the study, drafted the manuscript. ZY, YJ,
CZ, TF, LY, HX carried out experiments and data analysis. All authors read and
approved the final manuscript.
Author details
1
The MOH Key Laboratory of Geriatrics, Beijing Hospital, National Center
of Gerontology, Beijing 100730, People’s Republic of China. 2 Department
of Pharmacology, School of Pharmacy, Wenzhou Medical University, Wen‑
zhou 325035, Zhejiang, China.
Acknowledgements
Not applicable.
Competing interests
The authors declared that they have no competing interests.
Availability of data and materials
Not applicable.
Consent for publication
All authors read and approved the final manuscript.
Ethics approval and consent to participate
As regarding all facets of animal care and use in our study, we got an ethical
approval number, wydw2016-0018, from the Experimental Animal Care and
Ethics Committee of Wenzhou Medical University. We confirm that the use of
animals in this project conformed to the general principles of the Experimen‑
tal Animal Care and Use for Scientific Purposes of Wenzhou Medical University.
Funding
This work was supported by the Ministry of Science and Technology of the
People’s Republic of China (No. 2017ZX09304026) and the National Natural
Science Foundation of China (No. 31371280).
Publisher’s Note
Springer Nature remains neutral with regard to jurisdictional claims in pub‑
lished maps and institutional affiliations.
Received: 3 August 2017 Accepted: 18 November 2017
Page 7 of 7
References
1. Zhu Y, Pandya BJ, Choi HK (2011) Prevalence of gout and hyperuricemia
in the US general population: the National Health and Nutrition Examina‑
tion Survey 2007–2008. Arthritis Rheum 63:3136–3141
2. Kuo CF, Grainge MJ, Mallen C, Zhang W, Doherty M (2015) Rising burden
of gout in the UK but continuing suboptimal management: a nationwide
population study. Ann Rheum Dis 74:661–667
3. Liu R, Han C, Wu D, Xia X, Gu J, Guan H et al (2015) Prevalence of hyper‑
uricemia and gout in Mainland China from 2000 to 2014: a systematic
review and meta-analysis. Biomed Res Int 2015:762820
4. Roddy E, Doherty M (2010) Epidemiology of gout. Arthritis Res Ther
12:223
5. Richette P, Bardin T (2010) Gout. Lancet (London, England) 375:318–328
6. Jin M, Yang F, Yang I, Yin Y, Luo JJ, Wang H et al (2012) Uric acid, hyper‑
uricemia and vascular diseases. Front Biosci 17:656–669
7. Jalal DI (2016) Hyperuricemia, the kidneys, and the spectrum of associ‑
ated diseases: a narrative review. Curr Med Res Opin 32:1863–1869
8. Mandal AK, Mount DB (2015) The molecular physiology of uric acid
homeostasis. Annu Rev Physiol 77:323–345
9. Lipkowitz MS (2012) Regulation of uric acid excretion by the kidney. Curr
Rheumatol Rep 14:179–188
10. Bobulescu IA, Moe OW (2012) Renal transport of uric acid: evolving
concepts and uncertainties. Adv Chronic Kidney Dis 19:358–371
11. FDA approves Zurampic to treat high blood uric acid levels associated
with gout (2015) US Food and Drug Administration. />Accessed 22 Dec 2015.
12. ZURAMPIC® (lesinurad) tablets, for oral use (2015) US prescribing
information. In: Administation USFaD (ed) AstraZeneca AB .http://www.
accessdata.fda.gov/. Accessed 22 Dec 2015.
13. Zurampic (lesinurad) (2015) Summary of opinion. In: (CHMP) CfMPfHU
(ed). European Medicines Agency Accessed
19 Feb 2016.
14. Enomoto A, Kimura H, Chairoungdua A, Shigeta Y, Jutabha P, Cha SH et al
(2002) Molecular identification of a renal urate anion exchanger that
regulates blood urate levels. Nature 417:447–452
15. Hoy SM (2016) Lesinurad: first global approval. Drugs. 76:509–516
16. Gupta A, Sharma PK, Misra AK, Singh S (2016) Lesinurad: a significant
advancement or just another addition to existing therapies of gout? J
Pharmacol Pharmacother 7:155–158
17. Fleischmann R, Kerr B, Yeh LT, Suster M, Shen Z, Polvent E et al (2014)
Pharmacodynamic, pharmacokinetic and tolerability evaluation of
concomitant administration of lesinurad and febuxostat in gout patients
with hyperuricaemia. Rheumatology (Oxford, England) 53:2167–2174
18. Shen Z, Rowlings C, Kerr B, Hingorani V, Manhard K, Quart B et al (2015)
Pharmacokinetics, pharmacodynamics, and safety of lesinurad, a selective
uric acid reabsorption inhibitor, in healthy adult males. Drug Design Dev
Ther 9:3423–3434
19. Gillen M, Valdez S, Zhou D, Kerr B, Lee CA, Shen Z (2016) Effects of renal
function on pharmacokinetics and pharmacodynamics of lesinurad in
adult volunteers. Drug Design Dev Ther 10:3555–3562
20. Perez-Ruiz F, Sundy JS, Miner JN, Cravets M, Storgard C (2016) Lesinu‑
rad in combination with allopurinol: results of a phase 2, randomised,
double-blind study in patients with gout with an inadequate response to
allopurinol. Ann Rheum Dis 75:1074–1080
21. Guidance for Industry (2001) Bioanalytical method validation. In: US
Department of Health and Human Services FaDA, Center for Drug
Evaluation and Research (CDER), Center for Veterrinary Medicine (CVM),
Rockville, MD, USA (ed). US DHHS, FDA, CDER, CVM. />cder/guidance/index.htm. Accessed May 2001.