QSAR study on the removal efficiency of organic pollutants in supercritical water based on degradation temperature
Bạn đang xem bản rút gọn của tài liệu. Xem và tải ngay bản đầy đủ của tài liệu tại đây (976.35 KB, 8 trang )
Jiang et al. Chemistry Central Journal (2018) 12:16
/>
RESEARCH ARTICLE
Open Access
QSAR study on the removal efficiency
of organic pollutants in supercritical water
based on degradation temperature
Ai Jiang, Zhiwen Cheng, Zhemin Shen* and Weimin Guo
Abstract
This paper aims to study temperature-dependent quantitative structure activity relationship (QSAR) models of
supercritical water oxidation (SCWO) process which were developed based on Arrhenius equation between oxidation reaction rate and temperature. Through exploring SCWO process, each kinetic rate constant was studied for 21
organic substances, including azo dyes, heterocyclic compounds and ionic compounds. We propose the concept of
TR95, which is defined as the temperature at removal ratio of 95%, it is a key indicator to evaluate compounds’ complete oxidation. By using Gaussian 09 and Material Studio 7.0, quantum chemical parameters were conducted for
each organic compound. The optimum model is TR95 = 654.775 + 1761.910f(+)n − 177.211qH with squared regression coefficient R
2 = 0.620 and standard error SE = 35.1. Nearly all the compounds could obtain accurate predictions
of their degradation rate. Effective QSAR model exactly reveals three determinant factors, which are directly related
to degradation rules. Specifically, the lowest f(+) value of main-chain atoms (f(+)n) indicates the degree of affinity for
nucleophilic attack. qH shows the ease or complexity of valence-bond breakage of organic molecules. B
Ox refers to
the stability of a bond. Coincidentally, the degradation mechanism could reasonably be illustrated from each perspective, providing a deeper insight of universal and propagable oxidation rules. Besides, the satisfactory results of internal
and external validations suggest the stability, reliability and predictive ability of optimum model.
Keywords: SCWO process, Organic pollutants, QSAR, Quantum parameters, Fukui indices
Introduction
Along with sustainable development of industry, a variety of organic pollutants are released into the environment through different ways, which is potentially noxious
to human health and the environment [1, 2]. Due to the
complexity of pollutants and the difficulty of destruction,
conventional treatments could hardly remove organic
compounds. Advanced oxidation processes (AOPs) have
been proven particularly effective and fast for treating
a wide variety of organic wastewater [3–6]. Supercritical water oxidation (SCWO), one of the AOPs, has been
taken as an effective method to degrade substances for
higher efficiency, faster reaction rate and less selectivity
[7, 8].
*Correspondence:
School of Environmental Science and Engineering, Shanghai Jiao Tong
University, 800 Dongchuan Road, Shanghai 200240, China
Quantitative structure activity relationship (QSAR)
models are rapid and cost-effective alternatives to predict theoretical data through building the relationship
between molecular structure and physicochemical properties [9, 10]. Several researchers have applied QSAR
models to evaluate the eco-toxicity of chemicals without experimental testing [11–13]. At present, numbers
of studies have investigated the removal of organic pollutants in SCWO system, which mainly focused on two
fields. One is the industrial application of the SCWO
technology [14, 15]. Another is exploring relationship
between reaction conditions and the degradation efficiency [16, 17]. Compared with factors like pressure and
residence time, temperature has been deemed to play
a controlling role as reported by Crain et al. [18]. More
importantly, the type of treated pollutant accounts for
certain appropriate temperature, which is a key indicator
when designing and running SCWO system. However,
© The Author(s) 2018. This article is distributed under the terms of the Creative Commons Attribution 4.0 International License
( which permits unrestricted use, distribution, and reproduction in any medium,
provided you give appropriate credit to the original author(s) and the source, provide a link to the Creative Commons license,
and indicate if changes were made. The Creative Commons Public Domain Dedication waiver ( />publicdomain/zero/1.0/) applies to the data made available in this article, unless otherwise stated.
Jiang et al. Chemistry Central Journal (2018) 12:16
Page 2 of 8
there are seldom researches about theoretical model to
offer rapid predictions of systematic effective temperature, which overcome limitations in repeated experiments, like high operational cost and expensive materials
[8, 19, 20]. Therefore, in consideration of the rigorous
requirements for reaction system, it is of great value and
necessity to explore a convenient and efficient QSAR
study. This model is significant in both industrial application and theoretical prediction.
It is our emphasis to figure out a common rule available
for SCWO system. Also, the impact of Fukui indices and
effective temperature on oxidation process were prioritized
in QSAR analysis. Primarily, kinetic experiments of diverse
compounds were explored. Later, temperature-dependent
QSAR models were developed using multiple linear regression. Finally, validations were performed to testify that the
optimal model can robustly make predictions.
Materials and methods
Reaction system
The experiments were conducted in a supercritical flow
reactor (SFR) system that had been used for previous
studies in our laboratory [21]. The major parts consisted
of high-pressure plunger pump, hydrogen peroxide tank,
waste water tank, gas release valve, check valve, thermometer, pressure gage, heat exchanger, heater and reactor, temperature recording controller, condenser, back
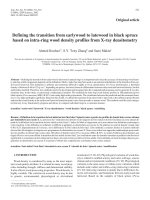
pressure regulator and effluent tank. The construction of
the SFR was displayed in Fig. 1. It was designed to work
under 773.15 K of operating temperature and 30 MPa of
operating pressure.
With the aim to study the influence of temperature,
compounds thermolysis and oxidation experiments were
all performed under isoconcentration (1 g L−1) and isobaric (24 MPa) conditions. Meanwhile, reaction system
was supplied with sufficient residence time (100–150 s)
and oxygen (500% excess). The content of total organic
carbon (TOC) in the samples was monitored using a
TOC analyzer (TOC-VCPN, Shimadzu Corporation,
Japan). Hydrogen peroxide (30 wt%) was used as the oxidant in the SCWO experiments and all reagents were
analytical pure.
Arrhenius equation in SCWO system
Temperature is particularly vital in the supercritical reaction conditions. Some orthogonal experiment researches
have confirmed the significance of temperature on
destruction of the organic structures. The Arrhenius
equation is a simple and remarkably accurate formula
for the temperature dependence of the reaction rate constant, which can be expressed as follows.
k = Aexp
−Ea
RT
(1)
Based on Eq. (1), an Arrhenius-type Eq. (2) is presented
as follows.
T=
Ea
R(lnA − lnk)
(2)
where A is the pre-exponential factor and R is the gas
constant. The units of A are identical to those of the rate
constant k and will vary depending on the order of the
reaction. It can be seen that either increasing the temperature T or decreasing the activation energy Ea (for example through the use of catalysts) will result in an increase
in rate of reaction. When oxygen exceeds, the degradation process of SCWO system is in accordance with the
pseudo-first-order kinetic reaction equation.
T = f (µ, q(CN), BO, f(+) . . .)
(3)
In short, the Arrhenius equation gives a reliable and
applicable principle between lnk of oxidation reactions and T (in absolute temperature). Based on present researches focused on the relationship between lnk
and quantum molecular parameters, function could be
assumed as Eq. (3) [22, 23]. It is reasonable to develop a
temperatures-dependent QSAR in order to predict oxidation efficiency by theoretical descriptors.
Computation details
All the calculations were carried out by using chemical
density functional theory (DFT) methods in Gaussian 09
(B3LYP/6-311G level) and Material Studio 7.0 (Dmol3/
GGA-BLYP/DNP(3.5) basis) [24]. Structure optimization and the total energy calculations of the optimized
geometries were based on B3LYP method. During the
calculation process, exchange and correlation terms were
considered with a B3LYP function (6-311G basis set).
Meanwhile, natural population analysis (NPA) of atomic
charge was obtained by the same method. The localized double numerical basis sets with polarization functional (DNP) from the DMol3 software were adopted
to expand the Kohn–Sham orbitals. The self-consistent
field procedure was carried out with a convergence criterion of 1
0−6 a.u. on energy and electron density. Density
mixing was set at 0.2 charge and 0.5 spin. The smearing
of electronic occupations was set as 0.005 Ha. Molecular parameters of each organic compound are listed
in Table 1. They included energy of molecular orbital
(ELOMO/EHOMO), bond order (BO), Fukui indices [f(+),
f(−) and f(0)] and so on. In “Optimization” section, they
were introduced in detail.
In order to obtain optimum number of variables for the
correlation model, stepwise regression procedure was
used to build QSAR models by the SPSS 17.0 for windows
program. The quality of derived QSAR was evaluated in
accordance with the squared regression coefficient (R2),
Jiang et al. Chemistry Central Journal (2018) 12:16
Page 3 of 8
Fig. 1 Supercritical flow reactor (SFR) system
the standard error (SE) as well as t test and the Fisher
test. The internal validation was performed by leave-oneout cross-validation (q2), and the external validation was
also computed (Q2EXT). In both validation methods, a validation value greater than 0.5 indicates a robust and predictive model.
Results and discussion
The degradation process of 21 kinds of organic pollutants
was investigated at 24 Mpa from the subcritical to supercritical temperature with 500% excess oxygen. Sampling
occurred from 523.15 to 773.15 K. An important design
consideration in the development of SCWO is the optimization of operating temperature. As shown in Fig. 2, TOC
degradation efficiency of compounds tends to be higher
with the increase of operating temperature. When the temperature reached 773.15 K, most organics could be totally
oxidized into water and carbon dioxide. The compounds
are considered to be completely removed while the degradation efficiency reaches 95%. Consequently, we propose
the concept of T
R95, which is defined as the temperature at
removal ratio of 95%, as the key indicator to evaluate compounds’ complete oxidation. T
R95 values of the reaction
system are distinguished, ranging from 540.65 K (of Methylene blue trihydrate) to 764.26 K (of melamine), which
indicate that organic compounds in this study are different
and complex. Thus, among diverse molecules, it is significant to set up a temperature-dependent QSAR which can
predict SCWO thermodynamics and oxidization activities
and conclude universal rules.
Optimization
The structure optimization of organic matter and
the calculation of the total energy for the optimized
geometry are based on the B3LYP method in Gaussian
09 and Dmol3 code in Material Studio 7.0. All quantum
descriptors are directly available from the output file of
two software. Finally, as shown in Table 1, we got the
following 15 molecular descriptors of organics: dipole
moment (μ), most positive partial charge on a hydrogen
atom (qH), most negative or positive partial charge on a
carbon or nitrogen atom (q(CN)n/q(CN)x), energy of the
lowest unoccupied molecular orbital (ELUMO), energy of
highest occupied molecular orbital (EHOMO), minimum
or maximum of bond order values in the molecule ( BOn/
BOx), and maximum or minimum of Fukui indices [f(+)x/
f(+)n, f(−)x/f(−)n and f(0)x/f(0)n].
Main theoretical parameters
All organic pollutants and their 14 respective molecular
parameters are listed in Table 1. These theoretical parameters are important to observe which sites are active to
be attacked and which bonds are sensitive to be ruptured.
Fukui indices, frontier molecular orbits, bond orders are
key concepts to portray the decomposition sequence of
organic structure in oxidation.
Fukui indices are defined as affinity for radical attack.
They are significant for analysis of site reactive selectivity
among the oxidation paths, as hydrogen substitution by
oxidant radicals and addition of oxidant group to double
bonds are the most events. In this study, f(+)n, f(−)n and
f(0)n stand for the minimum values of nucleophilic attack,
electrophilic attack and ·OH radical attack respectively.
f(+)x, f(−)x and f(0)x do for their respective maximum
values on main chain of both carbon and nitrogen atoms.
The average level of f(+)n, f(−)n and f(0)n are 0.030e,
0.026e, and 0.035e respectively, while those of f(+)x,
f(−)x and f(0)x are 0.098e, 0.113e and 0.091e, respectively.
0.497
0.421
0.381
0.213
0.383
0.218
7.110
4.726
4.622
5.034
0.646
3.579
4.541
1.715
8.801
14.763
1.344
3.827
6.427
2.201
3.198
5.869
4.131
3.096
0.000
Eriochrome blue black R
o-Nitroaniline
Isatin
3,4-Dichloroaniline
N,N-dimethylbenzylamine
2-Nitrophenol
Nitrobenzene
Aniline
Methyl orange
Crystal violet
Phenol
5-Chloro-2-methylbenzylamine
p-Dimethylaminobenzaldehyde
Indole
1,10-Phenanthroline monohydrate
Sulfanilic acid
1-Methylimidazole
Cyanuric acid
Melamine
0.389
0.489
0.203
0.487
0.207
0.399
0.460
0.271
0.217
0.362
0.238
0.492
0.409
0.482
8.788
0.239
12.083
(e)
(Debye)
Rhodamine B
qH
μ
Methylene blue trihydrate
Molecule
− 0.765
− 0.787
− 0.492
− 0.760
− 0.422
− 0.543
− 0.420
− 0.782
− 0.291
− 0.424
− 0.547
− 0.783
− 0.191
− 0.251
− 0.503
− 0.774
− 0.254
− 0.254
− 0.271
− 0.581
− 0.366
(e)
q (CN)n
0.642
0.954
0.202
0.215
0.192
0.168
0.414
0.215
0.342
0.260
0.252
0.192
0.060
0.370
− 0.031
0.202
0.220
0.212
0.451
0.442
0.261
(e)
q (CN)x
Table 1 Molecular descriptors of 21 nitrogenous organic pollutants
0.023
0.141
− 0.230
− 0.038
− 0.061
− 0.208
− 0.047
− 0.010
− 0.012
− 0.101
− 0.009
0.001
− 0.097
− 0.107
− 0.009
− 0.027
− 0.105
− 0.087
− 0.009
− 0.098
− 0.127
(eV)
ELUMO
− 0.232
− 0.421
0.019
− 0.237
− 0.238
− 0.015
− 0.210
− 0.208
− 0.229
− 0.151
− 0.284
− 0.198
− 0.288
− 0.258
− 0.220
− 0.215
− 0.249
− 0.230
− 0.276
− 0.155
− 0.173
(eV)
EHOMO
1.179
1.127
0.909
1.087
1.101
1.093
0.956
1.002
1.320
0.928
0.975
1.288
1.323
0.983
0.973
1.118
0.878
1.199
1.187
0.924
1.038
–
BOn
1.376
1.425
1.597
1.436
1.570
1.563
1.459
1.378
1.396
1.488
1.582
1.414
1.390
1.438
1.397
1.424
1.392
1.462
1.532
1.501
1.418
–
BOx
0.092
0.109
0.165
0.084
0.063
0.112
0.141
0.112
0.124
0.053
0.094
0.123
0.123
0.115
0.105
0.108
0.119
0.082
0.046
0.054
0.037
(e)
f(+)x
0.074
0.097
0.042
0.060
0.025
0.029
0.018
0.026
0.057
0.002
0.012
0.045
0.024
0.023
0.002
0.037
0.026
0.023
0.001
− 0.004
0.009
(e)
f(+)n
0.107
0.210
0.176
0.087
0.134
0.121
0.100
0.141
0.136
0.051
0.032
0.164
0.074
0.125
0.244
0.139
0.076
0.115
0.039
0.055
0.037
(e)
f(−)n
0.044
0.060
0.026
0.048
0.018
0.030
0.027
0.021
0.074
0.004
0.016
0.062
− 0.001
0.025
− 0.016
0.039
0.017
0.048
0.005
− 0.004
0.010
(e)
f(−)x
0.095
0.154
0.161
0.073
0.093
0.107
0.098
0.092
0.104
0.052
0.086
0.105
0.087
0.089
0.123
0.091
0.096
0.067
0.046
0.055
0.036
(e)
f(0)n
0.068
0.082
0.034
0.061
0.023
0.037
0.022
0.024
0.073
0.007
0.016
0.057
0.025
0.037
0.026
0.050
0.025
0.044
0.007
− 0.004
0.012
(e)
f(0)x
Jiang et al. Chemistry Central Journal (2018) 12:16
Page 4 of 8
Jiang et al. Chemistry Central Journal (2018) 12:16
Page 5 of 8
Fig. 2 TOC removal of 21 organic pollutants in SCWO system at different temperatures
The variation of each Fukui indices was extremely huge.
Moreover, it is noticeable that cyanuric acid and 1-methylimidazole always have high values of all Fukui indices.
As stated earlier, NPA has been developed to calculate atomic charges and orbital populations of molecular
wave functions in general atomic orbital basis sets. NPA
is an alternative to conventional Mulliken population
analysis. It improves numerical stability and describes
the charge distribution better. qH is considered as charge
of hydrogen atoms in the molecular structure system.
q(CN)n and q(CN)x, refer to the minimum and maximum
of most negative partial charge on a main-chain carbon or nitrogen atom in the molecule. In this study, qH,
q(CN)n and q(CN)x have the average values of 0.355e,
− 0.498e and 0.295e respectively. At the same time,
the maximum of qH, q(CN)n and q(CN)x reach 0.497e,
− 0.191e and 0.945e respectively, while the minimum of
them are 0.203e, − 0.787e and − 0.032e respectively. It
is also noticeable that the distinguish between the largest and the smallest value of q(CN)x is 0.977e, which is
a wide range for compounds, leading the challenges and
values of our study.
Construction of QSAR models
Using the obtained molecular descriptors as variables,
the correlation models of the predictable rate constants
were developed by Multivariate linear regression (MLR)
method. There are three out of 14 descriptors, f(+)n, qH,
and BOx, correlated well with T
R95 respectively. With the
exclusion of parameters of the least importance, the relationship for degradation rate of organic pollutants was
established using MLR analysis. Three effective models
with their associated data indices are shown in Table 2.
All the predictable values of TR95 values (Pred.) by three
QSAR models and the experimental values are listed in
Table 3.
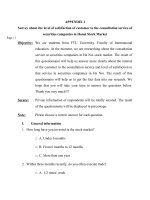
It is widely reported that favorable models are generally determined by R
2 and SE [25, 26]. According to
the predictable performance shown in Fig. 3 [model
(1), (2) and (3)], R
2 increase with the number of variables. To avoid the over-parameterization of model, the
value of leave-one-out cross-validation q
2 closer to cor2
responding R was chosen as the breakpoint criterion.
Therefore, model (2) with two descriptors was considered as the best one, which also fits well with both ideal
regression (R2 = 0.620 > 0.600) and internal validation
(q2 = 0.570 > 0.500). These statistics guarantee that the
model is very robust and predictive. Apart from that, it
can be seen from Fig. 3 that model (2) also had the best
fitting curve between the predicted and experimental
data. Tested TR95 values increase almost linearly with all
organic pollutants except for methylene blue trihydrate
Table 2 Regression models for calculating TR95 of organic pollutants
No
Model
R2
SE
F
q2
Q2EXT
1
TR95 = 599.849 + 1492.671f(+)n
0.502
39.127
19.121
0.380
0.365
2
TR95 = 654.775 + 1761.910f(+)n − 77.211qH
0.620
35.087
14.702
0.570
0.741
3
TR95 = 396.855 + 1874.189f(+)n − 158.091qH + 169.801BOx
0.665
33.905
11.255
0.468
0.884
Jiang et al. Chemistry Central Journal (2018) 12:16
Page 6 of 8
Table 3 Tested and three predicted
TR95 values of 21
organic pollutants
No
Molecule
Tested (K) Pred. (K)
1
2
3
1
Methylene blue trihydrate
540.653
613.283 628.263 616.633
593.883 562.323 568.053
2
Rhodamine B
562.093
3a
Eriochrome blue black R
575.303
601.343 568.463 580.313
4
o-Nitroaniline
587.053
634.183 620.653 621.713
5
Isatin
600.023
638.663 628.063 617.203
6
3,4-Dichloroaniline
621.533
655.083 652.393 647.683
7
N,N-dimethylbenzylamine
622.873
602.833 620.553 604.143
8
2-Nitrophenol
625.273
634.183 608.073 606.393
9
Nitrobenzene
627.043
635.673 654.843 640.203
10a
Aniline
635.453
667.023 669.833 664.133
11
Methyl orange
656.223
617.763 637.443 653.653
12
Crystal violet
658.803
602.833 610.273 610.363
13
Phenol
659.973
684.933 673.593 667.993
14
5-Chloro-2-methylbenzylamine
664.803
638.663 632.673 619.043
15
p-Dimethylaminobenzaldehyde
667.433
626.723 647.833 643.903
16
Indole
669.283
643.143 635.113 653.493
17a
1,10-Phenanthroline
monohydrate
682.103
637.173 662.103 677.503
18
Sulfanilic acid
695.473
689.413 674.093 676.153
19
1-Methylimidazole
703.193
662.543 692.733 714.683
20
Cyanuric acid
715.433
744.643 738.863 743.383
21
Melamine
764.263
710.313 716.103 707.663
a
Samples in an external test set
and crystal violet. Most TR95 values predicted by optimum model are evenly distributed around regression
line. The measured TR95 and those calculated with model
(2) are in observed to be in good agreement. In this view,
it is worthwhile and reasonable to predict degradation
rules by model (2).
Model (2), the optimum model, contains two variables
f(+)n and qH. Each variable plays an important role in the
supercritical water oxidation process, revealing the reaction rules. Firstly, f(+)n is a measurement of the affinity
for nucleophilic attack. When f(+)n is larger, it is easier
of main-chain atom (carbon or nitrogen) to be attacked.
So, compounds with high f(+)n values have weak endurance to oxidants and not so high appropriate temperature,
such as isatin and 3,4-dichloroaniline. Secondly, qH shows
the non-uniformity of electric charge on hydrogen, which
indicates the ease or complexity of valence-bond breakage
of organic molecules. Take Eriochrome blue black R for
example, it is tested as high qH value (0.497e), leading to its
low efficient degradation temperature (TR95 = 575.30 K).
Validation and performance
To check the stability of optimum model, leave-one-out
cross-validation, pairwise correlation coefficients, t test
and Fisher test are employed using SPSS 17.0 for window
program. The values of leave-one-out cross-validation
q2 of three models are shown in Table 2. As can be seen
from that, q
2 of model (2) is the best of three models and
is larger than 0.500. Pairwise correlation coefficients of
model (2) are shown in Table 4. The correlation coefficients order between the tested values of TR95 and independent variables are as follows: f(+)n > qH > BOx. The
correlation coefficient is 0.346 between f(+)n and qH, so
model (2) is acceptable.
The standard regression coefficients and t values of
independent variables for model (2) are listed in Table 5.
And all the absolute t values are larger than the standard one, suggesting that four variables are able to accept.
Furthermore, we could evaluate the correlation degree
of each independent variable by calculating their variation inflation factors (VIF). VIF = 1/(1 − r2), in which
r is the correlation coefficient of multiple regressions
between one variable and the others. If VIF ranges from
1.000 to 5.000, the related equation is acceptable; and
if VIF is larger than 10.000, the regression equation is
unstable and recheck is necessary. It can be seen from
Table 5, most VIF values are slightly over 1.000 and the
maximum is 5.226, indicating model (2) has obvious statistical significance. An external validation of suggested
model has been performed for three compounds, which
are not involved in the model-building process. A test set
was randomly selected with interval of seven, including
Eriochrome blue black R, aniline and 1,10-phenanthroline monohydrate. The Q2EXT value (as shown in Table 2)
of 0.741 (> 0.500) indicates that suggested models have
good predictive potential.
Conclusions
Appropriate reaction temperature is an important factor to design and operate the supercritical water oxidation (SCWO) system. In this paper, QSAR models for
organic compounds were developed on the basis of
Arrhenius equation between oxidation reaction rate and
temperature in SCWO process. According to the calculations of molecular parameters by DFT methods in
Gaussian 09 and Material Studio 7.0, f(+)n, qH and BOx
appeared in established QSAR models focusing on the
impact of Fukui indices and effective temperature, which
reveals they are significant in understanding degradation
Jiang et al. Chemistry Central Journal (2018) 12:16
800
Page 7 of 8
800
Model (1)
Model (2)
700
T(K)
T(K)
700
600
TR95 = 599.849+1492.671f(+)n
500
400
0
4
8
12
16
Compounds
20
400
0
4
8
12
16
20
Compounds
Model (3)
700
T(K)
TR95 = 654.775+1761.910f(+)n-177.211qH
R2 = 0.620, SE = 35.1
500
R2 = 0.502, SE = 39.1
800
Observed TR95
Training Set
600
Test Set
Predicted by Models
TR95 = 396.855+1874.189f(+)n
500
400
600
-158.091qH+169.801BOx
R2 = 0.665, SE = 33.9
0
4
8
12
16
Compounds
20
Fig. 3 Three QSAR models for degradation rules of organic pollutants
Table
4 Correlation coefficient(r) matrix for variables
of model (2)
TR95
f(+)n
qH
BOx
–
TR95
1.000
–
–
f(+)n
0.868
1.000
–
–
− 0.096
0.346
1.000
–
− 0.301
− 0.259
1.000
qH
BOx
0.053
Table 5 Checking statistical values for three models
Regression coefficients
t
Sig.
VIF
Authors’ contributions
All authors read and approved the final manuscript.
Model (1)
Constant
599.849
f(+)n
1492.671 ± 0.708
24.549
0.000
–
4.373
0.000
4.055
Model (2)
Constant
654.775
f(+)n
1760.252 ± 0.835
qH
− 177.214 ± 0.376
Model (3)
Constant
f(+)n
qH
BOx
mechanism. The optimum model has ideal regression
and internal validation (R2 = 0.620, SE = 35.1). The
results of t test and Fisher test suggested that the model
exhibited optimum stability. Both internal and external
validations showed its robustness and predictive capacity. Coincidentally, the obtained determinant factors are
included with degradation process including the affinity
for attack, difficulty of electron loss as well as non-uniformity of valence bond. Together with them, the degradation mechanism could reasonably be illustrated from
each perspective, providing a deeper insight of universal
and propagable oxidation rules.
14.650
0.000
–
5.396
0.000
5.226
− 2.372
0.029
1.010
Competing interests
The authors declare that they have no competing interests.
Availability of data and materials
Not applicable.
396.855
0.716
0.035
–
1874.189 ± 0.889
5.782
0.000
4.067
− 158.091 ± 0.328
169.801 ± 0.225
Acknowledgements
This work was supported by the National Science Foundation of China (Project
No. NSFC 21177083, NSFC key project 21537002), and National water pollution
control key project 2014ZX07214-002.
− 2.157
1.509
0.046
1.009
0.150
1.003
Ethics approval and consent to participate
Not applicable.
Jiang et al. Chemistry Central Journal (2018) 12:16
Funding
This work was supported by the National Science Foundation of China (Project
No. NSFC 21177083, NSFC key project 21537002), and National water pollution
control key project 2014ZX07214-002.
Publisher’s Note
Springer Nature remains neutral with regard to jurisdictional claims in published maps and institutional affiliations.
Received: 21 September 2017 Accepted: 25 January 2018
References
1. Shin YH, Lee H-S, Veriansyah B et al (2012) Simultaneous carbon capture
and nitrogen removal during supercritical water oxidation. J Supercrit
Fluids 72:120–124
2. Angeles-Hernández MJ, Leeke GA, Santos RC (2008) Catalytic supercritical
water oxidation for the destruction of quinoline over M
nO2/CuO mixed
catalyst. Ind Eng Chem Res 48(3):1208–1214
3. Papadopoulos A, Fatta D, Loizidou M (2007) Development and optimization of dark Fenton oxidation for the treatment of textile wastewaters
with high organic load. J Hazard Mater 146(3):558–563
4. Yang Y, Pignatello JJ, Ma J et al (2014) Comparison of halide impacts
on the efficiency of contaminant degradation by sulfate and hydroxyl
radical-based advanced oxidation processes (AOPs). Environ Sci Technol
48(4):2344–2351
5. Dong XQ, Wang YQ, Li XQ et al (2014) Process simulation of laboratory
wastewater treatment via supercritical water oxidation. Ind Eng Chem
Res 53(18):7723–7729
6. Goto M, Nada T, Ogata A et al (1998) Supercritical water oxidation for the
destruction of municipal excess sludge and alcohol distillery wastewater
of molasses. J Supercrit Fluids 13(1–3):277–282
7. Zhang J, Wang SZ, Guo Y et al (2013) Co-oxidation effects of methanol
on acetic acid and phenol in supercritical water. Ind Eng Chem Res
52(31):10609–10618
8. Jimenez-Espadafor F, Portela JR, Vadillo V et al (2010) Supercritical water
oxidation of oily wastes at pilot plant: simulation for energy recovery. Ind
Eng Chem Res 50(2):775–784
9. Tang WZ (2016) Physicochemical treatment of hazardous wastes. CRC
Press, Boca Raton
10. Dearden J, Cronin M, Kaiser K (2009) How not to develop a quantitative
structure–activity or structure–property relationship (QSAR/QSPR). SAR
QSAR Environ Res 20(3–4):241–266
11. Sudhakaran S, Amy GL (2013) QSAR models for oxidation of organic
micropollutants in water based on ozone and hydroxyl radical rate constants and their chemical classification. Water Res 47(3):1111–1122
Page 8 of 8
12. Sudhakaran S, Lattemann S, Amy GL (2013) Appropriate drinking water
treatment processes for organic micropollutants removal based on
experimental and model studies—a multi-criteria analysis study. Sci Total
Environ 442:478–488
13. Sudhakaran S, Calvin J, Amy GL (2012) QSAR models for the removal of
organic micropollutants in four different river water matrices. Chemosphere 87(2):144–150
14. Marulanda V, Bolanos G (2010) Supercritical water oxidation of a heavily
PCB-contaminated mineral transformer oil: laboratory-scale data and
economic assessment. J Supercrit Fluids 54(2):258–265
15. Perez IV, Rogak S, Branion R (2004) Supercritical water oxidation of phenol
and 2,4-dinitrophenol. J Supercrit Fluids 30(1):71–87
16. Cocero M, Alonso E, Torio R et al (2000) Supercritical water oxidation in
a pilot plant of nitrogenous compounds: 2-propanol mixtures in the
temperature range 500–750 °C. Ind Eng Chem Res 39(10):3707–3716
17. Anikeev V, Belobrov N, Piterkin R et al (2006) Results of testing the plant
for supercritical water oxidation of nitroglycerin and diethylene glycol
dinitrate. Ind Eng Chem Res 45(24):7977–7981
18. Crain N, Tebbal S, Li L, Gloyna EF et al (1993) Kinetics and reaction
pathways of pyridine oxidation in supercritical water. Ind Eng Chem Res
32(10):2259–2268
19. Vadillo V, Sánchez-Oneto J, Portela JR et al (2013) Problems in supercritical water oxidation process and proposed solutions. Ind Eng Chem Res
52(23):7617–7629
20. Kritzer P, Dinjus E (2001) An assessment of supercritical water oxidation
(SCWO): existing problems, possible solutions and new reactor concepts.
Chem Eng J 83(3):207–214
21. Tan YQ, Shen ZM, Guo WM et al (2014) Temperature sensitivity of organic
compound destruction in SCWO process. J Environ Sci 26(3):512–518
22. Apablaza G, Montoya L, Morales-Verdejo C et al (2017) 2D-QSAR and
3D-QSAR/CoMSIA studies on a series of (R)-2-((2-(1H-Indol-2-yl)ethyl)
amino)-1-phenylethan-1-ol with human beta(3)-adrenergic activity.
Molecules 22(3):404
23. Cardoso SP, Gomes JACP, Borges LEP et al (2007) Predictive QSPR analysis
of corrosion inhibitors for super 13% Cr steel in hydrochloric acid. Braz J
Chem Eng 24(4):547–559
24. Zhu HC, Shen ZM, Tang QL et al (2014) Degradation mechanism study of
organic pollutants in ozonation process by QSAR analysis. Chem Eng J
255:431–436
25. Pagare AH, Kankate RS, Shaikh AR (2015) 2D and 3D QSAR using kNNMFA method of the novel 3, 4-dihydropyrimidin-2 (1H)-one urea derivatives of N-aryl urea as an antifungal agents. Curr Pharma Res 5(2):1473
26. Xu J, Huang SC, Luo HB et al (2010) QSAR studies on andrographolide
derivatives as alpha-glucosidase inhibitors. Int J Mol Sci 11(3):880–895