Ligand exchange method for determination of mole ratios of relatively weak metal complexes: A comparative study
Bạn đang xem bản rút gọn của tài liệu. Xem và tải ngay bản đầy đủ của tài liệu tại đây (1.62 MB, 7 trang )
(2018) 12:143
Mabrouk et al. Chemistry Central Journal
/>
Chemistry Central Journal
Open Access
RESEARCH ARTICLE
Ligand exchange method
for determination of mole ratios of relatively
weak metal complexes: a comparative study
Mokhtar Mabrouk1,2, Sherin F. Hammad1, Mohamed A. Abdelaziz1,3 and Fotouh R. Mansour1,2*
Abstract
Ligand exchange method is introduced as an alternative to Job’s and mole ratio methods for studying the stoichiometry of relatively weak metal complexes in solutions. The method involves adding varying amounts of a ligand (L) to
an excess constant amount of a colored complex (MX) with appropriate stability and molar absorptivity. The absorbance of each solution is measured at the λmax of the initial complex, MX, and plotted against the concentration of the
studied ligand, L. If the newly formed complex ML does not absorb at the λmax of the initial complex, then attenuation
of the absorbance of the initial complex on adding varying quantities of the investigational ligand gives an inverse
calibration line that intersects with the calibration curve of initial complex at a given point. If a line parallel to the ordinate is drawn from this point to the x-axis, the ratio of the two parts of the x-axis to the left and to the right (α/β) gives
the metal to ligand molar ratio in the complex formed, ML. The new method has been applied to the study of the
composition of iron (III) complexes with three bisphosphonate drugs: alendronate, etidronate, and ibandronate. The
mole ratio was found to be 1:1 with the three investigated bisphosphonates and results were further confirmed by
Job’s and mole ratio methods. The ligand exchange method is simpler, quicker, easier to perform and more accurate
than Job’s and mole ratio methods for studying weak and relatively weak complexes.
Keywords: Ligand exchange method, Mole ratio method, Job’s method, Bisphosphonates, Relatively weak
complexes
Introduction
The mole ratio is the proportion of number of moles of
any two chemical entities involved in a compound or a
chemical reaction. Studying the mole ratio is important to
calculate the reaction yield, determine the stoichiometry
and monitor the reaction kinetics. Several spectrophotometric methods were developed for the determination
of the molar ratio of metal complexes. The first method
goes back to the contributions of Ostromisslensky [1] and
Job [2], and was widely known as Job’s method of continuous variations. In this method, a series of solutions are
prepared by mixing varying proportions of the metal and
ligand, keeping the sum of the total molar concentrations
*Correspondence:
2
Pharmaceutical Services Center, Faculty of Pharmacy, Tanta University,
Tanta 31111, Egypt
Full list of author information is available at the end of the article
constant. The absorbance of each solution is then plotted
against the mole fraction of either the ligand or metal.
The position of the maximum in the resulting curve, or
minimum in some cases [3], gives the mole fraction. The
simplicity of the method made it widely applied for the
study of various metals and association complexes [4–9],
in spite of its limitations. For instance, strong complexes
give triangular plots from which the position of the maximum is easily determined, while the plots of weak complexes are highly curved leading to unreliable results.
Normalized absorbance plots (A/Amax vs. mole fraction)
gave sharper plots at the maxima and allowed for better
location of the mole ratio [10], but for weak complexes,
these normalized Job plots were still highly curved.
Besides the method of continuous variations, the mole
ratio method has been used frequently since its introduction by Yoe and Jones [11]. In this method, a series of
solutions are prepared by varying the amount of ligand
© The Author(s) 2018. This article is distributed under the terms of the Creative Commons Attribution 4.0 International License
(http://creativecommons.org/licenses/by/4.0/), which permits unrestricted use, distribution, and reproduction in any medium,
provided you give appropriate credit to the original author(s) and the source, provide a link to the Creative Commons license,
and indicate if changes were made. The Creative Commons Public Domain Dedication waiver (http://creativecommons.org/
publicdomain/zero/1.0/) applies to the data made available in this article, unless otherwise stated.
Mabrouk et al. Chemistry Central Journal
(2018) 12:143
in each solution while the amount of metal is kept constant. If a stable complex is formed, a plot of absorbance
versus mole ratio of ligand to metal (L/M) gives a straight
line that rises until it reaches the point corresponding to
the mole ratio (L/M), then it breaks to a differently sloped
line. For moderately stable complex, the mole ratio corresponds to the point of intersection of the tangents of
straight-line portions of the plot. However, if a weak complex is formed, a very curved plot is obtained, making
the identification of the molar ratio of these complexes
uncertain. As a result, several chemical [12] and mathematical modifications [13–15] have been made to the
basic mole ratio method so that it can reliably be applied
to study the composition of weak complexes. However,
these modifications make the method relatively more
complicated and are only applicable when the ligand has
significant absorbance which is not always the case.
A recent method based on ligand exchange has
been introduced by Mansour and Danielson [16]. The
method involves adding varying amounts of the ligand
(L), whose combining ratio with metal (M) is being
studied, to an excess constant amount of a colored
complex (MX) with appropriate stability and molar
absorptivity. The absorbance of each solution is measured at the λmax of the initial complex, MX, and plotted
against the concentration of the studied ligand, L. If the
Page 2 of 7
newly formed complex, ML, does not absorb at the λmax
of the initial complex, then attenuation of the absorbance of the initial complex on adding varying quantities
of the investigational ligand gives an inverse calibration
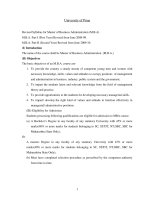
line that intersects with the calibration curve of initial complex at a given point (Fig. 1). If a line parallel
to the ordinate is drawn from this point to the x-axis,
the ratio of the two parts of the x-axis to the left and to
the right (α/β) gives the metal to ligand molar ratio in
the complex formed. A video that explains the principle
of Mansour-Danielson’s method is shown in Additional
file 1.
In our previous work, the ligand exchange method
has been applied for determination of mole ratios other
than 1:1 [16]. In this work, we present the mathematical proof of the ligand exchange method for the first
time and apply it for determination of relatively weak
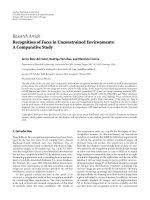
complexes of selected bisphosphantes (Fig. 2) with
ferric ion [9]. The ferric complexes of bisphosphonates are used for the spectrophotometric determination of bisphosphonates in pharmaceutical tablets [9].
Determination of the mole ratios of these complexes is
important to adjust the amount added of the ferric salt
in the experimental part. The ligand exchange method
was also compared with Job’s and mole ratio methods;
its advantages over these commonly employed methods
are discussed.
Fig. 1 Illustrative plots of the ligand exchange method using MX as an initial complex (*) for studying the mole ratios of complexes: ML (●), ML2
(▲), and M
L3 (■)
Mabrouk et al. Chemistry Central Journal
(2018) 12:143
Page 3 of 7
Fig. 2 Molecular structures of studied bisphosphonate drugs. All compounds are presented in anhydrous forms
Theory of Mansour–Danielson’s method of ligand
exchange
Suppose that MX and ML are two complexes of a metal
M with two ligands, X and L, where MX is a colored complex, ML is a colorless complex and MX is less stable than
ML. For a certain concentration of the complex MX, the
absorbance depends on the molar absorptivity of MX (εMX)
and the concentration (CMX) according to the equation:
A = εMX · CMX
(1)
If a certain amount of ligand L was added to the previous MX solution, a displacement reaction will take place
and the absorbance will decrease as shown in Fig. 1. The
decrease in the absorbance depends on the concentration
of the ligand L (CL) and the mole ratio of the ML complex
(n) according to the equation:
A = εMX · (CMX − nCL )
From Eq. 2, we get:
(2)
A = εMX · CMX − n εMX · CL
(3)
Equation 3 is a straight line equation (y = a ± bx) with
an intercept equals εMX·CMX and a slope equals −n·εMX.
If A was plotted against CL, a straight line with a negative slope will be obtained as shown in Fig. 1. The mole
ratio can be determined graphically from the overlay of
the two calibration curves as follows:
A straight line parallel to the y-axis is drawn from the
intersection point of the calibration curves to divide the
x-axis into two parts: α and β. The length of both parts
(α and β) can be calculated from the length of the parallel
line (δ) and the slopes of the calibration curves where:
α=
δ
δ
=
Slope of Eq1
εMX
(4)
while,
β=
δ
δ
=
Slope of Eq2
nεMX
(5)
From Eqs. 4 and 5, we get:
α
=n
β
(6)
Experimental
Instrumentation
Jenway 3510 (Jenway, UK) and Biochrom libra S80 (Biochrom, Cambridge, UK) were employed in all pH and
absorbance measurements, respectively.
Materials
Alendronate sodium trihydrate, etidronate disodium,
and ibandronate sodium monohydrate of pharmaceutical grade were kindly provided by Sigma Pharmaceutical
Industries (Quesna, Menofyia, Egypt). All other chemicals and solvents used were of analytical ACS grade, purchased from Fisher Scientific (Fair Lawn, NJ, USA) and
Sigma-Aldrich (St. Louis, MO, USA).
Standard solutions
Fe(III)-salicylate solution was prepared at 10 mM in
water/methanol (50:50, pH 3.2) and was proved to be
stable for months when kept refrigerated. Fe(III) chloride stock solution (for the mole ratio and Job’s methods)
was prepared at 10 mM in 2 M HClO4. Etidronate disodium stock solution was prepared at 10 mM in two different diluents: 2 M HClO4 for both the mole ratio and
Job’s methods and water/methanol (50:50, pH 3.2) for
the ligand exchange method. Similarly, stock solutions
of alendronate sodium and ibandronate sodium were
prepared.
Procedures
Ferric salicylate complex calibration curve
A series of standard solutions of ferric salicylate in the
range of 0.1–0.6 mM were prepared by accurately transferring appropriate aliquots of ferric salicylate stock solution (10 mM) into a series of 10 mL calibrated volumetric
flasks, then completed to the mark with water/methanol
Mabrouk et al. Chemistry Central Journal
(2018) 12:143
Page 4 of 7
(50:50, pH 3.2) (Ionic strength was adjusted with 0.5 M
NaCl). Absorbance at 535 nm was measured and plotted
against ferric salicylate concentration.
Ligand exchange method
Aliquots in the range 0.2–1.8 µmol of etidronate disodium were accurately transferred into a series of 10 mL
volumetric flasks containing 3 µmol ferric salicylate,
then completed to the mark with water/methanol
(50:50, pH 3.2) (Ionic strength was adjusted with 0.5 M
NaCl). Absorbance at 535 nm was measured and plotted
against concentration. A similar procedure was applied
to determine the mole ratio of Fe(III)-alendronate and
Fe(III)-ibandronate.
Job’s method
Standard nine mixtures of ferric chloride (in 2 M H
ClO4)
and etidronate (in 2 M HClO4) were prepared by adding
aliquots of Fe(III) equivalent to 1 − 9 µmol into a series of
10 mL volumetric flasks containing aliquots of etidronate
equivalent to 9 − 1 µmol so that each flask contains a
total number of 10 µmol. Each flask is completed to the
mark using H
ClO4 (2 M). Job’s graph is obtained by plotting absorbance at 300 nm against the mole fraction of
Fe(III) ion. The same procedure was repeated with ibandronate and alendronate.
Mole ratio method
Standard mixtures of ferric chloride (in 2 M HClO4) and
etidronate (in 2 M H
ClO4) were prepared by adding aliquots of Fe(III) equivalent to 0.4–30 µmol into a series of
10 mL volumetric flasks containing 5 µmol of etidronate.
Each flask is completed to the mark using HClO4 (2 M).
The mole ratio graph is obtained by plotting absorbance
at 300 nm against the mole ratio (Fe(III)/etidronate). The
same procedure was applied to study the stoichiometry
of Fe(III)-ibandronate and Fe(III)-alendronate.
Results and discussion
Absorption spectra
The absorption spectra of reacting species, Fe(III) ions
and etidronate, together with the absorption spectrum
of their complex have been recorded in 2 M perchloric
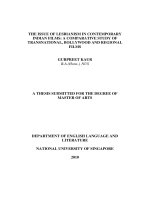
acid in the wavelength range from 200 to 400 nm (Fig. 3).
Spectra of iron(III) perchlorate and iron(III)-etidronate
complex show an absorption maximum at 239 and
252 nm, respectively. On the other hand, etidronate and
the other studied bisphosphonates do not show significant absorbance in the spectral region indicated above
[17]. For Job’s and mole ratio methods, all absorbance
measurements were performed at 300 nm where the
absorbance difference between the complex and Fe(III)
ions approaches maximum, and the absorption of metal
Fig. 3 Absorption spectra of (I) etidronate (1 × 10⁻³ M), (II) FeCl3
(2 × 10⁻⁴ M), and (III) F eCl3 (2 × 10⁻⁴ M) + etidronate (4 × 10⁻⁴ M)
all in 2 M perchloric in addition to (IV) the absorption Spectrum of
Fe(III)-salicylate in water/methanol (50:50, pH 3.2)
ions is low. For the ligand exchange method, all spectrophotometric measurements were conducted at 535 nm,
the wavelength that corresponds to the absorption maximum of iron(III)-salicylate at the conditions employed.
Ligand exchange method using Fe(III)‑salicylate
According to a previously published work that studied
the effect of pH and ionic strength on the absorbance
of Fe(III)-salicylate complex [18], the absorbance of the
complex was found constant over a pH range of (2.5–3.5).
After trying several solvents, a 50% methanol at pH 3.2
was chosen owing to the high Fe(III)-salicylate absorbance and reasonable plateau that ensures the robustness
of the method against small changes in pH. A solution
of 0.5 M NaCl was used to adjust the ionic strength and
keep it constant over all the following procedures.
An overlay of the direct and inverse calibration curves
of ferric salicylate and bisphosphonate, respectively, is
used to determine the combining metal to ligand ratio
(Fig. 4). The quotient of α/β is equal to the stoichiometric ratio of metal to bisphosphonate ligand and was found
to be 1:1 with the three investigated bisphosphonates.
Calibration curves of the three studied bisphosphonates
were linear in the range (0.02–0.18) mM with correlation
coefficients (r) equal − 0.999, − 0.997 and − 0.996 with
etidronate, alendronate, and ibandronate, respectively.
Comparison to other mole ratio methods
The 1:1 ratio determined for the Fe(III) complex with
alendronate is congruent with the work of Kuljanin and
his colleagues [9] that is based on Job’s and mole ratio
Mabrouk et al. Chemistry Central Journal
(2018) 12:143
Page 5 of 7
Fig. 5 Job plots of Fe(III) complexes with etidronate (■), alendronate
(▲), and ibandronate (●) ([Fe(III)] + [bisphosphonate]) = 1 mM
Fig. 6 Molar ratio method: plots of Fe(III) complex with etidronate
(■), alendronate (▲) and ibandronate (●) ([bisphosphonate]
= 0.5 mM)
Fig. 4 An overlay of Fe(III)-salicylate calibration curve (×) with inverse
calibration curves of a ibandronate (●), b alendronate (▲), and c
etidronate (■)
methods. On the other hand, results of ibandronate and
etidronate complexes with Fe(III) have been confirmed
by performing Job’s and mole ratio methods. The Job’s
plots (Fig. 5) showed a peak at a mole fraction of 0.5,
whereas the tangents of straight-line portions of the mole
ratio curves intersect at a value of 1 (Fig. 6). Therefore,
results of both methods provide a further confirmation of
the 1:1 ratio determined by the ligand exchange method.
Mabrouk et al. Chemistry Central Journal
(2018) 12:143
Compared to the Job and mole ratio methods, the ligand
exchange method offers several advantages: (i) it enables
the study of the composition of colorless metal complexes
using a colorimetric technique and the green LED lamp
that is commercially available in most colorimeters (ii) it
requires fewer steps than Job’s and the mole ratio methods
because fewer number of points can be adequate to plot
a straight line and several ligands can be studied against
a single calibration curve of the initial complex, (iii) the
ligand exchange method is more accurate and more precise than Job’s and the mole ratio methods for determination of weak and relatively weak complexes; determining
the mole ratio using these methods in this case is subjective due to the curved lines. As shown in Additional
file 2: Fig. S1, different tangents can be drawn for the same
group of points, which may lead to false conclusions while
in the ligand exchange method, there is no need to draw
tangents which obviates bias and decreases the risk of
error. (iv) The ligand exchange method could be used for
metals other than ferric, such as Cu(II), and for determination of mole ratios other than 1:1 [16] which indicates
the generality of the method and (v) neither Job’s nor the
mole ratio methods can be used unless one of the studied reactants or the formed complex are absorbing. In this
case, the ligand exchange will be the method of choice.
Conclusion
The ligand exchange method can reliably be used as an
alternative to Job’s and mole ratio methods for the determination of formula of complexes with the aid of a simple colorimeter, and could be superior in determining
the composition of weak and relatively weak complexes.
The method has successfully been applied to the study
of the composition of ferric ion complexes with the nonchromophoric bisphosphonates: alendronate, etidronate
and ibandronate. The ligand exchange method gives
straight lines from which the exact mole ratio can be
determined. The method does not require tangent drawing which can be subjective and may lead to inaccurate
conclusions especially when weak complexes are studied.
The ligand exchange method could also be preferable for
determining the composition of high ratio complexes and
that will be the focus of our future research.
Additional files
Additional file 1: A video that explains the principle of MansourDanielson’s method.Additional file 2: Fig. S1. Molar ratio’s plots for Fe(III)
complex with ibandronate showing different conclusions for the same
results depending on the drawn tangents.
Page 6 of 7
Additional file 2: Fig. S1. Molar ratio’s plots for Fe(III) complex with ibandronate showing different conclusions for the same results depending on
the drawn tangents.
Authors’ contributions
MM participated in the study design and the results discussion and revised
the manuscript. SFH participated in the study design and the results
discussion and revised the manuscript. MAA conducted the practical work,
participated in the results discussion and the preparation and writing of the
manuscript. FRM proposed the study design, participated in the results discussion, literature review, manuscript preparation and revision. All authors read
and approved the final manuscript.
Author details
1
Department of Pharmaceutical Analytical Chemistry, Faculty of Pharmacy,
Tanta University, Tanta 31111, Egypt. 2 Pharmaceutical Services Center, Faculty
of Pharmacy, Tanta University, Tanta 31111, Egypt. 3 Department of Pharmaceutical Analytical Chemistry, Faculty of Pharmacy, Kafrelsheikh University,
Kafrelsheikh 33511, Egypt.
Competing interests
The author declares that they have no competing interests.
Availability of data and materials
All data and materials are all provided.
Consent for publication
All the authors gave their consent for the publication of this article.
Ethics approval and consent to participate
The experiment was conducted according to the rules of the Ethical committee of the Tanta University, Egypt.
Publisher’s Note
Springer Nature remains neutral with regard to jurisdictional claims in published maps and institutional affiliations.
Received: 9 May 2018 Accepted: 4 December 2018
References
1. Ostromisslensky I (1911) Über eine neue, auf dem Massenwirkungsgesetz
fußende Analysenmethode einiger binärer Verbindungen. Zur Prioritätsfrage. Berichte der Dtsch Chem Gesellschaft 44:1189–1190. https://doi.
org/10.1002/cber.191104401176
2. Job P (1928) Formation and stability of inorganic complexes in solution.
Ann Chim 9:113
3. Vosburgh WC, Cooper GR (1941) Complex Ions. I. The identification of
complex ions in solution by spectrophotometric measurements. J Am
Chem Soc 63:437–442. https://doi.org/10.1021/ja01847a025
4. Qin Z, Niu W, Tan R (2009) Spectrophotometric method for the determination of telmisartan with congo red. J Anal Chem 64:449–454. https://
doi.org/10.1134/S1061934809050049
5. Zayed SIM (2009) Two charge-transfer complex spectrophotometric
methods for the determination of sulpiride in pharmaceutical formulations. Cent Eur J Chem 7:870–875. https://doi.org/10.2478/s1153
2-009-0091-2
6. Shaalan RA-A (2010) Improved spectrofluorimetric methods for determination of penicillamine in capsules. Cent Eur J Chem 8:892–898. https://
doi.org/10.2478/s11532-010-0049-4
7. Nagaraj P, Aradhana N, Shivakumar A et al (2009) Spectrophotometric
method for the determination of chromium (VI) in water samples.
Environ Monit Assess 157:575–582. https://doi.org/10.1007/s1066
1-008-0557-2
Mabrouk et al. Chemistry Central Journal
8.
9.
10.
11.
12.
13.
(2018) 12:143
Ostović D, Stelmach C, Hulshizer B (1993) Formation of a chromophoric complex between alendronate and copper(II) ions. Pharm Res
10:470–472
Kuljanin J, Janković I, Nedeljković J et al (2002) Spectrophotometric determination of alendronate in pharmaceutical formulations via complex
formation with Fe(III) ions. J Pharm Biomed Anal 28:1215–1220. https://
doi.org/10.1016/S0731-7085(02)00021-3
Likussar W, Boltz DF (1971) Theory of continuous variations plots and a
new method for spectrophotometric determination of extraction and
formation constants. Anal Chem 43:1265–1272. https://doi.org/10.1021/
ac60304a006
Yoe JH, Jones AL (1944) Colorimetric determination of iron with
disodium-1,2-dihydroxybenzene-3,5-disulfonate. Ind Eng Chem Anal Ed
16:111–115. https://doi.org/10.1021/i560126a015
Harvey AE, Manning DL (1950) Spectrophotometric methods of establishing empirical formulas of colored complexes in solution. J Am Chem
Soc 72:4488–4493. https://doi.org/10.1021/ja01166a044
Diehl H, Lindstrom F (1959) Eriochrome black t and its calcium and
magnesium derivatives. Anal Chem 31:414–418. https://doi.org/10.1021/
ac60147a026
Page 7 of 7
14. Chriswell CD, Schilt AA (1975) New and improved techniques for applying the mole ratio method to the identification of weak complexes in
solution. Anal Chem 47:1623–1629
15. Nan Z, Chun-Xiang H (1993) Improved mole ratio method by dual-wavelength spectrophotometry. Analyst 118:1077. https://doi.org/10.1039/
an9931801077
16. Mansour F, Danielson N (2012) Ligand exchange spectrophotometric
method for the determination of mole ratio in metal complexes. Microchem J 103:74–78
17. Mabrouk M, Hammad SF, Abdelaziz MA, Mansour FR (2018) Determination of etidronate in pharmaceutical formulations by RP-HPLC method
with indirect UV detection. Arab J Med Sci 1:1–4. https://doi.org/10.5455/
ajms.7
18. Mansour FR, Shafi MA, Danielson ND (2012) Flow injection determination of carboxylate, phosphate, and sulfhydryl compounds using metal
exchange complexation. Talanta 95:12–17. https://doi.org/10.1016/j.talan
ta.2012.03.017
Ready to submit your research ? Choose BMC and benefit from:
• fast, convenient online submission
• thorough peer review by experienced researchers in your field
• rapid publication on acceptance
• support for research data, including large and complex data types
• gold Open Access which fosters wider collaboration and increased citations
• maximum visibility for your research: over 100M website views per year
At BMC, research is always in progress.
Learn more biomedcentral.com/submissions