Synthesis and structural properties of 2‑((10‑alkyl‑10H‑phenothiazin‑3‑yl) methylene)malononitrile derivatives; a combined experimental and theoretical insight
Bạn đang xem bản rút gọn của tài liệu. Xem và tải ngay bản đầy đủ của tài liệu tại đây (2.11 MB, 15 trang )
Al‑Zahrani et al. Chemistry Central Journal (2016) 10:13
DOI 10.1186/s13065-016-0158-z
RESEARCH ARTICLE
Open Access
Synthesis and structural properties
of 2‑((10‑alkyl‑10H‑phenothiazin‑3‑yl)
methylene)malononitrile derivatives; a
combined experimental and theoretical insight
Fatimah Ali Al‑Zahrani1, Muhammad Nadeem Arshad1,2* , Abdullah M. Asiri1,2, Tariq Mahmood3,
Mazhar Amjad Gilani4,5 and Reda M. El‑shishtawy1
Abstract
Background: Donor acceptor moieties connected through π-conjugated bridges i.e. D-π-A, in order to facilitate the
electron/charge transfer phenomenon, have wide range of applications. Many classes of organic compounds, such as
cyanine, coumarin carbazole, indoline, perylene, phenothiazine, triphenylamine, tetrahydroquinoline and pyrrole can
act as charge transfer materials. Phenothiazines have been extensively studied as electron donor candidates due to
their potential applications as electrochemical, photovoltaic, photo-physical and DSSC materials.
Results: Two phenothiazine derivatives, 2-((10-hexyl-10H-phenothiazin-3-yl)methylene)malononitrile (3a) and
2-((10-octyl-10H-phenothiazin-3-yl)methylene)malononitrile (3b) have been synthesized in good yields and char‑
acterized by various spectroscopic techniques like FT-IR, UV–vis, 1H-NMR, 13C-NMR, and finally confirmed by single
crystal X-ray diffraction studies. Density functional theory (DFT) calculations have been performed to compare the
theoretical results with the experimental and to probe structural properties. In order to investigate the excited state
stabilities the absorption studies have been carried out experimentally as well as theoretically.
Conclusions: Compound 3a crystallises as monoclinic, P2 (1)/a and 3b as P-1. The X-ray crystal structures reveal that
asymmetric unit contains one independent molecule in 3a, whereas 3b exhibits a very interesting behavior in having
a higher Z value of 8 and four independent molecules in its asymmetric unit. The molecular electrostatic potential
(MEP) mapped over the entire stabilized geometries of the molecules indicates the potential sites for chemical reac‑
tivities. Furthermore, high first hyperpolarizability values entitle these compounds as potential candidates in photonic
applications.
Keywords: Phenothiazine, X-ray, DFT, MEP, NBO, NLO
Background
In few years, a great interest has developed in molecules
having electron donor–acceptor (D–A) properties and
their modern applications as dye sensitized solar cells
(DSSC) [1], photosensitizers [2] and redox sensitizers [3].
The metal based donor–acceptor (D–A) complexes are
well known where a metal atom behaves as an electron
*Correspondence:
1
Chemistry Department, Faculty of Science, King Abdulaziz University,
P.O. Box 80203, Jeddah 21589, Saudi Arabia
Full list of author information is available at the end of the article
acceptor and ligands as electron donor species [4–6].
Ruthenium metal is a key contributor in the synthesis of
such complexes. To avoid the cost of metal and its environmental hazards there is a space for the synthesis of
new organic donor–acceptor molecules. A salient feature of such organic based (D–A) molecules is that donor
acceptor moieties are connected through π-conjugated
bridges i.e. D-π-A, in order to facilitate the electron/
charge transfer phenomenon [7]. The classes of organic
compounds that have been evaluated as (D–A) candidates include cyanine [8], coumarin [9], carbazole [10],
© 2016 Al-Zahrani et al. This article is distributed under the terms of the Creative Commons Attribution 4.0 International License
( which permits unrestricted use, distribution, and reproduction in any medium,
provided you give appropriate credit to the original author(s) and the source, provide a link to the Creative Commons license,
and indicate if changes were made. The Creative Commons Public Domain Dedication waiver ( />publicdomain/zero/1.0/) applies to the data made available in this article, unless otherwise stated.
Al‑Zahrani et al. Chemistry Central Journal (2016) 10:13
Page 2 of 15
indoline [11], perylene [12], phenothiazine [13], triphenylamine [14], tetrahydroquinoline [15] and pyrrole [16].
Molecules containing phenothiazine as electron donor
part have been extensively studied due to their electrochemical [17], photovoltaic [18], photo-physical [19] and
DSSC applications [1]. The synthesis of phenothiazine
derivatives and their DSSC applications were claimed by
many investigators, and the best results were produced in
the solar cells where phenothiazine was used as electron
donor and boradiazaindacene as electron acceptor candidates [19]. In addition to their physical applications, phenothiazine derivatives have been recognized as potent
anti-psychotic [20], anti-infective [21], antioxidant,
anti-cancer [22] and anti-Parkinson agents [23]. These
were also qualified as valuable MALT1 protease [24],
cholinesterase [25], and butyryl-cholinesterase enzyme
inhibitors [26].
In addition to our recent work [27–32], here we report
the synthesis and structural properties of two new phenothiazine derivatives (Fig. 1). Both compounds have
been synthesized in high yields and characterized by
spectroscopic as well single crystal diffraction studies.
The DFT investigations have been performed to validate the spectroscopic results, and to investigate other
structural properties like frontier molecular orbital
(FMO) analysis, molecular electrostatic potential
(MEP), natural bond orbital (NBO) analysis (intra and
inter molecular bonding and interaction among bonds),
and first hyperpolarizability analysis (nonlinear optical
response).
H
N
(i)
Results and discussion
The synthesis of two phenothiazine derivatives 3a and
3b has been accomplished in three steps beginning from
10-phenothiazine resulting in good yields (details are
given in the experimental section). These compounds
have been characterized by 1H-NMR, 13C-NMR, FT-IR
and UV–vis. spectroscopic techniques, and finally their
structures have been confirmed by X-ray diffraction
analysis. Computational studies have been carried out to
compare the theoretically calculated spectroscopic properties with the experimental results, and to investigate
some structural properties as well.
X‑ray diffraction analysis
Both compounds 3a and 3b have been recrystallized in
methanol under slow evaporation method in order to
grow suitable crystals to ensure the final structures, and
to study their three dimensional interactions. The compound 3a, bearing a hexyl group at nitrogen, is crystallized in a monoclinic system having space group P21/a
and 3b containing an octyl substituent at nitrogen has
been crystallized in a triclinic system having space group
P-1. Complete crystal data parameters for both compounds have been provided in Table 1. The ORTEP views
of both 3a and 3b are shown in Fig. 2.
While analyzing the crystal structure it is observed that
compound 3a exists as single independent molecule in
an asymmetric unit. On the other hand, an interesting
behavior has been observed for 3b which shows a high
Z value of 8 and contains four independent molecules
R
N
R; -C6H13 (Compound 1a)
R; -C8H17 (Compound 1b)
S
S
(ii)
R
N
H
S
NC
CN
R; -C6H13 (Compound 3a)
R; -C8H17 (Compound 3b)
(iii)
R
N
H
S
O
R; -C6H13 (Compound 2a)
R; -C8H17 (Compound 2b)
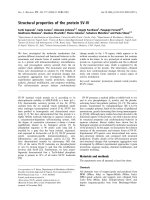
Fig. 1 General synthetic scheme of title compounds 3a and 3b. (i) 1-Bromohexane (Compound 3a), 1-Bromooctane (Compound 3b), KOH, KI,
DMSO; (ii) DMF, POCl3, 0 °C; (iii) Malonitrile, Piperidine, EtOH
Al‑Zahrani et al. Chemistry Central Journal (2016) 10:13
Page 3 of 15
Table 1 Crystal data and structure refinement parameters of 3a and 3b
Identification code
3a
3b
Empirical formula
C22H21N3S
C24H25N3S
Formula weight
359.48
387.53
Temperature/K
296.15
296.15
Crystal system
Monoclinic
Triclinic
Space group
P21/a
P-1
a/Å
8.3072 (11)
16.4823 (7)
b/Å
13.5441 (19)
16.9423 (8)
c/Å
17.410 (2)
17.6368 (7)
α/°
90
106.027 (4)
β/°
92.275 (12)
110.499 (4)
γ/°
90
96.744 (4)
Volume/Å3
1957.3 (4)
4306.6 (3)
Z
4
8
Wave length Å
0.71073
0.71073
Diffraction radiation type
MoKα
MoKα
ρcalcmg/mm3
1.220
1.195
µ/mm−1
0.175
0.164
F (000)
760.0
1648.0
Crystal size/mm3
0.340 × 0.140 × 0.060
0.41 × 0.13 × 0.11
2θ range for data collection
5.756 to 59.036°
5.7 to 59.02°
Index ranges
−8 ≤ h ≤ 10, −17 ≤ k ≤ 17, −21 ≤ l ≤ 22
−21 ≤ h ≤ 22, −21 ≤ k ≤ 23, −23 ≤ l ≤ 24
Independent reflections
4728 [R (int) = 0.0988]
20,881 [R (int) = 0.0574]
Data/restraints/parameters
4728/0/236
20,881/0/1013
Goodness-of-fit on F2
0.837
1.016
Final R indexes [I >=2σ (I)]
R1 = 0.0659, wR2 = 0.1162
R1 = 0.0752, wR2 = 0.1475
Final R indexes [all data]
R1 = 0.2559, wR2 = 0.1809
R1 = 0.2263, wR2 = 0.2183
Largest diff. peak/hole/e Å−3
0.18/−0.20
0.36/−0.29
Reflections collected
11,893
in its asymmetric unit (see Fig. 3) [C1–C24 molecule A,
C25–C48 molecule B, C49–C72 molecule C and C73–
C96 molecule D, (atomic labeling is in accordance with
the compound 3a, Fig. 2)].
The thiazine rings are not planar having the root mean
square (rms) deviation values of 0.1721 (1) Å, 0.1841 (2)
Å, 0.2184 (3) Å, 0.1392 (2) Å and 0.1593 (2) Å for compounds 3a and 3b (molecule A, molecule B, molecule C,
molecule D) respectively. In compound 3a, the two aromatic rings are oriented at a dihedral angle of 24.80(1)°,
while the thiazine ring is oriented at dihedral angles of
13.33 (1)° and 12.56 (1)° with reference to ring 1 (C1–C6)
and ring 2 (C7–C12), respectively.
In 3b, having four molecules A, B, C and D in the
asymmetric unit, the dihedral angles between the two
aromatic rings are 24.85 (1)°, 32.41 (2)°, 18.83 (2)° and
23.80 (2)°. The observed orientation angles of thiazine
rings with adjacent aromatic rings are 14.51 (2)°, 11.88
(2)° in molecule A, 16.28 (2)°, 16.49 (2)° in molecule B,
10.03(2)°, 10.16(2)° in molecule C and 13.63 (2)°, 11.74
53,398
(2)° in molecule D. These values are comparable with the
already reported related structures [33–36], the difference is merely due to a variety of substituted groups on
aromatic ring and nitrogen atom. The crystal structures
revealed that the malononitrile group (NC–CH–CN) was
not co-planar with the aromatic rings but was twisted at
dihedral angles of 21.21 (2)°, 3.02 (5)°, 7.54 (5)°, 14.96 (4)°
and 13.05 (5)° in 3a and 3b (A, B, C, D) respectively. The
puckering parameters for molecule 3a are QT = 0.424
Å, θ = 77.8 (5)° and φ = 4.1 (6)°, and in 3b puckering
parameters (QT, θ and φ) are 0.4533 Å, 76.37°, 5.12 ° for
molecule A, 0.5377 Å, 98.01°, 185.47° for molecule B,
0.3427 Å, 104.29°, 188.85° for molecule C and 0.3922 Å,
75.42°, 9.84° for molecule D. These values differentiate
the four independent molecules in the asymmetric unit
of crystal structure of compound 3b, Additional file 1:
Table S1. From the X-ray crystallographic studies, a weak
C–H···N intermolecular interaction has been observed
in 3a. As a result of this interaction, a dimer is formed
generating sixteen membered ring motifs R11 (16) (see
Al‑Zahrani et al. Chemistry Central Journal (2016) 10:13
Page 4 of 15
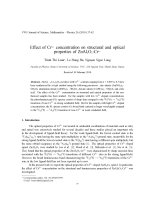
Fig. 2 ORTEP diagram of 3a, and 3b containing four molecules (A, B, C and D) in an asymmetric unit, thermal ellipsoids were drawn at 50 % prob‑
ability level
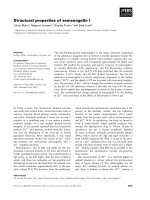
Fig. 3 Optimized geometries of 3a, 3b at B3LYP/6-31G (d, p)
Additional file 1: Fig. S1). Molecules A and B in 3b form
dimers to generate sixteen membered ring motifs R11 (16)
Additional file 1: Fig. S2. The π-π interaction has not
been observed either in 3a or in 3b.
Geometry optimization
In the past decade, methods based on DFT have got
the attention of researchers because of their accuracy and wide applications. The DFT investigations of
both compounds 3a and 3b have been performed not
only to validate X-ray results, but also to compare and
investigate other spectroscopic and structural properties. The structures of both 3a and 3b have been optimized by using B3LYP/6-31G (d, p) level of theory, and
the the optimized geometries are shown in Fig. 3. A
comparison of bond angles and bond lengths for both
compounds are listed in Additional file 1: Tables S2,
S3. Although the packing diagram of 3b shows four
molecules in asymmetric unit, yet only molecule A has
been considered for comparison. The experimental
and simulated bond lengths/bond angles of all atoms
for compounds 3a and 3b (A) are correlated nicely. A
Al‑Zahrani et al. Chemistry Central Journal (2016) 10:13
deviation of 0.001–0.036 Å in bond lengths has been
appeared for both compounds. Maximum deviations
of 5.4° and 4.2° in dihedral angles from C14–C13–C5
bonds in 3a and from C23–C22–C21 bonds in 3b have
been observed.
Vibrational analysis
The experimental vibrational spectra of phenothiazine
derivatives 3a and 3b have been recorded as neat, and
both the experimental as well as simulated spectra are
shown in Fig. 4. The vibrational frequencies of both were
computed at the same level as was used for energy minima structures and assignments were accomplished by
using Gauss-View 05 program. A comparison of experimental and calculated vibrational frequencies is given in
Table 2.
Fig. 4 Experimental and simulated vibrational spectra of 3a and 3b
Page 5 of 15
The simulated vibrations above 1700 cm−1 have been
scaled by using a scaling factor of 0.958 and for less than
1700 cm−1 scaling factor is 0.9627 [37]. In the table only
those simulated vibrations are given whose intensities are
more than ten. For both compounds, the vibrations arise
mainly from aromatic C–H, double bond C=C, C–N,
C–S, nitrile, CH2, and CH3 functional groups. From
Table 2, it is clear that there exists an excellent agreement
between the experimental and theoretical vibrations.
Aromatic (CH), (C=C) and aliphatic (C=C) vibrations
The aromatic (CH) vibrations generally appear in the
region 2800–3100 cm−1 [38]. The bands appeared in this
region are normally of very low intensity, and not much
affected by substituents. In the simulated spectra, the
aromatic CH stretching vibrations of both compounds 3a
and 3b have been predicted at 3086, 3077 cm−1 and 3085,
3077 cm−1 respectively. The calculated aromatic CH
stretching vibrations coincide well with the experimental value appearing at 2916 cm−1 for both compounds.
The symmetric and asymmetric stretching vibrational
regions of aromatic ring (C=C) usually lie in between
1600–1200 cm−1 [39]. The experimental scans of 3a and
3b show aromatic C=C stretching vibrations at 1574,
1402 cm−1 and 1570, 1405 cm−1 respectively. The simulated aromatic stretching C=C peaks are found in strong
correlation and appear at 1603, 1568, 1526, 1395 cm−1 for
compound 3a, and 1594, 1526, 1395 cm−1 for compound
3b. An aliphatic C=C group in conjugation with aromatic
ring is also present in both compounds and appears at
1559 cm−1 experimentally whereas this stretching vibration appears at at 1553 cm−1 for both 3a and 3b.
Aromatic in-plane and out of plane CH bending vibrational regions are usually weak and are observed in the
range 1000–1300 cm−1 and 650–900 cm−1 respectively [40]. In the simulated spectra, in plane CH (aromatic) bending vibrations are observed in the range of
1428–1286 cm−1 for compound 3a, and in the region
of 1352–1139 cm−1 for compound 3b. The corresponding experimental values are depicted at 1218 cm−1 for
compound 3a and 1220 cm−1 for compound 3b. The
prominent out of plane CH (aromatic) bending vibrations of compound 3a are observed at 1163, 927, 810 and
735 cm−1 in the simulated spectrum, and for compound
3b these are observed in the range 927–740 cm−1. These
out of plane bending vibrations are well supported by
the experimental values of both compounds having their
values noticed at 805 and 814 cm−1 respectively. The calculated out of plane bending vibrations of phenyl ring in
compound 3a are in the range 741–429 cm−1, and for 3b
in the range 709–429 cm−1. These simulated values are
very nicely correlated with the experimental values of the
both compounds.
Al‑Zahrani et al. Chemistry Central Journal (2016) 10:13
Page 6 of 15
Table 2 Experimental and simulated vibrational (cm−1) values of 3a and 3b
3a Calc. (intensity)
3a (Exp.)
Assignment
3b Calc. (intensity)
3b (Exp.)
Assignment
υsCHarom.
3086 (11.6)
–
υsCHarom.
3085 (13.1)
2916
3077 (21.9)
2916
υas, υsCHarom.
3077 (21.2)
–
υasCHarom.
3001 (22.6)
–
υasCH2
3005 (21.2)
–
υasCH2
2986 (46.1)
–
υasMe
2982 (42.8)
–
υasMe
2980 (40.6)
–
υasMe
2976 (59.1)
–
υasMe,υsCH2
2965 (16.9)
–
υasCH2
2966 (17.0)
–
υasCH2
2954 (58.4)
2848
υasCH2
2954 (58.6)
2848
υasCH2
2945 (69.5)
–
υasCH2
2936 (24.8)
–
υasCH2
2923 (32.5)
–
υasCH2
2926 (31.5)
–
υsCH2, υasCH2
2911 (35.6)
–
υsMe
2914 (21.4)
–
υsMe
2899 (80.5)
–
υsCH2
2898 (43.2)
–
υsCH2, υasCH2
2893 (62.3)
–
υsCH
2895 (48.8)
–
υsCH2
2245 (119.0)
2215
υsC≡N
2245 (119.1)
2214
υsC≡N
2231 (13.9)
–
υasC≡N
2230 (13.8)
–
υasC≡N
1594 (64.5)
1570
υsC=Carom.
1603 (63.5)
1574
υsC=Carom.
1553 (579.0)
1559
υsC=Caliphatic
1568 (10.9)
–
υsC=Carom.
1526 (18.4)
–
υasC=Carom.
1553 (578.2)
1559
υsC=Caliphatic
1483 (61.2)
1461
1526 (19.5)
–
υasC=Carom.
1483 (61.4)
1472
υsC–N–C
1453 (112.5)
–
ρCH2
1456 (13.2)
–
ρCH2
1448 (189.8)
–
ρCH2
1453 (70.8)
–
ρCH2
1428 (41.4)
–
δCHarom.
1448 (217.5)
1458
υasC=Carom.
1395 (230.2)
1405
υasC=Carom.
1428 (42.2)
–
βCHarom.
1352 (23.2)
–
βCH
1395 (233.7)
1402
υasC=Carom.
1337 (206.7)
1364
υsN–Ph,
1352 (21.6)
–
βCH
1338 (189.1)
1360
υsN–C, γCH2
1311 (24.2)
1323
βCH2, ωCH2
1337 (23.4)
–
βCH2
1303 (34.0)
–
βCH2, ωCH2
1312 (28.6)
–
βCH2
1294 (14.0)
–
υasC=Carom.
1300 (53.9)
–
βCH2
1290 (20.0)
–
ωCH2
1286 (98.9)
–
βCH2
1287 (87.5)
–
ωCH2
1279 (41.5)
–
υsN–Ph
1279 (31.9)
–
υs CH2–N–Ph
1275 (27.8)
–
βCH2
1276 (39.2)
–
βCH2
1238 (97.0)
–
βCHarom.
1238 (104.4)
1220
1232 (90.2)
–
βCHarom.
1208 (138.7)
1218
βCHarom.
1206 (67.4)
–
βCH2
1233 (63.2)
–
υs CH2–N–Ph
1180 (22.7)
–
ωCH2
1212 (38.8)
–
γCH2
1163 (120.0)
–
γCHarom.
1207 (168.5)
–
υsC–C=CH
1198 (27.7)
–
ωCH2
–
υsC–N–C
ρCH2
βCH2
βCH2, υs
CH2–N–Ph
βCHarom.
1133 (22.7)
–
υsC–CN
1163 (121.8)
1127 (23.4)
–
ωCH2
1133 (23.1)
βCHarom.
1119 (13.3)
–
βCHarom.
1128 (24.0)
–
τCH2
1081 (15.0)
–
υsC–S–C
1119 (13.1)
–
βCHarom.
927 (10.9)
–
γCH
1083 (19.3)
–
υsN–CH2
810 (22.3)
805
γCHarom.
927 (10.6)
930
γCH
741 (26.2)
740
γPh
808 (22.6)
814
γCHarom.
735 (27.2)
–
γCHarom.
742 (10.3)
–
γCHarom.
710 (17.5)
–
γPh
740 (15.2)
740
γCHarom.
υasC–CN
Al‑Zahrani et al. Chemistry Central Journal (2016) 10:13
Page 7 of 15
Table 2 continued
3a Calc. (intensity)
3a (Exp.)
Assignment
636 (12.4)
607
γC=C–CN
429 (15.0)
–
γPh
3b Calc. (intensity)
3b (Exp.)
Assignment
734 (39.0)
–
γCHarom.
709 (12.2)
–
γPh
588 (12.4)
–
γC=C–CN
616 (10.0)
608
γPh
γCH2
βPh
429 (15.5)
−1
γPh
−1
Scaling factor used 0.958 for vibrations between 3200 and 1700 cm and 0.9627 used below 1700 cm . Only those simulated values are given, those have shown
intensity above 10
υs symmetric streching, υas asymmetric streching, β ın plane bending, γ out of plane bending, τ twisting, ρ scissoring, ω wagging
CH2 and CH3 group vibrations
The simulated stretching (symmetric/asymmetric) CH2
vibrations appear in the range of 3001–2895 cm−1, and
3005–2893 cm−1 for compounds 3a and 3b respectively.
These simulated values appear in nice agreement with the
experimental values having appeared at 2848 cm−1 for
compound 3a, and 2847 cm−1 for compound 3b. Along
with the stretching vibrations, several scissoring, in-plane
and out of plane bending, methylene (CH2) and methyl
vibrations are observed in the simulated and experimental spectra and a nice agreement is found between them.
Both compounds 3a and 3b show the CH2 scissoring vibrations in the range 1456–1448 cm−1 and 1453–
1448 cm−1 respectively and these are correlated well with
the experimental 1458 and 1462 cm−1 values respectively. The in-plane bending CH2 vibrations are observed
in the range 1337–1275 cm−1 and 1337–1287 cm−1 for
3a and 3b respectively. These bending vibrations are in
agreement with the experimental counterparts having
appeared at 1317 cm−1, 1218 and 1323, 1228 cm−1 for 3a
and 3b respectively.
Nitrile and C–N Group vibrations
The nitrile symmetric stretching vibrations of very high
intensity appear at 2245 cm−1 in the simulated spectra for
3a and 3b. The nitrile asymmetric stretching vibrations
of low intensity also appear at 2230 and 2231 cm−1 for
both compounds. In the experimental scans, the nitrile
vibrations appear at 2214 and 2215 cm−1 for 3a and 3b
respectively, and are found in excellent correlation with
the simulated values. The simulated C–N–C stretching
frequency appear at 1483 cm−1 for both 3a and 3b and
is in full agreement with its experimental counterpart
observed at 1472 and 1474 cm−1 respectively.
The assignments of N-Ph stretching modes are difficult, as there are problems to discriminate them from
other aromatic ring vibrations. For substituted aromatic
rings, Silverstein et al. [41] defined the N-Ph stretching
bands in the range 1200–1400 cm−1. In the present study
of compound 3a, the observed N-Ph symmetric stretching bands appear at 1338 and 1279 cm−1 in the simulated spectrum and are in very good agreement with the
experimental 1363 cm−1 value. Similarly, the calculated
N-Ph stretching frequencies of 3b appearing at 1337 and
1279 cm−1 also show good agreement with the experimental band at 1363 cm−1.
Nuclear magnetic resonance (NMR) studies
For the last two to three decades, nuclear magnetic resonance spectroscopy has been unavoidable tool for structural investigations of organic and biological molecules.
The 1H and 13C chemical shifts contain very important information about the structural environment of
unknown compounds. Nowadays, a powerful method
to predict and compare the structure of molecules is to
combine the theoretical and experimental NMR methods. The DFT simulations using Gaussian software are
playing very active role in this regard. A full and true
geometry optimization of both compounds 3a and 3b
has been performed by using B3LYP/6-311 + G (2d, p)
basis set. An accurate optimization of molecular geometries is vital for reliable calculations of magnetic properties and their comparison with experimental results.
The chemical shift calculations of both compounds have
been performed by using the fully optimized geometries,
adopting the GIAO method at the same level of theory
and referred by using the internal reference standard i.e.
trimethylsilane. Both the experimental as well as simulated NMR spectra have been recorded in CDCl3 (for
experimental 1H and 13C NMR see Additional file 1: Figs.
S3–S6). The detailed simulated and experimental 1HNMR values are given in Table 3.
Both phenothiazine derivatives (3a and 3b) mainly
have aromatic and aliphatic protons. In the experimental
1
H-NMR spectra, aromatic and double bonded protons
appear in the range 7.74–6.83 ppm (compound 3a) and
Al‑Zahrani et al. Chemistry Central Journal (2016) 10:13
Page 8 of 15
Table 3 Comparison of experimental and simulated 1HNMR of 3a and 3b (ppm) in CDCl3
Proton (3a)
Exp.
Calc.
(B3LYP)
Proton (3b)
Exp.
Calc.
(B3LYP)
H14 (aromatic)
6.84
8.88
H14 (aromatic)
6.84
8.93
H21 (aliphatic)
7.47
7.68
H21 (aliphatic)
7.47
7.75
H17 (aromatic)
7.17
7.47
H17 (aromatic)
7.17
7.54
H19 (aromatic)
7.08
7.39
H16 (aromatic)
7.47
7.53
H18 (aromatic)
6.98
7.29
H19 (aromatic)
7.08
7.34
H16 (aromatic)
7.53
7.38
H18 (aromatic)
6.98
7.29
H15 (aromatic)
6.88
7.22
H15 (aromatic)
6.88
7.18
H10 (aromatic)
7.74
7.18
H10 (aromatic)
7.74
7.16
H26 (CH2)
3.87
4.24
H26 (CH2)
3.87
4.22
H27 (CH2)
3.87
3.77
H27 (CH2)
3.87
3.85
H29 (CH2)
1.81
2.04
H29 (CH2)
1.81
1.88
H32 (CH2)
1.81
1.87
H32 (CH2)
1.44
1.87
H35 (CH2)
1.44
1.94
H35 (CH2)
1.3
1.97
H39 (CH2)
1.32
1.67
H30 (CH2)
1.81
1.68
H30 (CH2)
1.81
1.61
H39 (CH2)
1.3
1.59
H38 (CH2)
1.32
1.23
H41 (CH2)
1.3
1.48
H36 (CH2)
1.44
1.11
H48 (CH2)
1.3
1.3
H41 (CH3)
0.88
1.09
H36 (CH2)
1.3
1.23
H42 (CH3)
0.88
1.01
H49 (CH2)
1.3
1.23
H33 (CH2)
1.81
1.07
H38 (CH2)
1.3
1.21
H43 (CH3)
0.88
0.55
H51 (CH3)
0.87
1.1
H33 (CH2)
1.44
1.09
H42 (CH2)
1.3
0.92
H52 (CH3)
0.87
0.83
H53 (CH3)
0.87
0.81
7.75–6.83 ppm (compound 3b). The computed aromatic
C–H signals (with respect to TMS) appear in the range
8.88–7.18 ppm (3a)/8.93–7.16 ppm (3b), and are found
in nice agreement with the experimental values. The calculated chemical shift values for methylene and methyl
hydrogen atoms of both 3a and 3b are found in the range
4.24–0.55/4.22–0.81 respectively, and are proved in good
agreement with the experimental counterparts which
appear in the range of 3.87–0.88 (3a)/3.87–0.87 (3b).
Frontier molecular orbital analysis and UV–vis absorption
studies
Frontier molecular orbital analysis has proved very
helpful in understanding the electronic transitions
within molecules and analyzing the electronic properties, UV–vis absorptions and chemical reactivity as well
[42]. The FMO analysis also plays an important role in
determining electronic properties such as ionization
potential (I. P.) and electron affinity (E. A.). The HOMO
(highest occupied molecular orbital) represents the ability to donate electrons and its energy corresponds to
ionization potential (I. P.), whereas the LUMO (lowest
unoccupied molecular orbital) acts as electron acceptor and its energy corresponds to electron affinity (E. A.)
[43]. Frontier molecular orbital (FMO) analysis is carried out at the same level of theory as used for the geometry optimization, applying pop = full as an additional
keyword. The HOMO and LUMO surfaces along with
the corresponding energies and energy gaps are shown
in Additional file 1: Fig. S6. Compound 3a contains 93
filled orbitals, whereas 3b contains 103 filled orbitals.
The HOMO–LUMO energy difference in both 3a and
3b has been found to be 2.96 eV. The kinetic stabilities
of compounds can be assigned on the basis of HOMO–
LUMO energy gap [44]. A low HOMO–LUMO energy
gap means less kinetic stability and high chemical reactivity. It is clear that the HOMO–LUMO energy gaps in
compounds 3a and 3b are very less, indicating that electrons can easily be shifted from HOMO to LUMO after
absorbing energy.
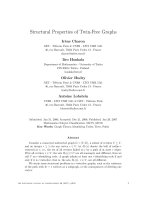
The experimental UV–vis absorption spectra of both
compounds 3a and 3b in various solvents like dichloromethane, chloroform, methanol and dimethyl sulphoxide (DMSO) have been recorded within 250–700 nm
range, and the combined spectra are shown in (Fig. 5).
The theoretical absorption studies are also carried out
by using TD-DFT method at B3LYP/6-31G (d, p) level
of theory in gas phase, and polarizable continuum model
(PCM) is applied to account for solvent effect (For simulated UV–vis spectra see Additional file 1: Fig. S7). A
comparison of characteristic experimental and simulated
UV–vis. absorption wavelengths (λmax) of the both compounds in gas phase and different solvents (DCM, chloroform, methanol and DMSO) has been given in Table 4.
As both the compounds have same chromophores; thus
there is no significant difference in their absorption
maxima.
Different solvents covering a wide range of polarity and
dielectric constant have been selected in order to explore
the solvent effect on the absorption maxima, but no significant difference has been observed. The experimental
UV–vis. spectra of both compounds show mainly two
absorption bands. In dichloromethane, λmax1 and λmax2
values for compound 3a appear at 320 and 474 nm corresponding to the π–π* and n–π* transitions respectively
[45], and for 3b the values appear at 321 nm and 474 nm.
In chloroform the absorption maxima of 3a are found
at 321 nm (λmax1), 478 nm (λmax2) and for 3b they have
been appeared at 321 nm (λmax1), 478 (λmax2). Similarly,
the absorption maxima values appear at 317 nm (λmax1),
478 nm for compound 3a, and 317 nm (λmax1), 463 nm
(λmax2), for compound 3b in methanol (polar protic) and
DMSO (polar aprotic) respectively. The gas phase simulated spectrum of compound 3a show absorption maxima
Al‑Zahrani et al. Chemistry Central Journal (2016) 10:13
Page 9 of 15
λmax2 at 475.7 nm (f = 0.21). The details of the simulated
absorption values along with the oscillating strengths of
both compounds in gas, dichloromethane (DCM), chloroform, methanol and DMSO are given in Table 4.
3.0
2.5
DCM
Chloroform
Methanol
DMSO
Absorbance
2.0
1.5
Molecular electrostatic potential (MEP)
Molecular electrostatic potential (MEP) is associated
with the electronic cloud. The electrophilic/nucleophilic
reacting sites as well as hydrogen bonding interactions
can be described in any compound on the basis of MEP
[46, 47]. Recognition process of one molecule by another,
as in drug-receptor and enzyme substrate interactions, is
related to electrostatic potential V(r), because the two species show interaction to each other through their potentials. The MEP analysis can be performed by using the
following mathematical relation, described previously [48].
1.0
0.5
0.0
-0.5
300
400
500
600
700
Wavelength (nm)
2.0
Absorbance
1.5
V (r) =
DCM
Chloroform
Methanol
DMSO
1.0
0.5
0.0
-0.5
300
400
500
600
700
Wavelength (nm)
Fig. 5 Combined experimental UV–vis. Spectra of 3a (above), 3b
(below) in different solvents
λmax1 and λmax2 at 300.4 nm (oscillating strength, f = 0.37)
and 476.4 nm (f = 0.21) respectively. On the other hand,
compound 3b shows λmax1 at 300.4 nm (f = 0.36) and
ZA
−
|RA − r|
ρ(r′)
dr′
|r′ − r|
Here summation (Σ) runs over all nuclei A in a molecule,
polarization and reorganization effects are ignored. ZA is
charge of nucleus A, located at RA and ρ (r′) is the electron density function of a molecule. Usually, the preferred
nucleophilic site is represented by red color and the preferred electrophilic site is represented by blue color. The
electrostatic potential values at the surface are represented
by different colors. The potential decreases in the order:
red < orange < yellow < green < blue. The color code of
the map is in the range between 0.0550 a.u. (deepest red)
and 0.0550 a.u. (deepest blue), where blue corresponds to
the strongest attraction and red corresponds to the strongest repulsion. Regions of negative V (r) are associated with
lone pairs of electronegative atoms.
According to the MEP analysis of compounds 3a and
3b, there are two negative regions at each molecule (red
Table 4 Experimental and simulated UV–vis. λmax (nm) values of 3a and 3b measured in DCM, chloroform, methanol
and DMSO
Experimental
Theoretical [TD-SCF/B3LYP/6-31G (d, p)]
(3a)
λmax1 (abs.)
λmax2 (abs.)
(3b)
λmax1 (osc. strength)
λmax2 (osc. strength)
–
–
–
Gas Phase
300.4 (0.37)
476.4 (0.21)
DCM
320 (2.50)
474 (2.13)
DCM
310.4 (0.30)
502.9 (0.32)
Chloroform
321 (2.66)
478 (2.24
Chloroform
309 (0.29)
500.5 (0.32)
Methanol
317 (2.17)
478 (2.24)
Methanol
310.4 (0.35)
503.5 (0.30)
DMSO
319 (0.86)
472 (0.73)
DMSO
311.1 (0.28)
505.4 (0.32)
(3b)
(3b)
–
–
–
Gas Phase
300.4 (0.36)
475.7 (0.21)
DCM
321 (1.30)
474 (1.11)
DCM
310.3 (0.28)
501.9 (0.32)
Chloroform
321 (1.90)
478 (1.61)
Chloroform
309.6 (0.28)
499.5 (0.32)
Methanol
317 (1.06)
463 (0.87)
Methanol
310.3 (0.34)
502.5 (0.31)
DMSO
320 (0.66)
473 (0.56)
DMSO
311.1 (0.26)
504.4 (0.32)
Al‑Zahrani et al. Chemistry Central Journal (2016) 10:13
coded region) shown in Fig. 6. These red coded regions
are nitrile functional groups of the both compounds.
As these two compounds differ only at the alkyl chain
lengths located at the nitrogen in a heterocyclic ring,
therefore the reactive sites are same. Apart from the
nitrile groups the rest is lying between yellow and green
regions. This shows that no strong electrophilic sites exist
in both the compounds.
Natural bond orbital (NBO) analysis
Natural bond orbital analysis is an efficient method for
studying intra- and intermolecular bonding and interaction among bonds, and provides a convenient basis
to probe charge transfer or conjugative interaction [49].
The NBO approach describes the bonding anti-bonding
interaction quantitatively and is expressed by means of
second-order perturbation interaction energy E(2) [50–
53]. This energy estimates the off-diagonal NBO Fock
matrix element. The stabilization energy E(2) associated
with i (donor) to j (acceptor) delocalization is approximated from the second-order perturbation approach as
given below:
E (2) = qi
F 2 i, j
εj − εi
where qi is the donor orbital occupancy, εi and εj are the
diagonal elements (orbital energies) and F (i, j) is the offdiagonal Fock matrix element. The larger the E(2) value is,
the greater is the interaction between electron donors and
electron acceptors and the extent of conjugation of whole
system. The various second-order interactions between the
occupied Lewis type (bond or line pair) NBO orbitals and
unoccupied (anti-bonding and Rydberg) non-Lewis NBO
orbitals are investigated by applying DFT at the B3LYP/631G (d, p) level. As a result of our study, the compounds
3a and 3b are types of Lewis structures with 97.93 and
98.03 % character, valance-non Lewis character of 1.90 and
1.79 % respectively. Both the compounds share the same
Rydberg non-Lewis character of 0.16 %.
Fig. 6 MEP plot of compounds 3a and 3b
Page 10 of 15
The intramolecular hyperconjugative interactions
result in the transfer of charge from donor (π) to acceptor
(π*) orbitals. This charge transfer increases the electron
density (occupancy) in antibonding orbitals and weakens
the respective bonds [54]. From the significant entries in
Table 5, it is clear that the occupancy of π bonds (C–C)
for benzene rings of the title compounds (3a and 3b) lie
in the range of ~1.59–1.71. On the other hand, the occupancy of π* bonds (C–C) for benzene rings range from
~0.33–0.42. This delocalization leads to the stabilized
energy in the range of ~17.15–25.19 kcal/mol.
The pi-bond of ethylenic moiety (C13–C14) also shows
an average of ~20 kcal/mol stabilization energy when it is
delocalized to either acetonitrile group. The strongest stabilization energy to the system by 31.28 kcal/mol is due
to the lone pair donation of nitrogen atom N (1) to the
antibonding π* (C2–C3) orbital. On the other hand, the
same lone pair gives a stabilization energy of 24.09 kcal/
mol when it is conjugated with the antibonding π* (C11–
C12) orbital of the aromatic ring. This clearly shows that
the delocalization of lone pair of nitrogen N (1) is more
towards that aromatic ring which has extended conjugation due to presence of electron withdrawing acetonitrile
groups. The lone pair donation from sulfur atom (S1) to
the antibonding π* (C1–C6) and (C7–C8) orbitals of both
phenyl rings results in the stabilization energies of 12.09
and 11.23 kcal/mol respectively. The occupancy of lone
pair electrons in sulfur atom (S1) is 1.84 as compared
to 1.69 of lone pair on nitrogen atom (N1). As a consequence, the stabilization energies arising from the lone
pair donation of sulfur atom to the antibonding π* (C–C)
bonds of phenyl rings are comparatively smaller than
those arising from lone pair donation of N1 atom. A plausible reason could be due to the deviation of sulfur atom
from planarity because of its larger size. All σ to σ* transitions involving C–C bonds correspond to the weak stabilization energies in the range of ~2.53–4.58 kcal/mol.
Hyperpolarizability and non‑linear optical properties
Recently, compounds having non-linear optical (NLO)
properties have got appreciable attention of researchers because of their wide applications in optoelectronic
devices of telecommunications, information storage,
optical switching and signal processing [55]. Molecules
containing donor acceptor groups along with pi-electron
conjugated system are considered as strong candidates
for possessing NLO properties [56].
In each 3a and 3b, the phenothiazine moiety is connected to a nitrile group through a conjugated double
bond, and these molecules are anticipated to show nonlinear optical (NLO) properties. For the estimation of
NLO properties, the first hyperpolarizability (βo) analysis for compounds 3a and 3b has been performed by
Al‑Zahrani et al. Chemistry Central Journal (2016) 10:13
Page 11 of 15
Table 5 Significant donor–acceptor interactions of 3a/3b and their second order perturbation energies calculated
at B3LYP level using 6-31G (d, p) basis set
Donor (i) (occupancy)
Type
EDA, % EDB, %
Acceptor (j) (occupancy)
Type
EDA, % EDB, %
E(2)a (kcal/mol)
Ej–Ebi
(a.u.)
F (i, j) (a.u.)
BD C3–C4 1.97721
σ
49.64 50.36
BD* C2–C3 0.02660
σ*51.36 48.64
3.16
1.25
0.056
BD C4–C5 1.97419
σ
48.62 51.38
BD* C3–C4 0.01233
σ*50.36 49.64
2.53
1.29
0.051
BD C4–C5 1.59136
π
44.97 55.03
BD* C13–C14 0.24073
π*59.29 40.71
22.02
0.27
0.071
BD C2–C3 1.97034
σ
48.64 51.36
BD* C3–C4 0.01233
σ*50.36 49.64
2.69
1.30
0.053
BD C2–C3 1.60070
π
53.51 46.49
BD* C4–C5 0.42336
π*55.03 44.97
25.19
0.28
0.076
BD C1–C2 1.97300
σ
50.22 49.78
BD* C2–C3 0.02660
σ*51.36 48.64
3.44
1.26
0.059
BD C1–C6 1.97721
σ
50.97 49.03
BD* C5–C6 0.02189
σ*50.82 49.18
2.95
1.27
0.055
BD C1–C6 1.71641
π
54.39 45.61
BD* C2–C3 0.40194
π*46.49 53.51
19.81
0.29
0.069
BD C5–C6 1.97016
σ
49.18 50.82
BD* C4–C5 0.02494
σ*51.38 48.62
3.18
1.24
0.056
BD C7–C12 1.97320
σ
49.77 50.23
BD* C11–C12 0.02533
σ*48.64 51.36
3.93
1.28
0.063
BD C7–C8 1.97672
σ
51.41 48.59
BD* C7–C12 0.03387
σ*50.23 49.77
4.58
1.26
0.068
BD C7–C8 1.69501
π
53.56 46.44
BD* C11–C12 0.38891
π*51.02 48.98
20.16
0.28
0.069
BD C11–C12 1.66680
π
48.98 51.02
BD* C9–C10 0.33937
π*50.66 49.34
20.47
0.29
0.069
BD C9–C10 1.66550
π
49.34 50.66
BD* C7–C8 0.38725
π*46.44 53.56
22.74
0.27
0.071
BD C13–C14 1.81237
π
40.71 59.29
BD* C15–N2 0.08582
π*54.47 45.53
19.91
0.39
0.081
BD C13–C14 1.81237
π
40.71 59.29
BD* C16–N3 0.08857
π*54.71 45.29
20.52
0.40
0.083
LP N1 1.69519
BD* C2–C3 0.40194
π*46.49 53.51
31.28
0.27
0.084
LP N1 1.69519
BD* C11–C12 0.38891
π*51.02 48.98
24.09
0.28
0.075
LP S1 1.84528
BD* C1–C6 0.34392
π*45.61 54.39
12.09
0.27
0.053
LP S1 1.84528
BD* C7–C8 0.38725
π*46.44 53.56
11.23
0.27
0.053
a
E(2) means energy of hyperconjucative interactions (stabilization energy)
b
Energy difference between donor (i) and acceptor (j) NBO orbitals
employing same level of theory as for geometry optimization i.e. 6-31G (d, p) along with POLAR as an additional
keyword. The first hyperpolarizability, a third rank tensor,
is always described by a 3 × 3 × 3 matrix. The total 27
components of the 3D matrix can be reduced to 10 components as a result of Kleinman symmetry [57]. From
the Gaussian output file ten components of 3D matrix
have been identified as βxxx, βxxy, βxyy, βyyy, βxxz, βxyz, βyyz,
βxzz, βyzz and βzzz respectively, and the values are given in
Table 6.
Among all types of hyperpolarizabilities reported in
literature, the more attractive is βtot. (First hyperpolarizability) [49] and it can be measured by using the following mathematical relation;
β=
respectively. These values are in excellent agreement with
the reported values in literature [58, 59], and this agreement proves that both compounds are strong candidates
for NLO applications.
Method
All analytical grade chemicals and solvents were purchased from BDH, and used without further purification.
Stuart Scientific (SMP3, version 5.0, UK) melting point
apparatus was used to record the melting point, and the
reported m. p. were uncorrected. 1H-NMR spectra were
recorded on a Bruker-AVANCE-III 600 MHz at 300 K,
and chemical shifts were reported in ppm with reference to the residual solvent signal. FT-IR spectra were
(βxxx + βxyy + βxzz )2 + (βyyy + βxxy + βyzz )2 + (βzzz + βxxz + βyyz )2
First hyperpolarizability values have been converted into
electrostatic units (1 a.u. = 8.6393 × 10⁻³³esu). The calculated first hyperpolarizability (βtot.) values for 3a and
3b have been found to be 62.03 and 61.70 × 10⁻³⁰esu
recorded under neat conditions on Thermo Scientific
NICOLET iS 50 FT-IR spectrometer (Thermo Scientific).
UV–visible studies were performed by using Evolution
300UV/VIS spectrophotometer (Thermo Scientific).
Al‑Zahrani et al. Chemistry Central Journal (2016) 10:13
Page 12 of 15
Table 6 First hyperpolarizability parameters of 3a and 3b
Compound
3a
βxxx
−7021.88
βxxy
βxyy
βyyy
βxxz
βxyz
βyyz
βxzz
βyzz
βzzz
β × 10−30 (esu)
3b
1661.22
−130.15
−267.26
−103.44
47.6438
−95.5
105.388
−32.915
−6.2876
62.0307
1329.03
−2040.8
3129.93
−3673.5
−37.627
−20.756
−85.957
−60.469
88.324
−8.308
61.7064
to confirm the optimized geometries as a true minimum (no imaginary frequency). In addition, frequency
simulations at B3LYP/6-311G (d, p) level were used for
vibrational analysis. Nuclear magnetic resonance studies were performed at B3LYP/6-311 + G (2d, p) level,
by adopting GIAO method in chloroform solvent and
applying polarizable continuum model (PCM) for
the solvent consideration. Chemical shift values were
referred by using the internal reference standard i.e.,
tetramethylsilane. UV–vis absorption studies were simulated by using TD-DFT method and at B3LYP/6-31G
(d, p) level of theory. MEP, NBO, FMO and first hyperpolarizability analyses were simulated at B3LYP/6-31G
(d, p) level of DFT.
Experimental
Crystallography
Sample crystals were mounted on Agilent Super Nova
(Dual source) Agilent Technologies Diffractometer,
equipped with graphite-monochromatic Cu/Mo Kα
radiation source. The data collection was accomplished by using CrysAlisPro software [60] at 296 K.
Structure solution was performed using SHELXS–97
and refined by full–matrix least–squares methods on
F2 using SHELXL–97 [61], in-built with X-Seed [62].
All non–hydrogen atoms were refined anisotropically by full–matrix least squares methods [61]. All
the C–H hydrogen atoms were positioned geometrically and treated as riding atoms with C–H = 0.93 Å
and Uiso (H) = 1.2 Ueq (C) for aromatic carbon atoms.
The methyl and methylene hydrogen atoms were also
positioned geometrical with Cmethyl–H = 0.96 Å and
Cmethylene–H = 0.97 Å and Uiso (H) = 1.5 Ueq (C) and
Uiso (H) = 1.2 Ueq (C) for methyl and methylene carbon atoms respectively. The figures were drawn using
ORTEP III [63], PLATON [64] and OLEX2 [65] programs. The cifs of both molecules have been assigned
CCDC numbers 1028273 & 1028274 and these data files
can be obtained free of charge on application to CCDC
12 Union Road, Cambridge CB21 EZ, UK. (Fax: (+44)
1223 336-033; e-mail: ac.uk).
Computational details
Theoretical studies were performed by using Gaussian
09 software at density functional theory (DFT) level,
as instituted in program [66]. The visualization of the
results/optimized geometries was achieved by using
Gauss view 05 [67]. The energy minima optimization of
both compounds was carried out at B3LYP/6-31G (d, p)
and B3LYP/6-311 + G (2d, p) levels of theory (the later
was used further for nuclear magnetic studies). Frequency simulations were performed at the same level,
The synthesis of both phenothiazine derivatives was carried out in three steps starting from simple phenothiazine. First step was alkylation of nitrogen, followed by
subsequent aldehyde formation and then conversion to
final product (Fig. 1).
General procedure for the synthesis of N‑alkylated
phenothiazine (1a, 1b)
In a round bottom flask a mixture of potassium hydroxide
(2.003 g, 0.0357 mol), 10-phenothiazine (2.91 g, 0.0119 mol),
1-bromohexane (for 1a) or 1-bromooctane (0.0179 mol)
(for 1b) and potassium iodide (in catalytic amount) in 50 ml
dimethyl sulfoxide (DMSO) were taken. The reaction mixture was stirred for 5 h at room temperature and water
(200 ml) was added. The crude product was extracted with
CHCl3 (3 × 50 ml) and the organic layer was washed with
saturated ammonium chloride solution and then with water.
The organic layer was dried over anhydrous sodium sulfate and filtered, after removing the solvent under reduced
pressure, crude product was purified by flash column chromatography (eluent: n-hexane) to obtain colorless oil 1a in
88.68 % yield, and 1b in 86.15 % yield.
General procedure for synthesis of 10‑alkyl‑10H
phenothiazine‑3‑carbaldehyde (2a, 2b)
To an ice cooled flask containing N, N-dimethylformamide (86 ml), POCl3 (53.5 ml) was added drop wise
under stirring. After complete addition, the solution was
stirred at room temperature for 90 min. Then the reaction mixture was cooled in an ice bath and already synthesized compound (1a or 1b) (65 mmol) was added. The
reaction mixture was warmed gradually up to 75 °C for
2 h. Then the mixture was cooled to room temperature
and poured into ice water, basified (sat. aqueous K2CO3
solution) and extracted with CHCl3 (4 × 30 ml). Organic
layer was washed, dried over MgSO4, filtered, evaporated
and purified by flash silica gel column chromatography
Al‑Zahrani et al. Chemistry Central Journal (2016) 10:13
using petroleum ether/ethyl acetate (80/20) as eluent system to obtain yellow solids, 2a in 92 % yield and 2b in
91 % yield.
Synthesis of 2‑((10‑hexyl‑10H‑phenothiazin‑3‑yl)
methylene)malononitrile (3a)
and 2‑((10‑octyl‑10H‑phenothiazin‑3‑yl)methylene)
malononitrile (3b)
A mixture of (2a or 2b) (3 mmol) and malononitrile
(3 mmol) in basic ethanolic solution (10 ml) was stirred
at room temperature overnight. The precipitates formed
were filtered off and purified by recrystallization from
methanol affording final products, 3a in 78 % yield, and
3b in 73 % yield.
2‑((10‑hexyl‑10H‑phenothiazin‑3‑yl)methylene)
malononitrile (3a)
M. p. 84–85 °C IR (neat, cm−1): υmax = 2916, 2848,
2214, 1559, 1472, 1458, 1402, 1360, 1218, 805, 740,
607; 1H-NMR (CDCl3, ppm): 7.74, (1H, dd, Ar–H,
J = 1.8 Hz, 1.2 Hz), 7.53 (1H, d, Ar–H, J = 2.4 Hz), 7.47
(1H, s, Ar–H), 7.17 (1H, m, Ar–H), 7.08 (1H, dd, Ar–H,
J = 1.8 Hz, 1.2 Hz), 6.98 (1H, m, Ar–H), 6.88 (1H, d,
Ar–H, J = 8.4 Hz), 6.84 (2H, d, Ar–H, J = 9 Hz), 3.87 (2H,
t, CH2, J = 7.2 Hz, 9.8 Hz), 1.44 (2H, pent, CH2), 1.32
(2H, pent, CH2), 1.81 (4H, pent, CH2), 0.88 (2H, t, CH3,
J = 0.6 Hz, 1.2 Hz), 13C-NMR (CDCl3, ppm): 157.3, 150.8,
142.4, 131.4, 129.5, 127.8, 127.6, 125.1, 124.9, 122.9,
116.0, 114.8, 114.7, 113.6, 48.2, 31.3, 26.6, 26.4, 22.5, 14.0,
UV–vis (DMSO): λmax = 319.5 nm, 470.5 nm.
2‑((10‑octyl‑10H‑phenothiazin‑3‑yl)methylene)
malononitrile (3b)
M. p. 90–92 °C IR (neat, cm−1): υmax = 2916, 2848,
2215, 1570, 1559, 1461, 1405, 1364, 1220, 930, 814,
740, 608; 1H-NMR (CDCl3, ppm): 7.74 (1H, dd, Ar–H,
J = 2.4 Hz, 1.8 Hz), 7.54 (1H, d, Ar–H, J = 2.4 Hz), 7.47
(1H, s, Ar–H), 7.17 (1H, m, Ar–H), 7.08 (1H, dd, Ar–H,
J = 1.2 Hz, 1.2 Hz), 6.98 (1H, m, Ar–H), 6.88 (1H, d,
Ar–H, J = 9 Hz), 6.84 (2H, d, Ar–H, J = 9 Hz), 3.88 (2H,
t, CH2, J = 2.4 Hz, 1.8 Hz), 1.81 (2H, pent, CH2), 1.44
(2H, pent, CH2), 1.30 (8H, m, CH2), 0.87 (2H, t, CH3,
J = 6.6 Hz, 7.2 Hz), 13C-NMR (CDCl3, ppm): 157.3, 150.8,
142.4, 131.4, 129.5, 127.8, 127.6, 125.1, 124. 9, 124.1,
122.9, 116.0, 114.9, 114.71, 113.5, 48.2, 31.7, 29.1, 29.1,
26.7, 26.6, 22.6, 14.1, UV–vis. (DMSO); λmax = 320 nm,
471 nm.
Conclusions
In this study, two novel phenothiazine derivatives
2-((10-hexyl-10H-phenothiazin-3-yl)methylene)malononitrile (3a) and 2-((10-octyl-10H-phenothiazin-3-yl)
Page 13 of 15
methylene)malononitrile (3b) have been synthesized
and characterized by using FT-IR, UV–vis, 1H, 13CNMR spectroscopic techniques and finally their structures are confirmed by single crystal X-ray diffraction
studies. The DFT studies have shown a strong agreement between the simulated and experimental results.
The optimized geometries of the both compounds at
6-31G (d, p) level have been used further for investigating structural properties. Frontier molecular orbital
analysis shows that both the molecules have very low
HOMO–LUMO energy gap, and therefore are kinetically less stable. The molecular electrostatic potential investigations reveal that electronegative region in
both the compounds is spread over the nitrile groups.
The high first hyperpolarizability values signify that
these compounds can have very good nonlinear optical responses. The phenothiazine derivatives have very
wide applications not only in dye sensitized solar cells
but also in clinical field, and hopefully the results of this
study will increase the interest of researchers working in
this field.
Additional file
Additional file 1. Cartesian co-ordinates of optimized geometries and
cif files of 3a and 3b are given in supporting information. Experimental
1 13
H, C-NMR are also pasted in supporting information along with HOMO–
LUMO surfaces, simulated UV–vis. Spectra and Tables containing bond
length and bond angles data.
Authors’ contributions
FAA, AMA and RME synthesized the compounds. AMA and MNA did the
crystallographic studies. TM and MAG performed the theoretical calculations.
All authors have contribution in write-up. All authors read and approved the
final manuscript.
Author details
1
Chemistry Department, Faculty of Science, King Abdulaziz University, P.O.
Box 80203, Jeddah 21589, Saudi Arabia. 2 Centre of Excellence for Advanced
Materials Research (CEAMR), King Abdulaziz University, P.O. Box 80203, Jed‑
dah 21589, Saudi Arabia. 3 Department of Chemistry, COMSATS Institute
of Information Technology, University Road, Tobe Camp, Abbottabad 22060,
Pakistan. 4 Department of Chemistry, College of Science and Humanities,
Prince Sattam bin Abdulaziz University, P.O. Box 83, Alkharj 11942, Saudi Arabia.
5
Department of Chemical Engineering, COMSATS Institute of Information
Technology, Defence Road, Off Raiwind Road, Lahore, Pakistan.
Acknowledgements
This Project was funded by the King Abdulaziz City for Science and Technol‑
ogy (KACST) through National Science, Technology and Innovation Plan
(NSTIP) under grant number 8-ENE198-3. The authors, therefore, acknowledge
with thanks KACST for support for Scientific Research. Also, the authors are
thankful to the Deanship of Scientific Research (DSR), King Abdulaziz Univer‑
sity for their technical support.
Competing interests
The authors declare that they have no competing interests.
Received: 31 October 2015 Accepted: 29 February 2016
Al‑Zahrani et al. Chemistry Central Journal (2016) 10:13
References
1. O’Regan B, Gratzel M (1991) A low-cost, high-efficiency solar cell based
on dye-sensitized colloidal TiO2 films. Nature 353:737–739
2. Henderson BW, Dougherty T (1992) How does photodynamic therapy
work? J Photochem Photobiol 55:145–157
3. Li X, Cui S, Wang DZ, Hou Y, Zhou H, Hu Y, Liu JG, Long Y, Wu W, Hua J,
Tian H (2014) New organic donor–acceptor–π–acceptor sensitizers for
efficient dye-sensitized solar cells and photocatalytic hydrogen evolution
under visible-light irradiation. Chem Sus Chem 7:2879–2888
4. Nazeeruddin MK, Zakeeruddin SM, Baker RH, Jirousek M, Liska P, Vla-cho‑
poulos N, Ahklover V, Fischer CH, Graetzel M (1999) Highly conjugated
electron rich thiophene antennas on phenothiazineand phenoxazinebased sensitizers for dye sensitized solar cells. Inorg Chem 38:6298–6305
5. Nazeeruddin MK, Angelis FD, Fantacci S, Selloni A, Viscardi G, Liska P, Ito
S, Takeru B, Graetzel M (2005) Combined experimental and DFT-TDDFT
computational study of photoelectrochemical cell ruthenium sensitizers.
J Am Chem Soc 127:16835–16847
6. Gao F, Wang Y, Shi D, Zhang J, Wang M, Jing X, Baker RH, Wang P,
Zakeeruddin SM, Graetzel M (2008) Enhance the optical absorptivity of
nanocrystalline TiO2 film with high molar extinction coefficient ruthe‑
nium sensitizers for high performance dye-sensitized solar cells. J Am
Chem Soc 130:10720–10728
7. Tseng C-Y, Taufany F, Nachimuthu S, Jiang J-C, Liaw D-J (2014) Design
strategies of metal free-organic sensitizers for dye sensitized solar cells:
role of donor and acceptor monomers. Org Electr 15:1205–1214
8. Chen YS, Li C, Zeng ZH, Wang WB, Wang XS, Zhang BW (2005) Efficient
electron injection due to a special adsorbing group’s combination of car‑
boxyl and hydroxyl: dye-sensitized solar cells based on new hemicyanine
dyes. J Mater Chem 15:1654–1661
9. Wang ZS, Cui Y, Dan-Oh Y, Kasada C, Shinpo A, Hara K (2008) Molecular
design of coumarin dyes for stable and efficient organic dye-sensitized
solar cells. J Phys Chem C 112:17011–17017
10. Koumura N, Wang ZS, Mori S, Miyashita M, Suzuki E, Hara K (2006) Alkylfunctionalized organic dyes for efficient molecular photovoltaics. J Am
Chem Soc 128:14256–14257
11. Kim JY, Kim YH, Kim YS (2011) Indoline dyes with various acceptors for
dye-sensitized solar cells. Curr Appl Phys 11:S117–S121
12. Edvinsson T, Li C, Pschirer N, Scheoneboom J, Eickemeyer F, Sens R,
Boschloo G, Herrmann A, Müllen K, Hagfeldt A (2007) Intramolecular
charge-transfer tuning of perylenes: spectroscopic features and perfor‑
mance in dye-sensitized solar cells. J Phys Chem C 111:15137–15140
13. Tian H, Yang X, Chen R, Pan Y, Li L, Hagfeldt A, Sun L (2007) Phenothiazine
derivatives for efficient organic dye-sensitized solar cells. Chem Commun
36:3741–3743
14. Hwang S, Lee JH, Park C, Lee H, Kim C, Park C, Lee MH, Lee W, Park J, Kim
K, Park NG, Kim C (2007) A highly efficient organic sensitizer for dyesensitized solar cells. Chem Commun 36:4887–4889
15. Chen R, Yang X, Tian H, Wang X, Hagfeldt A, Sun L (2007) Effect of
tetrahydroquinoline dyes structure on the performance of organic dyesensitized solar cells. Chem Mater 19:4007–4015
16. Qin P, Yang XC, Chen RK, Sun LC, Marinado T, Edvinsson T, Boschloo G,
Hagfeldt A (2007) Influence of π-conjugation units in organic dyes for
dye-sensitized solar cells. J Phys Chem C 111:1853–1860
17. Hayen H, Karst U (2003) Analysis of Phenothiazine and Its Derivatives
Using LC/Electrochemistry/MS and LC/Electrochemistry/Fluorescence.
Anal Chem 75:4833–4840
18. Tang W, Kietzke T, Vemulamada P, Chen Z-K (2007) Synthesis, characteri‑
zation, and photovoltaic properties of novel conjugated copolymers
derived from phenothiazines. J Polym Sci A Polym Chem 45:5266–5276
19. Mao M, Zhang X-L, Fang X-Q, Wu G-H, Dai S-Y, Song Q-H, Zhang X-X
(2014) Highly efficient light-harvesting boradiazaindacene sensitizers
for dye-sensitized solar cells featuring phenothiazine donor antenna. J
Power Sources 268:965–976
20. Ashoor A, Lorke D, Nurulain SM, Kury LA, Petroinu G, Yang KH, Oz M
(2011) Effects of phenothiazine-class antipsychotics on the function of
α7-nicotinic acetylcholine receptors. Eur J Pharmacol 673:25–32
21. Ordway D, Viveiros M, Leandro C, Bettencourt R, Almeida J, Martins M,
Kristiansen JE, Molnar J, Amaral L (2003) Clinical concentrations of thiori‑
dazine kill intracellular multidrug-resistant Mycobacterium tuberculosis.
Antimicrob Agents Chemother 47:917–922
Page 14 of 15
22. Motohashi N, Kawase M, Saito S, Sakagami H (2000) Antitumor potential
and possible targets of phenothiazine-related compounds. Curr Drug
Targets 1:23–245
23. Mocko JB, Kern A, Moosmann B, Behl C, Hajieva P (2010) Phenothiazines
interfere with dopaminergic neurodegeneration in Caenorhabditis
elegans models of Parkinson’s disease. Neuro biol Dis 40:120–129
24. Nagel D, Spranger S, Vincendeau M, Grau M, Raffergerst S, Kloo B, Hlahla
D, Neuenschwander M, von Kries JP, Hadian K, Dörken B, Lenz P, Lenz G,
Schendel DJ, Krappmann D (2012) Pharmacologic inhibition of MALT1
protease by phenothiazines as a therapeutic approach for the treatment
of aggressive ABC-DLBCL. Cancer Cell 22:825–837
25. Darvesh S, Macdonald IR, Martin E (2013) Structure guided design of a
series of sphingosine kinase (SphK) inhibitors. Bioorg Med Chem Lett
23:3822–3825
26. La Du BN, Bartels CF, Nogueira CP, Arpagaus M, Lockridge O (1991) Pro‑
posed nomenclature for human butyrylcholinesterase genetic variants
identified by DNA sequencing. Cell Mol Neurobiol 11:79–89
27. Arshad MN, Mahmood T, Khan AF, Zia-Ur-Rehman M, Asiri AM, Khan IU,
Nisa R-U, Ayub K, Mukhtar A, Saeed MT (2015) Synthesis, crystal structure
and spectroscopic properties of 1,2-benzothiazine derivatives: an experi‑
mental and dft study. Chinese J Struc Chem 34:15–25
28. Arshad MN, Asiri AM, Alamry KA, Mahmood T, Gilani MA, Ayub K, Birinji AS
(2015) Synthesis, crystal structure, spectroscopic and density functional
theory (dft) study of n-[3-anthracen-9-yl-1- (4-bromo-phenyl)-allylidene]n-benzenesulfonohydrazine. Spectrochim Acta A 142:364–374
29. Shafiq M, Khan IU, Zia-ur-Rehman M, Arshad MN, Asiri AM (2011)
4-Hydrazinyl-idene-1-methyl-3H-2λ,1-benzothia-zine-2,2-dione. Acta
Cryst. E. 67:2038–2039
30. Arshad MN, Bibi A, Mahmood T, Asiri AM, Ayub K (2015) Synthesis, crystal
structures and spectroscopic properties of triazine-based hydrazone
derivatives: a comparative experimental-theoretical study. Molecules
20:5851–5874
31. Taib LA, Faidallah HM, Sahin ZS, Asiri AM, Sahin O, Arshad MN (2014) Syn‑
thesis, spectral analysis, X-ray crystal structures and evaluation of chemi‑
cal reactivity of five new benzoindazole derivatives through experimental
and theoretical studies. J. Mol. Str. 1076:272–279
32. Shafiq M, Khan IU, Zia-ur-Rehman M, Asghar MN, Asiri AM, Arshad MN
(2012) Synthesis and antioxidant activity of a new series of 2,1-benzothia‑
zine 2,2-dioxide hydrazine derivatives. Asian J Chem 24:4799–4803
33. Chu SSC, Van der Helm D (1975) 1-Methylphenothiazine and 1-ethylphe‑
nothiazine, a nearly isomorphous pair. Acta Cryst B 31:1179–1183
34. Hdii F, Reboul J-P, Barbe J, Siri D, Pepe G (1998) 10-Ethyl-3-nitrophenothia‑
zine. Acta Cryst C 54:1151–1152
35. Li DM, Hu RT, Zhou W, Sun PP, Kan YH, Tian YP, Zhou HP, Wu JY, Tao XT,
Jiang MH (2009) Synthesis, structures, and photophysical properties of
two organostannoxanes from a novel acrylic acid derived from pheno‑
thiazine. Eur J Inorg Chem 18:2664–2672
36. Li DM, Lv LF, Sun PP, Zhou W, Wang P, Wu JY, Kan YH, Zhou HP, Tian YP
(2009) Synthesis, structures, and photophysical properties of two orga‑
nostannoxanes from a novel acrylic acid derived from phenothiazine.
Dyes Pigm 83:180–186
37. Sundaraganesan N, Ilakiamani S, Saleem H, Wojciechowski PM, Michalska
D (2005) FT-Raman and FT-IR spectra, vibrational assignments and
density functional studies of 5-bromo-2-nitropyridine. Spectrochim Acta
A 61:2995–3001
38. Vitnik VD, Vitnik ZJ, Banjac NR, Valentic NV, Uscumlic GS, Juranic IO (2014)
Quantum mechanical and spectroscopic (FT-IR, 13C, 1H NMR and UV)
investigations of potent antiepileptic drug 1- (4-chloro-phenyl)-3-phenylsuccinimide. Spectrochim Acta A 117:42–53
39. Teimouri A, Chermahini AN, Taban K, Dabbagh HA (2009) Experimen‑
tal and CIS, TD-DFT, ab initio calculations of visible spectra and the
vibrational frequencies of sulfonyl azide-azoic dyes. Spectrochim Acta A
72:369–377
40. Vrielynck L, Cornard JP, Merlin JC, Lautie MF (1994) Semi-empirical and
vibrational studies of flavone and some deuterated analogues. Spectro‑
chim Acta A 50:2177–2188
41. Silverstein M, Basseler GC, Morill C (1981) Spectrometric Identification of
Organic Compounds. Wiley, New York
42. Demircioglu Z, Albayrak C, Buyukgungor O (2014) Experimental (X-ray,
FT-IR and UV–vis spectra) and theoretical methods (DFT study) of
Al‑Zahrani et al. Chemistry Central Journal (2016) 10:13
43.
44.
45.
46.
47.
48.
49.
50.
51.
52.
53.
54.
(E)-3-methoxy-2-[(p-tolylimino) methyl] phenol. Spectrochim Acta A
128:748–758
Fleming I (1976) Frontier orbitals and organic chemical reactions. Wiley,
London
Kumar A, Deval V, Tandon P, Gupta A, Dsilva ED (2014) Experimental and
theoretical (FT-IR, FT-Raman, UV-vis, NMR) spectroscopic analysis and
first order hyperpolarizability studies of non-linear optical material: (2E)3-[4- (methylsulfanyl) phenyl]-1- (4-nitrophenyl) prop-2-en-1-one using
density functional theory. Spectrochim Acta A 130:41–53
Sarkar D, Pramanik AK, Mondal TK (2013) Synthesis, crystal structure
and spectral properties of 2-[(1-Methyl-2-benzimidazolyl)azo]-p-cresol:
an experimental and theoretical study. Spectrochimica Acta Part A
115:421–425
Scrocco E, Tomasi J (1978) Electrostatic molecular potential analysis of
electron density distribution in (ClAlMe2)2 and (AlCl3)2. Adv Quantum
Chem 11:115–121
Luque FJ, Lopez JM, Orozco M (2000) Electrostatic interactions of a solute
with a continuum. A direct utilization of ab initio molecular potentials for
the prevision of solvent effects. Theor Chem Acc 103:343–345
Politzer P, Laurence PR, Jayasuriya K (1985) Molecular electrostatic poten‑
tials: an effective tool for the elucidation of biochemical phenomena.
Environ Health Perspect 61:191–202
Muthu S, Maheswari JU (2012) Quantum mechanical study and spectro‑
scopic (FT-IR, FT-Raman, 13C, 1H, UV) study, first order hyperpolarizability,
NBO analysis, HOMO and LUMO analysis of 4-[(4-aminobenzene) sulfonyl]
aniline by ab initio HF and density functional method. Spectrochim Acta
A 92:154–163
Reed AE, Weinhold F (1985) Natural localized molecular orbitals. J Chem
Phys 83:1736–1740
Reed AE, Weinhold RB, Weinhold F (1985) Natural Population Analysis. J
Chem Phys 83:735–746
Reed AE, Weinhold RB (1983) Natural bond orbital analysis of near-Har‑
tree–Fock water dimer. J Chem Phys 78:4066–4073
Foster JP, Weinhold F (1980) Natural hybrid orbitals. J Am Chem Soc
102:7211–7218
Choudhary N, Bee S, Gupta A, Tandon P (2013) Comparative vibrational
spectroscopic studies, HOMO–LUMO and NBO analysis of N- (phenyl)-2,
2-dichloroacetamide, N- (2-chloro phenyl)-2, 2-dichloroacetamide and
Page 15 of 15
55.
56.
57.
58.
59.
60.
61.
62.
63.
64.
65.
66.
67.
N- (4-chloro phenyl)-2, 2-dichloroacetamide based on density functional
theory. Comput Theor Chem 1016:8–21
Thanthiriwatte KS, de Silva KMN (2002) Non-linear optical properties of
novel fluorenyl derivatives—Ab initio quantum chemical calculations. J
Mol Struc (Theochem). 617:169–175
Bartkowiak W, Misiaszek T (2000) Solvent effect on static vibrational and
electronic contribution of first-order hyperpolarizability of pi-conjugated
push-pull molecules: quantum-chemical calculation. Chem Phys
261:353–357
Kleinman DA (1962) Nonlinear dielectric polarization in optical media.
Phys Rev 126:1977–1979
Mendis BAS, De Silva KMN (2004) A comprehensive study of linear and
non-linear optical properties of novel charge transfer molecular systems.
J Mol Struc (Theochem). 678:31–38
Tillekaratne AD, De Silva RM, De Silva KMN (2003) Push–pull porphyrins
as non-linear optical materials: ab initio quantum chemical calculations. J
Mol Struct (Theochem). 638:169–176
CrysAlis PRO (2012) Agilent technologies. Yarnton, England
Sheldrick GM (2008) SHELXS SHELXL. Acta Cryst A. 64:112
Barbour LJ (2001) X-Seed—a softwaretool for supramolecular crystallog‑
raphy. J Supramol Chem 1:189–191
Farrugia LJ (2012) WinGX and ORTEP for Windows: an update. J Appl Cryst
45:849–854
Spek AL (2009) Structure validation in chemical crystallography. Acta
Cryst D 65:148–155
Dolomanov OV, Bourhis LJ, Gildea RJ, Howard JAK (2009) OLEX2: a com‑
plete structure solution, refinement and analysis program. J Appl Cryst
42:339–341
Frisch MJ, Trucks GW, Schlegel HB, Scuseria GE, Robb MA, Cheeseman JR,
Scalmani G, Barone V, Mennucci B, Petersson GA, et al (2010) Gaussian 09,
Revision C.01. Gaussian Inc, Wallingford
Roy D, Todd K, John M (2009) Gauss view, version 5. Semichem Inc, Shaw‑
nee Mission