Analysis of steroid hormones and their conjugated forms in water and urine by online solid-phase extraction coupled to liquid chromatography tandem mass spectrometry
Bạn đang xem bản rút gọn của tài liệu. Xem và tải ngay bản đầy đủ của tài liệu tại đây (1.93 MB, 17 trang )
Naldi et al. Chemistry Central Journal (2016) 10:30
DOI 10.1186/s13065-016-0174-z
RESEARCH ARTICLE
Open Access
Analysis of steroid hormones and their
conjugated forms in water and urine by on‑line
solid‑phase extraction coupled to liquid
chromatography tandem mass spectrometry
A. C. Naldi1, P. B. Fayad1, M. Prévost2 and S. Sauvé1*
Abstract
Background: In recent years, endocrine disrupting compounds (EDCs) have been found in rivers that receive significant inputs of wastewater. Among EDCs, natural and synthetic steroid hormones are recognized for their potential to
mimic or interfere with normal hormonal functions (development, growth and reproduction), even at ultratrace levels
(ng L−1). Although conjugated hormones are less active than free hormones, they can be cleaved and release the
unconjugated estrogens through microbial processes before or during the treatment of wastewater. Due to the need
to identify and quantify these compounds, a new fully automated method was developed for the simultaneous determination of the two forms of several steroid hormones (free and conjugated) in different water matrixes and in urine.
Results: The method is based on online solid phase extraction coupled with liquid chromatography and tandem
mass spectrometry (SPE–LC–MS/MS). Several parameters were assessed in order to optimize the efficiency of the
method, such as the type and flow rate of the mobile phase, the various SPE columns, chromatography as well as
different sources and ionization modes for MS. The method demonstrated good linearity (R2 > 0.993) and precision
with a coefficient of variance of less than 10 %. The quantification limits vary from a minimum of 3–15 ng L−1 for an
injection volume of 1 and 5 mL, respectively, with the recovery values of the compounds varying from 72 to 117 %.
Conclusion: The suggested method has been validated and successfully applied for the simultaneous analysis of
several steroid hormones in different water matrixes and in urine.
Keywords: Conjugated steroid hormones, Solid phase extraction (SPE), Liquid chromatography tandem mass
spectrometry (LC–MS/MS), Wastewater, River water, Urine, Estrogens
Background
In the past decades, endocrine disrupting compounds
(EDCs) have been observed in rivers that receive significant inputs of wastewater effluents. EDCs are chemicals
with the potential to cause negative effects on the hormonal functions of humans and other animals with potentially harmful consequences, such as decreased fertility,
development and growth problems in humans and hermaphroditism and feminization in animals [1, 2]. Among
*Correspondence:
1
Department of Chemistry, Université de Montréal, Montreal, QC, Canada
Full list of author information is available at the end of the article
the large number of chemicals potentially responsible for
endocrine disruption in wildlife, natural and synthetic
estrogenic hormones have been considered as a matter of concern by scientists, water quality regulators and
the general public [3]. Estrogens are known EDCs at the
sub ng L−1 level [3, 4], while most of the other chemicals
having an estrogenic effect are usually biologically active
around the mg L−1 level [5–7].
Humans produce and excrete large quantities of endogenous estrogenic hormones. These natural hormones are
excreted as sulfate or glucuronide conjugates mainly in
urine [8, 9]. Synthetic estrogens are also of great interest due to their high estrogenic potency and the extent
© 2016 Naldi et al. This article is distributed under the terms of the Creative Commons Attribution 4.0 International License
( which permits unrestricted use, distribution, and reproduction in any medium,
provided you give appropriate credit to the original author(s) and the source, provide a link to the Creative Commons license,
and indicate if changes were made. The Creative Commons Public Domain Dedication waiver ( />publicdomain/zero/1.0/) applies to the data made available in this article, unless otherwise stated.
Naldi et al. Chemistry Central Journal (2016) 10:30
of their use. They have been used not only as contraceptives, but also for therapeutic purposes, in the management of hormone replacement therapy for menopausal
women or in the treatment of various cancers, such as
prostatic and breast cancer [2].
The contamination of the environment by estrogens
can take place through the application of biosolids from
municipal WWTP (wastewater treatment plant) on agricultural fields. However, the main pathway is usually
through wastewater effluents, which after incomplete
removal of these compounds in the municipal WWTP,
are released into the receiving waters [10, 11].
Although the conjugated estrogens have been recognized to have a lower biologic activity than free
(non-conjugated) estrogens, they can be cleaved to free
estrogens. The presence of free estrogens in WWTP
effluents and rivers [3, 10–15] indicated that estrogen
metabolites could be converted back into active form
before being released into the rivers. The cleavage of conjugated to free estrogens in the environment has not yet
been well documented. Among the different hypotheses
microbial processes before or during sewage treatment
have been the most accepted hypothesis [16, 17]. Escherichia coli is known to be able to synthesize large amounts
of the b-glucuronidase enzymes [18], and this has been
suggested as the most probable mechanism responsible
for the transformation.
Accurate detection and quantification of free and conjugated estrogens in rivers and wastewater is difficult to
perform. The complexity of these matrices, the need to
concentrate the samples due to the low concentration of
the compounds, and the importance of sample integrity
to avoid compound degradation all need to be considered. In previous works, estrogens and their conjugates
were qualitatively and quantitatively determined by radioimmunoassay technique [12] or even by more sensitive
and selective techniques, such as gas chromatography/
mass spectrometry (GC–MS) [19, 20], or solid phase
extraction (SPE) followed by liquid chromatography and
tandem mass spectrometry, offline SPE–LC–MS/MS [14,
15].
SPE–LC–MS/MS seems to be the most promising
currently available analytical technique to perform the
detection and quantification of estrogens, since analytical
methodologies based on radioimmunoassay techniques
[21, 22] might overestimate estrogen concentrations and
the GC techniques can be time-consuming and laborintensive, often requiring derivatization and enzymatic
hydrolysis prior to analysis [22, 23].
Immunoassays were extensively applied in the field
of steroid determination in biological matrices. They
have been replaced because of the problem with the
Page 2 of 17
cross-reactivity of various forms of common conjugates
to the antibody. Immunoassays also require long preparation times, have limited dynamic range, and only allow
the analysis of only one analyte at a time and cannot provide structural validation of the analyte [24].
Despite high resolution, lower operation cost and
reduced solvent consumption, GC are less commonly
used for the analysis of steroids than LC, mainly due to
the difficulty of sample preparation, as derivatization
should be applied in all studies with GC–MS determination [25].
Off-line SPE is one of the most common methods used
to concentrate analytes and remove matrix interferences
to achieve the desired levels of analytical sensitivity [26,
27]. However, this process can be labor-intensive, often
requiring many steps and the need for large sample volume. The development of on-line SPE methods, by coupling SPE to the LC system using a column-switching
technique could be an advantageous. It eliminates several required steps (namely evaporation and reconstitution), reduces sample manipulation as well as preparation
time in comparison to off-line SPE. The automation of
on-line SPE results in better repeatability and reproducibility, which helps to improve the quality of the reported
analytical data. Higher sample throughput increases the
number of samples that can be analyzed in a single day.
In addition, smaller sample volume and solvent requirements reduce the costs of consumables and the environmental footprint [28, 29].
Although automated on-line methods have clearer
advantages over off-line SPE [30], the development of
on-line methods can be challenging. The transfer of offline methods to on-line mode may lead to an incompatibility between SPE sorbents and analytical columns,
adjustment of mobile phases, pH incompatibility and
peak broadening [31]. In addition, to achieve comparable pre-concentration factors to off-line SPE, it is possible to increase the on-line injection volumes. In this
case, breakthrough volume estimation is necessary to
guarantee that the compounds are fully retained during
the loading of the SPE the column and that there are no
losses of analytes [32, 33].
In this study, a fully automated on-line solid-phase
extraction–liquid chromatography–mass spectroscopy
detection (SPE–LC–MS/MS) is presented. It allows for
the simultaneous detection of both estrogens forms (conjugated and free) in urine and water samples. In order to
confirm the presence (or absence) of conjugated and free
estrogens and the applicability of the method in urine
and real environmental samples, the determination of
the selected conjugated and free estrogens hormones at
low-nanogram per liter levels was done. Urine samples
Naldi et al. Chemistry Central Journal (2016) 10:30
from pregnant women and women of reproductive age
were analyzed. Wastewater and effluent samples from the
Repentigny wastewater treatment facility (north-east of
Montreal, QC, Canada) and river samples from four different locations: Thousand Islands River, Saint Lawrence
River (at Delson), Des Prairies River and Saint Lawrence
River (at Repentigny), all in the province of Quebec,
Canada were analyzed. The method has been validated
by evaluating the linear range, accuracy and precision
(intra-day and inter-day).
Experimental
Standards and reagents
Conjugated estrogens standards (estriol-3-sulfate (E33S), estradiol-3-sulfate (E2-3S), estrone-3-sulfate (E1-3S),
estradiol-17-sulfate (E2-17S), estradiol-17-glucoronide
(E2-17G)), and the internal standard [estradiol-d4-3-sulfate (E2-d4-3S)] were obtained from Steraloids Inc.
(Newport, RI, USA). Free estrogens standards [estriol
(E3), estrone (E1), estradiol (E2) and 17-alpha-ethinylestradiol (EE2)], and the internal standard [13C6]-estradiol
were purchased from Sigma–Aldrich (St. Louis, MO,
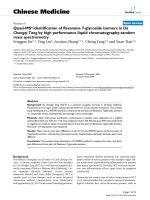
USA). The chemical structures of the estrogens studied are shown in Fig. 1. Other solvents and reagents
(trace analysis grade), methanol (MeOH), ammonium
hydroxide (NH4OH) and HPLC-grade water were purchased from Fisher Scientific Inc. (Whitby, ON, Canada). Individual stock solutions for all compounds were
prepared by dissolving accurately-weighed samples in
HPLC-grade methanol to obtain a final concentration
of 1000 µg mL−1. These solutions were kept at −20 °C.
Standard solutions containing all compounds were mixed
and diluted with methanol. Standard working solutions
of all compounds and calibration concentrations were
prepared daily by serial dilution with HPLC-grade water
(95 % H2O, 5 % MeOH maximum v/v).
Instrumental conditions
Sample pre-concentration and separation were performed using the EQuan™ system (Thermo Fisher Scientific, Waltham, MA, USA) combined with detection
using a Quantum Ultra AM tandem triple quadrupole
mass spectrometer fitted with an HESI source. The
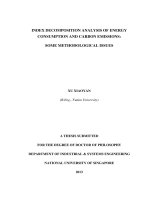
EQuan™ system was based on a column-switching technique as shown in Fig. 2. The instrument was operated in
negative ionization mode for the selected compounds of
interest and was directly coupled to the HPLC system. A
column switching technique was used to perform the online SPE–LC–MS/MS analysis. Sample analysis was performed in the selected reaction monitoring mode (SRM).
System control and data acquisition were performed
using the Analyst Xcalibur software (rev. 2.0 SP2, Thermo
Fisher Scientific, USA).
Page 3 of 17
On‑line solid phase extraction
The column switching system combines a six-port and a
ten-port valve (VICI® Valco Instruments Co. Inc., Houston, TX, USA). This technique allowed the injection
and pre-concentration of samples using a high-pressure
pump, a low-pressure pump, a load column and an analytical column.
The samples were injected using a HTC thermopal
autosampler (CTC analytics AG, Zwingen, Switzerland).
Two different sample volumes were injected in the system (1 and 5 mL). In the first case, the instrument was
programmed to draw 1.2 mL of the sample from the
vial and inject it in the 1 mL injection loop. In the second case, it was programmed to draw three times 2.5 mL
(total of 7.5 mL) of the sample from the vial and inject
it in the 5 mL injection loop. The excess of sample was
injected to guarantee that the loop was completely filled
and to reduce the sample dilution effect inside the loop
during the injection process [32].
The samples were then pre-concentrated on the loading column (BetaBasic 20 × 2.1 mm, 5 µm particle size in
DASH, Thermo Fisher Scientific, USA) with 60 % of solvent A (0.1 % NH4OH, H2O) and 40 % of solvent B (0.1 %
NH4OH, MeOH) using the load pump (low-pressure
quartenary pump Accela 600, from Thermo Fisher Scientific, USA) at a flow rate of 1000 μL min−1. The valve
position was then switched to allow the bound material
to be eluted from the extraction cartridge in back flush
mode directly onto the analytical column (Betabasic 18,
100 × 2.1 mm, 3.0 μm particle size, Thermo Fisher Scientific, USA) coupled with a guard column using the same
packing material (10 × 2.1 mm/3.0 μm, Thermo Fisher
Scientific, USA). A high-pressure quaternary pump
Accela 1250, from Thermo Fisher Scientific, USA was
used for liquid chromatography (analytical pump).
Optimization of the on-line sample pre-concentration
was done by a series of tests to study the behaviour of the
system to variations of key parameters such as column
type, sample load flow rate, volume of the load column
wash and organic solvent content of the load column
wash.
Chromatographic conditions
Once the analytes retained by the load column (SPE)
were gradually eluted by back flushing and then introduced in the LC system (guard column and analytical
column), where chromatographic separation took place.
The analytical pump gradient was composed of solvent
A: 0.1 % NH4OH, H2O and solvent B: 0.1 % NH4OH,
MeOH. The gradient elution program is shown in Additional file 1 (for a 1.0 and 5.0 mL loop, respectively). Column temperature was set to 30 °C. Separated compounds
were then introduced to the MS inlet for analysis.
Naldi et al. Chemistry Central Journal (2016) 10:30
Fig. 1 Chemical structures of target free and conjugated estrogens (drawn using ChemBioDra Ultra 14.0)
Page 4 of 17
Naldi et al. Chemistry Central Journal (2016) 10:30
Page 5 of 17
Fig. 2 The EQuan™ system (column-switching technique) schema used in this experiment
All the operations were fully automated with a separation time of 10 min and a total run time of 20 min. To
avoid sample cross contamination, the syringe and the
injection valve were washed twice with 5 mL of a mix of
ACN/iso-Propanol/MeOH (1/1/1; v/v/v) and H2O after
each injection.
Naldi et al. Chemistry Central Journal (2016) 10:30
Page 6 of 17
Mass spectrometry
Optimization of the mass spectrometry (MS) was performed. Key parameters such as ionization source (HESI
and APCI), ionization modes (negative and positive),
spray voltage, sheath gas pressure, auxiliary gas pressure
and capillary temperature were tested in order to achieve
the highest possible sensitivity. The best conditions of
ionization of analytes were obtained using heated electrospray ionization in negative mode (HESI-). Ion source
parameters were optimized for each compound using
the Quantum Tune application of Xcalibur software (rev.
2.0 SP2, Thermo Fisher Scientific, USA) which was also
used to control the instrument and for data acquisition.
Individual standard solutions (10 mg L−1) were infused
with the syringe pump and mixed using a tee with the
LC flow, mobile phase solvent A: 0.1 % NH4OH, H2O and
solvent B: 0.1 % NH4OH, MeOH (50:50), (300 μL min−1),
before being introduced into the HESI source. The fullscan mass spectra and the MS/MS spectra of the selected
compounds were obtained for all analytes. The selected
reaction-monitoring mode (SRM) was performed for
the detection of the two most intense transitions at their
respective m/z ratios. The most intense SRM transition
(SRM#1) was selected for quantitation and the second
most intense (SRM#2) was used for confirmation. SRM
transitions, collision energy and skimmer offset were
compound-dependent and appear in Table 1. The identification of analytes was confirmed by the LC retention
time [34–36].
For the compound E1-3S only one transition was used
in water matrix as the second transition is not intense
enough for the identification and quantification of this
compound in the desired concentration range. The second transition for this compound showed satisfactory
Table 1 Tandem mass spectrometry (MS/MS) optimized
parameters for the analysis of selected estrogens hormones in negative (NI) ionization mode
Hormone
Ion
SRM#1
Collision
energy
(V)
SRM#2
Collision
energy
(V)
E3-3S
367
287
38
80
33
E2-17G
447
271
31
325
28
E2-3S
351
271
37
145
48
E1-3S
349
269
36
145
53
E2-17S
351
97
41
80
42
E2-d4-3S
355
275
40
–
–
E1
269
145
41
159
41
E2
271
145
47
183
44
EE2
295
145
48
159
38
E3
287
14
44
171
37
13C6-E2
277
145
48
–
–
Tube
lens
(V)
−98
−94
−93
−90
−96
−91
−94
−95
−100
−98
−101
results only for concentrations of at least 200 ng L−1 and
was used in urine samples.
A basic additive, ammonium hydroxide (NH4OH), was
added to the mobile phase to improve dissociation of the
phenol group and improve the sensitivity [37, 38].
Breakthrough volume estimation
Breakthrough volume estimation experiments are usually done using the graphical extrapolation method [36].
However, they can also be done experimentally; optimizing the SPE loading speed and the sample volume that
can be charged in the column without loss of analytes
[39].
The breakthrough volume for the selected estrogens
was established by injecting different sample volumes (1,
2, 5 and 10 mL) and comparing absolute areas and signalto-noise values. Tests were done in duplicate, with triplicate samples each time. Samples were prepared daily
at the same concentration (500 ng L−1) in HPLC water,
using 1, 2, 5 and 10 mL loops. Results were analysed
using linear regression to determine the maximum injection volume.
Matrix effects study
Matrix effects are very important when developing a
method, since they might affect reproducibility and accuracy [34, 35, 40–43]. Matrix effects were evaluated by
comparing the results of spiked (50–200 ng L−1) HPLC
water samples with those measured in tap water, river
water and wastewater spiked with the same amounts of
analytes. The absolute matrix effect was calculated as:
Matrix Effect (%) =
Cmatrix CHPLC × 100
where Cmatrix = measured concentration in the tap water,
river water and wastewater sample, CHPLC = measured
concentration in HPLC water.
A value of 100 % indicates that there is no absolute
matrix effect. If the value is >100 %, there is a signal
enhancement while a signal suppression is observed if
the value is <100 %. These experiments were performed
with five replicates.
Method validation and calibration
The performance of the method was evaluated through
estimation of the recovery, linearity, repeatability (intraday precision), intermediate precision (inter-day precision), accuracy, limit of detection (LOD) and limit of
quantification (LOQ).
The recovery for the online SPE method was evaluated
at two different concentrations (500 and 1000 ng L−1,
n = 5). The mean peak areas (20 and 40 µg L−1, n = 5)
of the selected estrogens of a direct injection (25 µL)
were compared with those of the on-line 1 mL volume
Naldi et al. Chemistry Central Journal (2016) 10:30
injection. The same mass of analyte was injected in both
cases [39].
Calibration curves were established in urine, HPLCgrade water, tap water, river water and wastewater in
order to avoid the influence of matrix effects on linearity. At least five-point calibration curves were established
for the analytes in aqueous samples (5–5000 ng L−1
injected in duplicate or triplicate). The calibration range
was chosen based on the method analytical performance
and the concentrations found for these compounds in
the literature [1, 15, 23, 37, 44–47]. Quantification for all
compounds was performed using a standard addition calibration with linear regression and isotopically-labelled
internal standards between 0.25 and 1 μg L−1. Calibration
curves were built with the response ratio (area of the analyte standard divided by area of the internal standard) as
a function of the analyte concentration. A linear regression model was applied, with coefficients of determination (R2) greater than 0.993 for all analytes.
Accuracy was evaluated by comparing the results
of spiked tap water, river water, wastewater and urine
samples (50–200 ng L−1 for water samples and 500–
5000 ng L−1 for urine samples) with the nominal spike
concentration. The accuracy was calculated as:
Accuracy (%) = 100 − (Ce −Cm ) (Ce ) × 100
where Cm = measured concentration, Ce = expected
concentration.
The method repeatability (intra-day precision) and
reproducibility (inter-day precision) were evaluated from
the analysis of replicates of urine, HPLC-grade water, tap
water, river water and wastewater spiked with a standard
mixture of the analytes between 50 and 200 ng L−1. The
repeatability and reproducibility were defined as the relative standard deviation (%) of the response ratio.
Five samples (n = 5) were used to estimate repeatability while twelve samples (n = 12) were used to estimate
reproducibility. Samples were prepared daily and analyzed in the analytical sequence.
Seven to ten samples (n = 7–10) were spiked with all
the analytes of interest at a concentration from two to five
times the estimated detection limit and carried through
the analytical process and analyzed. The limit of detection (LOD) was determined by multiplying the appropriate statistical Student’s t-value (3.143 for seven replicates)
by the standard deviations of the analyzed replicate samples. To be considered acceptable, the level of analyte in
the sample must be above the determined LOD and not
exceed ten times the LOD of the analyte in reagent [48].
Quantification limit (LOQ) was estimated from LOQ
from the equation:
LOQ = LOD × 3
Page 7 of 17
Sample carryover was evaluated by injecting a series
of blanks (n = 4) after a high concentration standard
(2000 ng L−1) in every sequence.
Carryover (%) = Cblank Cstandard × 100
where Cblank = concentration in the blank sample,
Cstandard = concentration of the 2000 ng L−1 spiked
sample.
An appropriate retention time window for each analyte
has been established in order to identify them in quality
control sample (QC). Measurements of the actual retention time variation for each compound in standard solutions over time has also been obtained chromatograms
of field –collected samples. The positive identification
of the estrogens was confirmed by matching chromatographic retention times with those from spiked samples
in HPLC water (analyte-free matrix). The suggested variation is plus or minus three times the standard deviation
of the retention time for each compound for a series of
injections [49]. In addition, at least two selected reaction monitoring (SRM) transitions were selected for
each target compound and their relative intensities were
compared. In accordance with the European Commission, Council Regulation (EEC), [50] the SRM transitions ratios were considered acceptable if the error was
within ±50 % since their relative intensities were inferior
to 10 %.
Environmental samples/sample collection
and preservation
Water samples from a variety of sources in the Montreal
area, were collected.
Sewage and effluent samples were collected from the
Repentigny wastewater treatment plant facility (WWTP).
In the wastewater treatment plant in Lebel Island, the
wastewater treatment involves physical and chemical
processes, as well as a biological sludge process. This
WWTP is part of the short list of plants in Quebec to
produce its own biogas. The biogas is produced by the
anaerobic digestion of the sludge and it is recovered for
several uses, including heating the facility.
River water samples were collected in Saint-Lawrence
River (near Delson and Repentigny), in the Des Prairies
River and in the Milles Iles River. They were selected due
to the documented discharges of urban and agricultural
wastes [34, 41]. Drinking water samples were collected
directly from the Université de Montréal’s tap water
(Montreal’s aqueduct).
Urine samples were kindly obtained from six different women (three pregnant women and three women of
reproductive age, between 15 and 40 years old). Pregnant
women were in the third trimester of their pregnancy
(between 28 and 40 weeks).
Naldi et al. Chemistry Central Journal (2016) 10:30
Page 8 of 17
All samples were collected in clean glass bottles and
then immediately transported to the laboratory. The
samples were filtered using 1.2 mm glass fiber filters
(Millipore, MA, USA) followed by 0.3 mm glass fiber
membranes filters (Sterlitech Corporation, Kent, WA),
stored in the dark at 4 °C and analyzed within 48 h. A
previous study showed that this filtration step did not
cause analyte losses [39]. Aliquots of 10–30 mL of the
water and urine samples were transferred to volumetric
flasks and spiked with the IS for a final concentration of
200–500 ng L−1. The samples were then transferred to
10 mL amber glass vials for on-line SPE–LC–MS/MS
analysis.
Results and discussion
On‑line trace enrichment
Three different SPE columns were tested: Hypersil
Gold aQ. column, 20 × 2.1 mm, 12 μm, Thermo Fisher
Scientific, USA; Hypercarb column, 20 × 2.1 mm,
7 μm, Thermo Fisher Scientific, USA and BetaBasic,
20 × 2.1 mm, 5 μm, in DASH, Thermo Fisher Scientific,
USA (data not shown). The best recovery values were
found using a BetaBasic (Table 2). Important on-line
SPE parameters such as sample loading flow rate, wash
volume and organic modifier in the wash volume were
optimized to obtain optimal results in relation to system
stability and run time using the BetaBasic.
While performing solid-phase extraction, flow rates
from 500 to 2500 μL min−1 were tested to evaluate the
effect of loading speed. Load or elute flow rates that
are too fast may not allow enough time for the analytes
of interest to be bound or removed from the sorbent
[30]. Absolute areas (without internal standard addition) for all target compounds were compared after
analysis of a mix of compounds at 500 ng L−1 (data
Table 2 Recovery values in percentage for the selected
estrogens using the SPE BetaBasic column in HPLC water
samples
Estrogens
Recovery (%)
E3-3S
117
E2-17G
98
E2-17S
96
E1-3S
88
E2-3S
103
E3
95
E2
96
E1
94
EE2
72
Recovery values were calculated comparing off-line small injection
method (25 μL) with online 1 mL injections (same mass of analyte injected)
(C = 500 ng L−1 , n = 5)
not shown). Although significant analyte loses were
not observed even with a 2500 μl min−1 flow rate,
(n = 3, C = 500 ng L−1, Fig. 3), very high flow rates
could not be used given that excessive backpressure
stopped the instrument. Therefore a loading flow rate of
1000 μL min−1 was chosen.
The injection volume was evaluated to improve the
method detection limits (MDLs) and signal intensities. A
previous study showed that a pre-concentration of 10 mL
sample could improve (MDLs) by a factor of 1.7–20 times
compared to the same method using 1 mL injections
[32]. Injections of 1, 2, 5 and 10 mL were tested (n = 3,
C = 200 ng L−1) to evaluate the breakthrough volumes
(Fig. 4). Results show that it is possible to use 5 mL sample injections without significant loss to almost all of the
studied compounds while limiting the total analysis time.
E3-3S and E3 compounds presented a little higher loss
of signal at 5 mL (22 and 24 %, respectively), but since
E3-3S is the compound that yields the best response to
the method, the loss of the signal presented at 5 mL does
not impair the results. In the case of E3, a compromise,
accepting a higher analyte loss, was done once there
was no significant loss to all other compounds analyzed.
Higher injection volumes resulted in loss of analytes,
possibly due to the presence of co-extracted substances
during the loading step that may differentially affect the
signal variability of each analyte. MDLs were obtained in
the low ng L−1 range for all compounds which allowed
the detection of trace amounts of the selected contaminants in all water matrices. Results obtained with 5 mL
injections were lower by a factor of 0.8–10 times in HPLC
water and 0.5–2.7 times in river water compared to 1 mL
injections using exactly the same method. Sample size of
1 mL for wastewater samples were used due to the high
matrix interference when 5 mL sample sizes were used.
Urine samples presented high concentrations for most
of the studied conjugated estrogens. A dilution factor of
ten was applied to urine sample before injecting a 1 mL
aliquot. Thus, no other injection volume was tested for
this matrix.
Chromatographic analysis
Optimization of the chromatographic separation was
done by a series of tests to study the behaviour of the system to variations of key parameters such as column type,
solvent load flow rate, organic solvent type and column
temperature.
Several mobile phase compositions were tested: acetonitrile (ACN) and water (H2O); ACN and H2O with
100 mM triethanolamine (TEA); ACN and H2O with
10 mM ammonium acetate; ACN and H2O with bicarbonate 10 mM [51]; methanol (MeOH) and H2O with
0.1 % NH4OH; MeOH and H2O with ethyl acetate 2, 5
Naldi et al. Chemistry Central Journal (2016) 10:30
Page 9 of 17
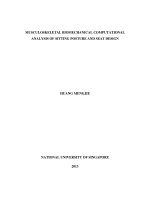
Fig. 3 Effect of loading speed. Percentage recovery for all analytes tested using 1500 µl min−1, 2000 μL min−1 and 2500 µL min−1 flow rates. A flow
of 1000 μl min−1 was considered as 100 % (n = 3, C = 500 ng L−1)
Fig. 4 Breakthrough volume determination in HPLC water. Percentage recovery for 1, 2, 5 and 10 mL sample volume injections. 1 mL injection was
considered as being 100 % (n = 3, C = 200 ng L−1)
and 10 %, 0.1 % NH4OH; MeOH and H2O. The optimal
separation of the nine estrogens, presenting the best peak
shape and separation was achieved using a binary mobile
phase composed of 0.1 % NH4OH, H2O in combination
with an organic mobile phase of 0.1 % NH4OH, MeOH.
Four different columns: Accucore RP-MS, 50 × 2.1 mm,
2.6 μm, Thermo Fisher Scientific, USA; Accucore RP-MS,
100 × 2.1 mm, 2.6 μm, Thermo Fisher Scientific, USA; Zorbax Extend-C18, Agilent, USA and BetaBasic Column C18,
100 × 2.1 mm, 3 µm, Thermo Fisher Scientific, USA were
tested (results not shown). Similar results were found with
100 and 50 mm Accucore columns. BetaBasic Column C18
showed the best results. This column was chosen given its
performance and to lower the possibility of peak broadening often observed when an on-line SPE column is coupled
with an analytical column having a different type of solid
phase chemistry [52]. Although many system configurations have been prone to premature aging of columns that
do not survive more than a few dozens of analysis before
columns need to be replaced given the pressure build up
and column clogging [53], tests of the columns’ lifetime
for our setup have shown that approximately 150 samples
Naldi et al. Chemistry Central Journal (2016) 10:30
could be analyzed with the same column before significant
changes were observed on peak shapes. Volume injections
were set at 1 and 5 mL and the total time for analysis was 16
and 20 min respectively. Shorter times for separation were
tested but resulted in co-elution for certain compounds.
According to these results, the 10 min separation time for
analysis was divided into two segments (conjugated and
free estrogens) to improve sensitivity (Figs. 5, 6).
The optimal gradient elution program was a challenge
given the similar structures of the estrogens and that
some of them showed poor separation. Other studies
presented the same limitations [34, 41]. Since tandem
MS is used to detect the target compounds and they
have different precursor ions and monitored transitions
(Table 2), complete separation is not required. Final solvent flow rate was set to 250 μL min−1. Higher flow rates
were tested but resulted in poor peak resolution and
peak shapes (Fig. 3). Representative chromatograms of a
2 μg L−1 standard mixture of the compounds analyzed in
river water are illustrated in Figs. 5 and 6.
Two internal standards (isotopically-labeled E2 and
E2-3S) were used to compensate the signal reproducibility and variations between runs, for free and conjugated
estrogens, respectively.
Page 10 of 17
Method validation
Validation data was obtained for all water matrices and a
summary of the data is presented in Table 3. Additional
files 2 and 3 also present the summary of the results
obtained for precision.
Calibration curves were made using standard additions
(Table 3 and Additional file 4) and show excellent determination coefficients (R2 > 0.993) for all the compounds
in all tested matrices. Intra-day and inter-day precision
were considered acceptable if lower than 20 % (Additional files 2, 3), while 30 % were acceptable for matrix
interferences (accuracy) (Table 4) [48].
In general, for water (HPLC, drinking water and river
water), linearity was excellent with determination coefficients (R2 ≥ 0.991) for all target compounds. Method
intra-day precision was between 3 and 14 % for 1 or 5 mL
injection (C = 200 or 50 ng L−1; n = 10), except for E1-3S
where results were 13–18 %. For inter-day precision
results were lower than 20 % for 1 or 5 mL loops (C = 200
or 50 ng L−1; n = 12). A very low spike concentration (50
or 200 ng L−1) was used to perform validation tests and
since E1-3S was the compound with the weakest signal
in this method (Fig. 5), it was acceptable that it presented
lower precision during the analysis. Consequently, even if
Fig. 5 Representative chromatograms of a 2 μg L−1 standard mixture and of a 0.5 μg L−1 internal standard of the conjugated estrogens analyzed in
river water
Naldi et al. Chemistry Central Journal (2016) 10:30
Page 11 of 17
Fig. 6 Representative chromatogram of a 2 μg L−1 standard mixture and of a 0.5 μg L−1 internal standard of the free estrogens analyzed in river
water
all the results obtained are acceptable, validation data for
this compound presented higher deviation results when
compared with the data obtained for all the other target
compounds. This limitation was not observed in samples with higher concentrations such as waste samples or
urine.
Linearity for wastewater, was very good with determination coefficients (R2 ≥ 0.992), except for E3 for which
R2 was 0.989 for 1 mL sample volume. Method intra-day
precision was lower than 10 % (C = 200 ng L−1; n = 10)
for all compounds except for E3 for which it was 18 %
(n = 7) and lower than 20 % for inter-day precision
(C = 200 ng L−1; n = 12).
For urine, linearity was excellent with determination
coefficients varying between 0.991 ≤ R2 ≤ 0.999 for all
the estrogens tested.
Extraction recovery results for all target compounds
were good (>90 %). When lower spike concentration was
used, extraction recoveries were generally good (>80 %),
except for E3-3S and E1-3S (70.9 % for both compounds).
Results are shown in Additional file 5. Extraction efficacies were tested in two different concentrations for 5 mL
injections (C = 50 and 100 ng L−1; n = 7) and one concentration for 1 mL injections (C = 200 ng L−1; n = 10).
According to previous studies [34, 41], the possibility
of sample carry over from repeat pre-concentration steps
could cause significant concerns in on-line SPE methods.
In order to prevent this, blanks (HPLC water without
analytes or an internal standard solution) were extracted
and analysed in duplicate in every sequence (begin, middle and end) as control for carry over and background
concentrations. Blanks samples with internal standards
were also analyzed during the analytical sequence to confirm the results. No carry over was noticed even when
blanks were extracted and analyzed after 5000 ng L−1
spiked samples (results not shown).
Limits of detection (LOD) were evaluated in HPLC,
drinking, river and wastewater. The most intense transition (SRM#1) was used to calculate the LOD, while the
second most intense transition (SRM#2) was used to confirm the presence of the compound. The limit of detection
(LOD) [48] ranged from 6.9 to 76 ng L−1 while the limit
of quantification (LOQ) ranged from 21 to 228 ng L−1
for 1 mL volume injection. For 5 mL volume injection,
the LOD ranged from 3.3 to 27 ng L−1 while the LOQ
ranged from 10 to 81 ng L−1. Limits of detection and limits of quantification for all matrix tested are presented
in Table 3. Additional files 6 and 7 present the results of
Naldi et al. Chemistry Central Journal (2016) 10:30
Page 12 of 17
Table 3 Limits of detection (LOD) in ng L−1 obtained for all water matrices tested
LOD (in ng L−1)a
Estrogens
HPLC 1 mLb
DW 1 mLb
RW 1 mLb
WW 1 mLb
HPLC 5 mLb
RW 5 mLb
E3-3S
7.1
13
7.1
41
9.2
6.3
E2-17G
27
21
48
42
14
21
E2-17S
6.9
17
8.2
28
4.7
3.3
E1-3S
25
63
74
76
4.6
27
E2-3S
8.9
14
5.0
13
3.4
5.3
E3
37
59
26
52
3.6
10
E2
19
14
9.7
14
6.1
9.5
E1
32
20
5.0
26
13
9.7
EE2
31
46
49
62
7.2
25
DW drinking water, RW river water, WW wastewater
a
LOD—limit of detection, determined using the most abundant product ion
b
Sample volume
Table 4 Concentrations of the selected estrogens in the water samples analysed in ng L−1
Estrogens
Drinking water
(UdeM)
Repentigny
Wastewater
Effluent
St Lawrence river
(Delson)
St Lawrence river
(repentigny)
Prairie river Thousand
island river
E3-3S
<7.1
<41
<6.3
<6.3
<6.3
<6.3
<6.3
E2-17G
<14
<42
<21
<21
<21
<21
<21
E2-17S
<4.7
<28
<3.3
<3.3
<3.3
<3.3
<3.3
E1-3S
<4.6
<76
<27
<27
<27
<27
<27
E2-3S
<3.4
<13
<5.3
<5.3
<5.3
<5.3
<5.3
E3
<3.6
<52
<10
<10
<10
<10
<10
E2
<6.1
<14
<9.5
<9.5
<9.5
<9.5
<9.5
E1
<13
<26
<9.7
<9.7
<9.7
<9.7
<9.7
EE2
<7.2
<62
<25
<25
<25
<25
<25
Samples were collected and analyzed in July 2014
this method compared to the detection limits and limits
of quantification of others methods found in the literature. In general, the limits of detection of this method are
around 10–100 times higher than the limits of detection
found in the literature for wastewater samples analyzed
by equivalent off-line methods. However, the amount of
samples used to achieve these limits is 100–250 times
lower. For river water, even if the amount of sample used
is much lower (1–5 mL instead of 500–2000 mL in other
methods), limits of detection are comparable in some
cases. For E2, the detection limit for 5 mL samples is
9.5 ng L−1 while in some off-line method it is reported
as 2.3 ng L−1 using 500 mL samples [47]. Similar results
are observed for E1: 5 ng L−1, 1 mL sample, compared
to 1.2 ng L−1 [47], 500 mL sample and E2-3S: 5.0 ng L−1,
5 mL sample, compared to 0.74 ng L−1[47] 500 mL sample, with LOD varying less than ten times to the online
method described.
According to Garcia et al. [52] and Schuhmacher et al.
[54] a major problem for quantitative analysis using
HESI is the presence of matrix effects. Matrix effects are
defined as the unexpected suppression or enhancement
of the analyte response due to the presence of other compounds in the sample. Most of the compounds were not
subjected to significant matrix effects (E2-17G, E2-17S,
E2-3S, E1-3S, E2, E1 and EE2) while E3-3S was susceptible to signal enhancement and E3 to signal suppression.
Results for matrix effects and accuracy are presented in
Additional files 8 and 9. Some strategies to reduce matrix
effects such as external calibration using matrix-matched
samples, isotope dilution and standard additions have
been recommended [55]. Although the addition of isotopically-labeled internal standards to compensate for
matrix effects are often considered a lengthy and labor
intensive method [28, 56]. The internal standards were
used in this study since it was shown to be an efficient
Naldi et al. Chemistry Central Journal (2016) 10:30
Page 13 of 17
mean to correct signal distortion caused by matrix
interferences.
The recovery of the urine samples using the online SPE
method was evaluated at three different concentration
levels (500, 1000 and 5000 ng L−1, n = 5). The mean peak
areas of the selected estrogens in HPLC water for a 1 mL
injection were compared with the same volume injection
of those of urine samples for a dilution factor of ten. The
same mass of analyte was injected in both cases. Results
are shown in Additional file 10.
Table 5 Comparison of reported concentrations of the
studied estrogens in river samples
Estrogens
Present study
a
b
c
d
E3-3S
<6.3
<0.3
NA
ND
<0.07
E2-17G
<21
<3.1
<2.24
ND
1.10–7.34
E2-17S
<3.3
NA
NA
NA
NA
E1-3S
<25
0.3–0.8
ND–7
0.3–7
<0.16
E2-3S
<5.3
0.2–0.8
NA
0.2–0.4
0.59–0.85
E3
<10
NA
NA
ND–51
1–7.27
E2
<9.5
NA
NA
ND–8.8
ND
Method application
E1
<9.7
0.2–6.6
4–22
<0.1–17
ND
Analysis of drinking, river, wastewater and effluent water
samples using on‑line SPE–LC–ESI–MS
EE2
<25
NA
NA
NA
ND
Concentrations in ng L−1
To demonstrate the applicability of the developed
method, samples of drinking, river, sewage and effluent
water from the region of Montreal, Quebec, Canada were
analyzed. Results for water samples are summarized in
Table 4.
Results show that free and conjugated estrogens were
not found in concentrations above the LOD of the present method in drinking and river waters for Montreal
area in Canada. In wastewater samples, estriol-3-sulfate
(E3-3S) is most probably present in sewage and effluent
samples, but with very low concentrations (lower than
the method detection limit). Although a clear peak could
be identified, the presence could not be confirmed by a
second SRM transition. The absence of other targeted
estrogens may be influenced by the choice of sampling
sites. These levels were generally similar or lower to those
previously reported [1, 2, 15, 23, 37, 44, 46, 47, 57]. In
addition, most of the data for conjugated estrogens come
from European rivers and wastewaters that present environmental conditions such as temperature and flow that
are different from Montreal, QC, Canada.
Furthermore, in most methods found in the literature,
large sample volumes (up to 4000 mL) are often used for
solid phase extraction prior to analysis to detect estrogens [1, 15, 23, 37, 44–47, 57, 58]. However, the current
method is efficient to quantitate and confirm estrogens
(including conjugated forms) at low concentration levels
(ng L−1) in complexes matrices such as river and wastewater sample using 1 and 5 mL injections. Table 5 for
river water and Table 6 for wastewater show the concentrations found in the literature compared to the present
on-line pre-concentration method.
Determination of conjugated and free estrogen levels
in female urine samples using on‑line SPE–LC–HESI–MS
Zhang and Henion [59] and D’Asenzo [57] showed that
LC–MS/MS, can be successfully used for determining the
low levels of estrogen sulfates in female urine. By using
a similar technique, but with an online SPE extraction,
NA not analyzed
ND not detected
a Isobe et al. [44], 1000 mL volume sample
b Mozaz et al. [46], 500 mL volume sample
c Liu et al. [1], no information about volume sample
d Kuster et al. [47], 500 mL volume sample
an increased number of conjugated estrogens excreted
in female urine have been observed. All the conjugated
estrogens analyzed were identified. Regarding the free
estrogens, apart from some E3 in the urine of pregnant
women, they were never detected.
The complete data on amounts of estrogens in urine of
women (pregnant or not) are presented in Table 7. The
results are similar to those previously measured in other
studies [1], however it is difficult to compare given that
many such studies are based on daily excretion and not
on urine concentration (the results are usually in micrograms per day and not in micrograms per liter). As
expected, estrogen levels in the urine of pregnant women
were much higher than in the urine of non-pregnant
women of similar age.
Conclusion
An on-line SPE LC/MS/MS method for the simultaneous
determination and quantification of conjugated and free
hormones was developed and validated for the analysis
of urine samples, drinking and surface water samples,
as well as sewage and wastewater effluent samples. Contrary to published methods using large sample volumes
(about 250 mL–4 L) and time-consuming offline SPE, we
were able to quantitate all the proposed hormones using
a small sample volume (1–5 mL). All the compounds
could be determined at low nanogram-per-liter range
(3–15 ng L−1) with a recovery higher than 70 % for all
the compounds in all water matrices. For urine samples,
limits of detection ranged from 30 to 150 ng L−1 since
the expected concentrations were much higher and they
Naldi et al. Chemistry Central Journal (2016) 10:30
Page 14 of 17
Table 6 Comparison of measured concentrations of the studied estrogens in wastewater samples (in ng L−1)
Estrogens
Present study a
WW
Eff
WW
c
Eff
e
WW
Eff
f
WW
Eff
g
WW
Eff
WW
h
Eff
WW
Eff
E3-3S
<41
<6.3
NA
<0.3
6.5–333
0.6–160
<1.6
<0.42
NA
NA
14
14
NA
NA
E2-17G
<51
<21
NA
<3.1
ND
ND
<1.7
<0.52
NA
NA
<3
<3
NA
NA
E2-17S
<28
<3.3
NA
NA
NA
NA
NA
NA
NA
NA
NA
NA
NA
NA
E1-3S
<76
<27
NA
0.3–2.2
1.2–170
ND–42
2.9
3.9
10
12
25
25
NA
NA
E2-3S
<13
<5.3
NA
<0.2–1.0
3.2–957
ND–94
<1.1
<0.22
NA
NA
3.3
3.3
NA
NA
E3
<52
<10
NA
NA
ND–660
ND–275
100
ND
50
1.0
33–187
0.43–18
74–234
46–175
E2
<14
<9.5
NA
NA
ND–162
ND–158
2
ND
5.0
0.7
4–25
0.55–3.3
ND–74
ND–51
E1
<26
<9.7
NA
2.5–34
ND–670
ND–147
100
5
15
3.0
25–132
2.5–82
ND–376
ND–42
EE2
<62
<25
NA
NA
NA
NA
15
5
1.2
1.0
0.43–13
ND–1
ND
ND
−1
Concentrations in ng L
NA not analyzed
ND not detected
Eff effluent
WW wastewater
a Isobe et al. [44], 1000 mL volume sample
c Liu et al. [1], no information about volume sample
e Gentili et al. [37], 2000 mL river, 250 mL effluent and 100 wastewater volume sample
f Koh et al. [38], 1000 mL volume sample
g Baronti et al. [15], 400 mL wastewater and 150 mL wastewater volume sample
h Fayad [39], 10 mL volume sample
Table 7 Concentrations of the selected estrogens in the urine samples analysed in µg L−1
Estrogens
LOD (drinking water)
Pregnant women
Women
A (40 years old)
B (30 years old)
C (25 years old)
D (30 years old)
E (35 years old)
F (15 year old)
E3-3S
0.001
493
577
988
16.9
22.5
10.8
E2-17G
0.001
662
798
1707
4.834
10.9
2.29
E2-17S
0.005
<0.005
<0.005
<0.005
6.71
6.68
7.91
E1-3S
0.005
5332
9750
2950
36.2
30.9
NA
E2-3S
0.003
10.1
16.5
5.36
1.74
0.473
2.97
E3
0.004
2.09
1.22
14.2
<0.004
<0.004
<0.004
E2
0.006
<0.006
<0.006
<0.006
<0.006
<0.006
<0.006
E1
0.013
0.42
<0.013
1.08
<0.013
<0.013
<0.013
EE2
0.007
<0.007
<0.007
<0.07
<0.007
<0.007
<0.007
Samples were collected and analyzed in September and October 2014
were diluted at least ten times to avoid matrix interferences. Samples were analyzed in <20 min runs, with only
10 min for analytes separation without the time-consuming steps required for the standard off-line SPE methods.
The main advantage of the on-line SPE is that manual
sample preparation was limited to sample filtration and
spiking of the internal standard solution. This eliminates
several working steps, such as extraction, evaporation
and reconstitution, and significantly reduces time and
procedural errors.
Method detection limits of the nine hormones ranged
from 3 to 15 ng L−1 in clean water but were limited to
14 to 76 ng L−1 in wastewater samples. For all analytes,
method intra-day and inter-day precision were less than
20 %. Accuracy was ±30 %. Such MDL are excellent for
urine analysis but will only be useful in environmental
analysis for fairly contaminated samples or for experimental designs where compounds are spiked.
The results show that the presented method can potentially be applied to the simultaneous analysis of the
Naldi et al. Chemistry Central Journal (2016) 10:30
conjugated and free estrogens at low nanogram-per-liter
levels in complex water matrices and urine samples even
if further optimization of the method for preconcentration could be necessary to improve quantification limits
for clean environmental samples. Considering that the
presented method is able to quantitate both conjugated
and free species of estrogens, in the same run without
any particular preparation, it also shows potential for
studying the deconjugation of metabolized estrogens in
the contaminated water matrices and their implication
on the environmental fate of estrogens, especially considering the fate of conjugated hormones from urine.
Additional files
Page 15 of 17
limit; MeOH: methanol; MS/MS: tandem mass spectrometry; NA: not analyzed;
ND: not detected; NH4OH: ammonium hydroxide; NI: negative ionization
mode; QC: quality control; (QC): Quebec; R2: determination coefficient; RSD:
relative standard deviation; RW: river water; SD: standard deviation; SPE: solid
phase extraction; SRM: selected reaction-monitoring mode; TEA: triethanolamine; WW: wastewater; WWTP: wastewater treatment plant.
Authors’ contributions
The method was fully developed by ACN. ACN was responsible for the bibliographic research, all the experimental work and the sample collection. The
preparation of all standards, solutions, pretreatment and sample analysis was
also from ACN responsibility. Filing and processing of data, including analysis
of results have also been made by ACN. PBF helped to work with the tools and
the techniques used in the development of the method, in addition to discuss
the results and give suggestions to improve the project. MP and SS conceived
the study in collaboration with ACN; SS coordinated the study and edited the
text. All authors have read and approved the final manuscript.
Author details
Department of Chemistry, Université de Montréal, Montreal, QC, Canada.
Department of Civil, Geological and Mining Engineering, Polytechnique
Montréal, Montreal, QC, Canada.
1
Additional file 1: Table S1. Valve program, on-line SPE (loading pump)
and LC (analytical pump). Gradient elution program for 1 and 5 mL
injections, used for the pre-concentration and separation of selected
estrogens. Solvents consist of: H2O with 0.1 % NH4OH(A) and MeOH with
0.1 % NH4OH (B).
Additional file 2: Figure S1. Method validation for precision (intra-day).
C = 200 ng L−1, n = 10 for 1 mL sample volume and C = 50 ng L−1, n = 7
for 5 mL sample volume.
2
Acknowledgements
This work was made possible through the financial support of Veolia Water,
the Natural Sciences and Engineering Research Council of Canada (NSERC),
the NSERC Industrial Chair on Drinking Water at Polytechnique Montréal, the
Canadian Foundation for Innovation (equipment).
Additional file 3: Figure S2. Method validation for precision (interday). C = 200 ng L−1, n = 12 for 1 mL sample volume and C = 50 ng L−1,
n = 15 for 5 mL sample volume.
Competing interests
The authors declare that they have no competing interests.
Additional file 4: Table S2. Method validation results for linearity (R2), for
all waters tested (HPLC water, drinking water, river water and wastewater).
Received: 18 January 2016 Accepted: 26 April 2016
Additional file 5: Table S3. Extraction recovery results for all target compounds in river water. Extraction efficacies were tested in two different
concentrations for 5 mL injections (C = 50 and 100 ng L−1; n = 7) and one
concentration for 1 mL injections (C = 200 ng L−1; n = 10).
Additional file 6: Table S4. Comparison of measured detection limits
(LODs) of the studied estrogens with other methods found in the literature for water samples. Concentrations in ng L−1.
Additional file 7: Table S5. Comparison of measured quantification
limits (LOQs) of the studied estrogens with other methods found in the
literature for water samples. Concentrations in ng L−1.
Additional file 8: Table S6. Accuracy for the selected estrogens for all
waters tested.
Additional file 9: Table S7. Matrix Effects for the selected estrogens for
all waters tested (in percentage).
Additional file 10: Table S8. Calculated recovery values in percentage
for the selected estrogens. BetaBasic column was used as SPE column
for the on-line SPE–LC–MS/MS method. Recovery values were calculated
comparing the same volume injection of those of urine samples diluted at
least ten times. (n = 5).
Abbreviations
ACN: acetonitrile; APCI: atmospheric-pressure chemical ionization; Cblank:
concentration in the blank sample; Ce: expected concentration; Cm: measured
concentration; Cstandard: concentration in the spiked sample; [13-C6]-E2:
[13-C6]-estradiol; DW: drinking water; E1: estrone; E1-3S: estrone-3-sulfate;
E2: estradiol; E2-17G: estradiol-17-glucoronide; E2-17S: estradiol-17-sulfate;
E2-3S: estradiol-3-sulfate; E2-d4-3S: estradiol-d4-3-sulfate; E3: estriol; E3-3S:
estriol-3-sulfate; EDCs: endocrine disrupting compounds; EE2: 17-alphaethinylestradiol; EEC: European Commission, Council Regulation; Eff: efflent;
GC–MS: gas chromatography–mass spectrometry; H2O: water; HESI: heated
electrospray ionization; HPLC: high performance liquid chromatography; LC:
liquid chromatography; LOQ: quantification limit; MDL: method detection
References
1. Liu ZH, Kanjo Y, Mizutani S (2009) Urinary excretion rates of natural estrogens and androgens from humans, and their occurrence and fate in the
environment: a review. Sci Total Environ 407:4975–4985
2. Diaz-Cruz MS, Lopez de Alda MJ, Lopez R, Barcelo D (2003) Determination
of estrogens and progestogens by mass spectrometric techniques (GC/
MS, LC/MS and LC/MS/MS). J Mass Spect 38:917–923
3. Routledge EJ, Desbrow C, Brighty GC, Waldock M (1998) Identification of
estrogenic chemicals in STW effluent. Chemical fractionation and in vitro
biological screening. Environ Sci Technol 32:1549–1558
4. Purdom CEHP, Bye VJ, Eno NC, Tyler CR, Sumpter JP (1994) Estrogenic
effects of effluents from sewage treatment works. J Chem Ecol 8:275–285
5. Lai KM, Johnson KL, Scrimshaw MD, Lester JN (2000) Binding of waterborne steroid estrogens to solid phases in river and estuarine systems.
Environ Sci Technol 34:3890–3894
6. Johnson AC, Sumpter JP (2001) Removal of endocrine-disrupting
chemicals in activated sludge treatment works. Environ Sci Technol
35:4697–4703
7. Fayad PB, Prévost M, Sauvé S (2010) Laser diode thermal desorption/
atmospheric pressure chemical ionization tandem mass spectrometry
analysis of selected steroid hormones in wastewater: method optimization and application. Anal Chem 82:639–645
8. Fotsis T (1987) The multicomponent analysis of estrogens in urine by ion
exchange chromatography and GC-MS -II. Fractionation and quantitation of the main groups of estrogen conjugates. J Steroid Biochem
28:215–226
9. Orme ML, Back DJ, Breckenridge AM (1983) Clinical pharmacokinetics of
oral contraceptive steroids. Clin Pharmacokin 8:95–136
10. Ternes TA, Kreckel P, Mueller J (1999) Behaviour and occurrence of
estrogens in municipal sewage treatment plants–II. Aerobic batch experiments with activated sludge. Sci Total Environ 225:91–99
11. Ternes TA, Stumpf M, Mueller J, Haberer K, Wilken RD, Servos M (1999)
Behavior and occurrence of estrogens in municipal sewage treatment
Naldi et al. Chemistry Central Journal (2016) 10:30
12.
13.
14.
15.
16.
17.
18.
19.
20.
21.
22.
23.
24.
25.
26.
27.
28.
29.
30.
31.
plants–I. Investigations in Germany, Canada and Brazil. Sci Total Environ
225:81–90
Shore L, Gurevitz M, Shemesh M (1993) Estrogen as an environmental
pollutant. Bull Environ Contam Toxicol 51:361–366
Belfroid AC, Van der Horst A, Vethaak AD, Schafer AJ, Rijs GB, Wegener J
et al (1999) Analysis and occurrence of estrogenic hormones and their
glucuronides in surface water and waste water in The Netherlands. Sci
Total Environ 225:101–108
Johnson AC, Belfroid A, Di Corcia AD (2000) Estimating steroid oestrogen
inputs into activated sludge treatment works and observations on their
removal from the effluent. Sci Total Environ 256:163–173
Baronti C, Curini R, D’Ascenzo G, Di Corcia A, Gentili A, Samperi R (2000)
Monitoring natural and synthetic estrogens at activated sludge sewage
treatment plants and in a receiving river water. Environ Sci Technol
34:5059–5066
Tyler CR, Jobling S, Sumpter JP (1998) Endocrine disruption in wildlife: a
critical review of the evidence. Crit Rev Toxicol 28:319–361
Maggs JL, Grimmer SFM, Orme MLE, Breckenridge AM, Park BK, Gilmore IT
(1983) The biliary and urinary metabolites of [3H]17α-ethynylestradiol in
women. Xenobiotica 13:421–431
Lagoguey M, Dray F, Chauffournier JM, Reinberg A (1972) Circadian and
circannual rhythms of testosterone and epitestosterone glucuronides in
healthy human adults. C R Acad Sci 274:3435–3437
Mouatassim-Souali A, Tamisier-Karolak SL, Perdiz D, Cargouet M, Levi Y
(2003) Validation of a quantitative assay using GC/MS for trace determination of free and conjugated estrogens in environmental water samples. J
Separ Sci 26:105–111
Suri RP, Singh TS, Chimchirian RF (2012) Effect of process conditions on
the analysis of free and conjugated estrogen hormones by solid-phase
extraction-gas chromatography/mass spectrometry (SPE–GC/MS). Environ Monit Assess 184:1657–1669
Huang C-H, Sedlak DL (2001) Analysis of estrogenic hormones in municipal wastewater effluent and surface water using enzyme-linked immunosorbent assay and gas chromatography/tandem mass spectrometry.
Environ Toxicol Chem 20:133–139
Tomšíková H, Aufartová J, Solich P, Nováková L, Sosa-Ferrera Z, SantanaRodríguez JJ (2012) High-sensitivity analysis of female-steroid hormones
in environmental samples. TrAC Trends Anal Chem 34:35–58
Liu ZH, Kanjo Y, Mizutani S (2009) Removal mechanisms for endocrine
disrupting compounds (EDCs) in wastewater treatment—physical
means, biodegradation, and chemical advanced oxidation: a review. Sci
Total Environ 407:731–748
Arndt T, Beyreiß R, Schröfel S, Stemmerich K (2014) Cross-reaction of
propyl and butyl alcohol glucuronides with an ethyl glucuronide enzyme
immunoassay. Forensic Sci Int 241:84–86
Jäntti SE, Tammimäki A, Raattamaa H, Piepponen P, Kostiainen R, Ketola
RA (2010) Determination of steroids and their intact glucuronide conjugates in mouse brain by capillary liquid chromatography–tandem mass
spectrometry. Anal Chem 82:3168–3175
Zwiener C, Frimmel FH (2004) LC-MS analysis in the aquatic environment
and in water treatment technology—a critical review. Part II: applications
for emerging contaminants and related pollutants, microorganisms and
humic acids. Anal Bioanal Chem 378:862–874
Tixier C, Singer HP, Oellers S, Muller SR (2003) Occurrence and fate of
carbamazepine, clofibric acid, diclofenac, ibuprofen, ketoprofen, and
naproxen in surface waters. Environ Sci Technol 37:1061–1068
Segura PA, Gagnon C, Sauvé S (2007) A fully automated on-line preconcentration and liquid chromatography–tandem mass spectrometry
method for the analysis of anti-infectives in wastewaters. Anal Chim Acta
604:147–157
Segura PA, Garcia-Ac A, Lajeunesse A, Ghosh D, Gagnon C, Sauvé S (2007)
Determination of six anti-infectives in wastewater using tandem solidphase extraction and liquid chromatography–tandem mass spectrometry. J Environ Monit 9:307–313
Jordan TB, Nichols DS, Kerr NI (2009) Selection of SPE cartridge for
automated solid-phase extraction of pesticides from water followed by
liquid chromatography–tandem mass spectrometry. Anal Bioanal Chem
394:2257–2266
Oliferova L, Statkus M, Tsysin G, Zolotov Y (2007) On-line solid-phase
extraction and high performance liquid chromatography determination
Page 16 of 17
32.
33.
34.
35.
36.
37.
38.
39.
40.
41.
42.
43.
44.
45.
46.
47.
48.
49.
50.
of polycyclic aromatic hydrocarbons in water using polytetrafluoroethylene capillary. Talanta 72:1386–1391
Garcia-Ac A, Segura PA, Viglino L, Furtos A, Gagnon C, Prévost M et al
(2009) On-line solid-phase extraction of large-volume injections coupled
to liquid chromatography–tandem mass spectrometry for the quantitation and confirmation of 14 selected trace organic contaminants in
drinking and surface water. J Chromatogr A 1216:8518–8527
Garcia-Ac A, Segura PA, Gagnon C, Sauvé S (2009) Determination of
bezafibrate, methotrexate, cyclophosphamide, orlistat and enalapril in
waste and surface waters using on-line solid-phase extraction liquid
chromatography coupled to polarity-switching electrospray tandem
mass spectrometry. J Environ Monit 11:830–838
Viglino L, Aboulfadl K, Mahvelat AD, Prevost M, Sauvé S (2008) On-line
solid phase extraction and liquid chromatography/tandem mass spectrometry to quantify pharmaceuticals, pesticides and some metabolites
in wastewaters, drinking, and surface waters. J Environ Monit 10:482–489
Schilling JB, Cepa SP, Menacherry SD, Bavda LT, Heard BM, Stockwell BL
(1996) Liquid chromatography combined with tandem mass spectrometry for the confirmation of sarafloxacin in catfish tissue. Anal Chem
68:1905–1909
Hennion MC (1999) Solid-phase extraction: method development, sorbents, and coupling with liquid chromatography. J Chromatogr A 856:3–54
Gentili A, Perret D, Marchese S, Mastropasqua R, Curini R, Di Corcia A
(2002) Analysis of free estrogens and their conjugates in sewage and river
waters by solid-phase extraction then liquid chromatography–electrospray–tandem mass spectrometry. Chromatographia 56:25–32
Koh YK, Chiu TY, Boobis A, Cartmell E, Lester JN, Scrimshaw MD (2007)
Determination of steroid estrogens in wastewater by high performance
liquid chromatography–tandem mass spectrometry. J Chromatogr A
1173:81–87
Fayad PB, Prévost M, Sauvé S (2013) On-line solid-phase extraction coupled
to liquid chromatography tandem mass spectrometry optimized for the
analysis of steroid hormones in urban wastewaters. Talanta 115:349–360
Storm T, Hartig C, Reemtsma T, Jekel M (2001) Exact mass measurements
on-line with high-performance liquid chromatography on a quadrupole
mass spectrometer. Anal Chem 73:589–595
Viglino L, Aboulfadl K, Prévost M, Sauvé S (2008) Analysis of natural and
synthetic estrogenic endocrine disruptors in environmental waters
using online preconcentration coupled with LC-APPI-MS/MS. Talanta
76:1088–1096
Tauxe-Wuersch A, De Alencastro LF, Grandjean D, Tarradellas J (2005)
Occurrence of several acidic drugs in sewage treatment plants in Switzerland and risk assessment. Water Res 39:1761–1772
Hogendoom EA, Huls R, Dijkman E, Hoogerbrugge R (2001) Microwave
assisted solvent extraction and coupled-column reversed-phase liquid
chromatography with UV detection use of an analytical restrictedaccess-medium column for the efficient multi-residue analysis of acidic
pesticides in soils. J Chromatogr A 938:23–33
Isobe T, Shiraishi H, Yasuda M, Shinoda A, Suzuki H, Morita M (2003) Determination of estrogens and their conjugates in water using solid-phase
extraction followed by liquid chromatography–tandem mass spectrometry. J Chromatogr A 984:195–202
Isobe T, Serizawa S, Horiguchi T, Shibata Y, Managaki S, Takada H et al
(2006) Horizontal distribution of steroid estrogens in surface sediments in
Tokyo Bay. Environ Pollut 144:632–638
Rodriguez-Mozaz S, Lopez de Alda MJ, Barcelo D (2004) Monitoring of
estrogens, pesticides and bisphenol A in natural waters and drinking
water treatment plants by solid-phase extraction-liquid chromatography–mass spectrometry. J Chromatogr A 1045:85–92
Kuster M, Azevedo DA, Lopez de Alda MJ, Aquino Neto FR, Barcelo D
(2009) Analysis of phytoestrogens, progestogens and estrogens in environmental waters from Rio de Janeiro (Brazil). Environ Int 35:997–1003
USEPA (2011) Appendix B to 40 CFR part 136 of the Federal Register; Code
of Federal Regulations (annual edition). U.S. Government Publishing Office
USEPA (2010) EPA Method 539: Determination of hormones in drinking
water by solid phase extraction (SPE) and liquid chromatography electrospray ionization tandem mass spectrometry (LC–ESI–MS/MS): Office of
Water. 37 p
European Commission. Council Regulation (EEC)—OJEC L 224—Annex
11990
Naldi et al. Chemistry Central Journal (2016) 10:30
51. Lajeunesse A, Gagnon C, Sauvé S (2008) Determination of basic antidepressants and their N-desmethyl metabolites in raw sewage and wastewater using solid-phase extraction and liquid chromatography–tandem
mass spectrometry. Anal Chem 80:5325–5333
52. Garcia-Ac A, Segura PA, Viglino L, Gagnon C, Sauvé S (2011) Comparison of APPI, APCI and ESI for the LC–MS/MS analysis of bezafibrate,
cyclophosphamide, enalapril, methotrexate and orlistat in municipal
wastewater. J Mass Spect 46:383–390
53. Souverain S, Rudaz S, Veuthey J-L (2004) Matrix effect in LC–ESI–MS and
LC–APCI–MS with off-line and on-line extraction procedures. J Chromatogr A 1058:61–66
54. Schuhmacher J, Zimmer D, Tesche F, Pickard V (2003) Matrix effects during analysis of plasma samples by electrospray and atmospheric pressure
chemical ionization mass spectrometry: practical approaches to their
elimination. Rapid Commun Mass Sp 17:1950–1957
55. Kloepfer A, Jekel M, Reemtsma T (2005) Occurrence, sources, and fate of
benzothiazoles in municipal wastewater treatment plants. Environ Sci
Technol 39:3792–3798
Page 17 of 17
56. Hummel D, Loffler D, Fink G, Ternes TA (2006) Simultaneous determination of psychoactive drugs and their metabolites in aqueous matrices
by liquid chromatography mass Spectrometry. Environ Sci Technol
40:7321–7328
57. D’Ascenzo G, Di Corcia A, Gentili A, Mancini R, Mastropasqua R, Nazzari
M et al (2003) Fate of natural estrogen conjugates in municipal sewage
transport and treatment facilities. Sci Total Environ 302:199–209
58. Labadie P, Hill EM (2007) Analysis of estrogens in river sediments by liquid
chromatography–electrospray ionisation mass spectrometry: comparison of tandem mass spectrometry and time-of-flight mass spectrometry.
J Chromatogr A 1141:174–181
59. Zhang H, Henion J (1999) Quantitative and qualitative determination
of estrogen sulfates in human urine by liquid chromatography/tandem
mass spectrometry using 96-well technology. Anal Chem 71:3955–3964