The octanol/water distribution coefficients of ardipusilloside-I and its metabolites, and their permeation characteristics across Caco-2 cell monolayer
Bạn đang xem bản rút gọn của tài liệu. Xem và tải ngay bản đầy đủ của tài liệu tại đây (768 KB, 8 trang )
Cao et al. Chemistry Central Journal (2016) 10:29
DOI 10.1186/s13065-016-0175-y
Open Access
RESEARCH ARTICLE
The octanol/water distribution
coefficients of ardipusilloside‑I and its
metabolites, and their permeation
characteristics across Caco‑2 cell monolayer
Wei‑yu Cao, Bin Feng, Li‑fei Cheng, Ying Wang, Ji Wang and Xiao‑juan Wang*
Abstract
Background: Ardipusilloside-I (ADS-I) is a triterpenoid saponin extracted from Chinese medicinal herb Ardisiapusill
A. DC. Previous studies have demonstrated the potent anti-tumor activities of ADS-I both in vitro and in vivo, and its
main metabolites (M1 and M2) from human intestinal bacteria. However, the physicochemical properties and intes‑
tinal permeation rate of ADS-I and its metabolites are not understood. In this study, the octanol/water distribution
coefficients (logP) of ADS-I and metabolites were investigated using standard shake flask technique, and their perme‑
ability properties was investigated across Caco-2 cells monolayer.
Results: The logP of ADS-I, M1 and M2 was −0.01, 0.95 ± 0.04, 1.57 ± 0.11, respectively. The Papp values of ADSI, M1 and M2 (in 10 μmol/L) across Caco-2 cell monolayers from the apical (AP) to basolateral (BL) direction were
1.88 ± 0.21 × 10⁻⁶ cm·s−1, 4.30 ± 0.43 × 10⁻⁶ cm·s−1, 4.74 ± 0.47 × 10⁻⁶ cm·s−1, respectively.
Conclusion: Our data indicated that ADS-I has the poorer intestinal absorption than its metabolites (M1 and M2) in
these experimental systems, suggesting that the metabolites of ADS-I may be the predominant products absorbed by
the intestine when ADS-I is administered orally.
Keywords: Ardipusilloside-I, Metabolites, LogP, Caco-2 cell monolayers, Intestinal absorption
Background
Ardipusilloside-I (ADS-I) [1] is a major bioactive triterpenoid saponin isolated from Chinese medicinal herb
Ardisiapusill A. DC (Mysinaceae). The anti-tumor activity of this compound was first reported by Dr. Wang’s
group [2], followed by many preclinical studies, showing that ADS-I induces tumor cell apoptosis and inhibits
tumor cell growth, invasion and metastasis both in vitro
and in vivo [3–6]. Pharmacokinetic study of ADS-I in
rats shows that this compound has a poor intestinal
absorption and the oral bioavailability [7]. Recently, we
*Correspondence:
State Key Laboratory of Military Stomatology & National Clinical
Research Center for Oral Diseases & Shaanxi Engineering Research
Center for Dental Materials and Advanced Manufacture, Department
of Pharmacy, School of Stomatology, The Fourth Military Medical
University, Xi’an 710032, Shaanxi, China
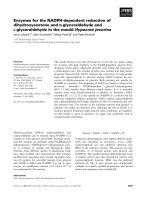
have shown that ADS-I could be mainly metabolized by
human intestinal bacteria to metabolite M1 and M2 as
shown in Fig. 1, in which the main metabolic pathway is
deglycosylation of ADS-I through stepwise cleavage of
sugar moieties [8]. These findings imply that these metabolites of ADS-I may be the primary active substances for
its inhibitory activity against the growth of the tumor
in vivo after oral administration, which however remains
unknown. It has been known that the biological activities
of drugs depend not only on their chemical structures,
but also on their degree of lipophilic and membrane permeation that facilitate them across the cell membrane [9].
Although a previous study has revealed the poor intestinal absorption as well as a low oral bioavailability of
ADS-I [7], the oral pharmacokinetic properties of ADS-I
and its metabolites in humans have not investigated of
yet. Evidence in literature indicates that deglycosylation
© 2016 The Author(s) This article is distributed under the terms of the Creative Commons Attribution 4.0 International License
( which permits unrestricted use, distribution, and reproduction in any medium,
provided you give appropriate credit to the original author(s) and the source, provide a link to the Creative Commons license,
and indicate if changes were made. The Creative Commons Public Domain Dedication waiver ( />publicdomain/zero/1.0/) applies to the data made available in this article, unless otherwise stated.
Cao et al. Chemistry Central Journal (2016) 10:29
Page 2 of 8
M1
CHO
ADS-I
O
O
OH
OH
O
OH
OH
OH
CH3
O
O
OH OH
O
OH
O
O
OH
O
O
OH
OH
OH
OH
O
OH
C53H86O22
(MW 1074)
OH
OH
CH3
O
M2
CHO
O
OH
O
OH
O
O
O
OH
O
OH
OH
C47H76O17
(MW 912)
OH
OH
CHO
OH
O
OH
O
O
OH
C41H66O13
(MW 766)
OH OH
Fig. 1 Chemical structures of ADS-I and its metabolites (M1, M2)
of ginsenoside by intestinal bacteria to deglycosylated
metabolites results in enhancing the permeability of the
intestine, better adsorption into systemic circulation
and exerting pharmacological effects of the ginsenoside
[10–12]. Thus, we speculated that the deglycosylation
of ADS-I to the metabolites (M1 and M2) might mediate the intestinal absorption of ADS-1 for increased oral
bioavailability.
Lipophilicity, commonly expressed as octanol/water
distribution coefficient (log P), has been considered as
one important measurement of drug physicochemical parameters in drug discovery process to predict the
pharmacokinetic properties and intestinal absorption of
a drug [13, 14]. Caco-2 cell monolayer has been widely
accepted as a standard in vitro model for prediction of
drug absorption across human intestine and for mechanistic studies of intestinal drug transport since these cells
show morphological and functional similarities to human
small intestinal epithelial cells [15–17]. The objective of
this study was designed to measure the logP of ADS-I
and its metabolites using standard shake flask technique,
and their permeability properties using Caco-2 cells
monolayer. Thus, we could determine whether the products of ADS-I biotransformation by human intestinal
bacteria played a role in the membrane permeability of
ADS-I in human intestine.
Results and discussion
LogP of ADS‑I and its metabolites in octanol/water
The LogP of ADS-I and its metabolites were determined by using standard shake flask method and HPLCELSD technique. The logarithm of logP values of ADS-I
and its metabolites were shown in Table 1, indicating
that the logP values of ADS-I, M1 and M2 were −0.01,
0.95 ± 0.04, 1.57 ± 0.11 respectively. According to a
previous study [18], the value of logP from one to three
Table
1 The octanol/water partition coefficients (logP)
of ADS-I and its metabolites in phosphate-buffers (pH = 7.4)
ADS-I and its metabolites
MW (g/mol)
ADS-I
1074
Log P (Mean ± SD)
−0.01
M1
912
0.95 ± 0.04
M2
766
1.57 ± 0.11
Date are presented as mean ± SD (n = 3)
suggests that the drug is easily absorbed by the intestine,
and below zero poorly absorbed. Thus, our experiment
results indicated that ADS-I was difficult or less to be
absorbed, whereas M2 had the highest absorption. Furthermore, the data also showed that there was a correlation between molecular weight and lipophilicity of ADS-I
and its metabolites. As a matter of fact, the absorption
extent of these three compounds was negatively correlated with their molecular polarity and molecular weight.
Indeed, the larger the molecular polarity and molecular
weight of a compound, the more difficultly it is absorbed
[19, 20]. ADS-I has the highest polarity and molecular
weight compared to M1 and M2, the lower logP value of
ADS-I suggests that this compound has a poor absorption in human intestine after oral administration. These
results were in agreement with the low oral bioavailability of ADS-I in rats as reported previously [7], and may
suggest that these metabolites may have better absorption than ADS-I.
The permeation characteristics of ADS‑I and its
metabolites across Caco‑2 cell monolayer
Cytotoxicity assay
The viability of cells was measured using MTT assay to
evaluate the cytotoxicity of ADS-I and its metabolites
(M1, M2) in Caco-2 cells prior to transport experiments.
Cao et al. Chemistry Central Journal (2016) 10:29
Generally, cell viability of more than 90 % indicated that
the compounds at the stated concentrations were nontoxic to the cells [21]. As shown in Fig. 2, ADS-I, M1 and
M2 at 0–10 µmol/L were nontoxic to the Caco-2 cells
after incubation for 4 h. Therefore, 2, 5 and 10 µmol/L
of each compound was used for two-way transport
experiments.
Characters of Caco‑2 cell monolayer
In order to confirm if the cells in culture formed a monolayer, the TEER values of the Caco-2 cell monolayer were
measured at 5, 7, 9, 13, 17, 21 days after seeding, respectively. As shown in Fig. 3, the Caco-2 cell monolayer was
completely formed on day 21 with TEER values above
400 Ω cm2 and was used for the transport experiments.
Fig. 2 Cytotoxicity of ADS-I, M1 and M2 on Caco-2 cell monolayers
using the MTT assay. Data are expressed as mean ± SD (n = 3)
Fig. 3 TEER values of Caco-2 cell monolayers at different time points.
Data are represented as mean ± SD (n = 3)
Page 3 of 8
In addition, electron microscope revealed the intact tight
junctions in the Caco-2 cell monolayer (Fig. 4). Thus, the
Caco-2 cell monolayer model established herein was validated for the permeation experiment.
Two‑way transport of ADS‑I and its metabolites
across Caco‑2 cell monolayer
The permeability change of ADS-I, M1, or M2 across
the Caco-2 cell monolayer at different concentrations
from AP to BL direction was shown in Fig. 5, and the
accumulated transfer amounts of ADS-I, M1 or M2
increased with a prolonged time of incubation as illustrated in Fig. 5a–c. With the same concentration, the flux
amounts of M1 and M2 in AP to BL direction were similar, and both were greater than that of ADS-I (Fig. 5d).
As shown in Fig. 6, the Papp value of ADS-I (10 µmol/L)
was 1.88 ± 0.21 × 10⁻⁶ cm·s−1 for AP to BL direction,
and was 0.69 ± 0.15 × 10⁻⁶ cm·s−1 for BL to AP direction in 120 min, which was considered to have a poor
permeability and absorption rate similar to in vivo [7].
However, with stepwise removal of glycosyl groups in
the metabolites (M1 and M2), the Papp values of these
compounds increased and were higher than those of
ADS-I across the Caco-2 cell monolayer in both directions. The Papp values of M1 (10 µmol/L) in the direction
of AP - BL and BL - AP were 4.30 ± 0.43 × 10⁻⁶ cm·s−1
and 1.76 ± 0.26 × 10⁻⁶ cm·s−1 respectively, and of
M2 (10 µmol/L) were 4.74 ± 0.47 × 10⁻⁶ cm·s−1 and
2.12 ± 0.23 × 10⁻⁶ cm·s−1 respectively. These data suggested that metabolites M1 and M2 were easier to be
absorbed than ADS-I by the intestine.
The Papp values of ADS-I, M1 or M2 at different concentrations across the Caco-2 cell monolayer in both
directions were shown in Table 2, indicating that the
Papp values of these compounds gradually decreased with
the increase of their concentration respectively. According to the formula (“The two-way transport experiment”
section), the transport amounts of ΔQ increased along
with Δt at the same concentration (C0), but the increased
speed of ΔQ became slower along with the Δt, which
meant that the value of ΔQ/Δt relatively decreased,
thus the apparent permeability coefficient (Papp) was
also reduced. We inferred that the transport of ADS-I,
M1 and M2 across the Caco-2 cell monolayer partially
depend on their concentration, and some carrier might
participate in the process of transportation. Besides,the
Papp values of ADS-I and its metabolites (M1 and M2)
in AP to BL direction were greater than that in BL to
AP direction across the Caco-2 cell monolayer, and
efflux ratio (ER) were all 0.3–0.6. These data suggested
that ADS-I and its metabolites (M1 and M2) could be
absorbed across intestinal epithelial cells in a passive
absorption pattern, and the transport processes of these
Cao et al. Chemistry Central Journal (2016) 10:29
Page 4 of 8
Fig. 4 Caco-2 cell morphology, a the 2nd day; b the 7th day; c the 21st day
Fig. 5 Change of accumulated amount of a different concentrations of ADS-I, b different concentration of M1, c different concentration of M2, d
ADS-I, M1, M2 (10 µmol/L) across Caco-2 cell monolayer from AP to BL direction. Date represent the mean ± SD from three replicates
Cao et al. Chemistry Central Journal (2016) 10:29
Page 5 of 8
Structure‑intestinal permeability relationship
Fig. 6 The Papp values of ADS-I, M1 and M2 (10 μmol/L) across Caco-2
cell monolayer from AP to BL direction and vice versa in 120 min.
Date are presented as mean ± SD (n = 3). **P < 0.01 compared to the
control group (ADS-I)
Physicochemical characters, such as log P, log D and
polar surface area, are generally measured for the prediction of drug permeability. To study the structure-intestinal permeability relationship, Papp values of ADS-I and its
metabolites (M1 and M2) across Caco-2 cell monolayer
were compared with their logP and molecular weight. In
Fig. 7a, the Papp values of ADS-I and its metabolites (M1
and M2) transported from apical to basolateral direction
(C0 10 μM) were plotted as a function of their molecular weight, with stepwise removal of glycosyl groups in
the metabolites (M1 and M2), the Papp values of these
compounds increased and were higher than the parent
compound ADS-I. Figure 7b showed the relationship
between Papp and logP of ADS-I and its metabolites (M1
and M2), the Papp (AP to BL direction) values increased
with an increase of LogP. These findings indicated that
ADS-I and its metabolites (M1 and M2) across Caco-2
cell monolayer were well correlated with their logP and
Table 2 The Papp values of ADS-I, M1 and M2 at different
concentrations across the Caco-2 cell monolayer in both
directions in 120 min
Compound
ADS-I
M1
M2
Concentration
(µmol/L)
Papp/× 10−6 cm·s−1
AP → BL
BL → AP
Efflux
ratio
2
6.66 ± 1.32
2.50 ± 0.53
0.38
5
3.10 ± 0.33
1.66 ± 0.24
0.54
10
1.88 ± 0.21
0.69 ± 0.15
0.37
2
9.13** ± 1.65
3.14** ± 0.58
0.34
5
6.07** ± 0.74
3.45** ± 0.67
0.57
**
10
4.30 ± 0.43
1.76** ± 0.26
0.41
2
10.48** ± 1.21
4.53** ± 0.57
0.43
5
6.76** ± 0.85
2.60** ± 0.43
0.38
10
4.74** ± 0.47
2.12** ± 0.23
0.45
Date are presented as mean ± SD (n = 3).
**
P < 0.01 compared to control group (ADS-I)
compounds might not be the substrate of apical efflux
transporters.
It has been known that compounds with Papp values less than 2.0 × 10⁻⁶ cm·s−1 are considered to have
a low absorption (0–20 %), while those with Papp values
between 2.0 × 10⁻⁶ cm·s−1 and 10 × 10−6 cm·s−1 are
considered to have a moderate absorption (20−70 %), and
those with Papp values of higher than 10 × 10−6 cm·s−1
are considered to have a high absorption (70–100 %) [22].
In this study, the transport of the major metabolites (M1,
M2) of ADS-I was compared with the parent compound
ADS-I in the same system, and showed that ADS-I is a
poorly absorbed compound, M1 and M2 belong to the
moderately absorbed compound.
Fig. 7 The apparent permeability (Papp) vs. molecular weight (a), and
logP (b) of ADS-I, M1 and M2 from the apical to basolateral direction
across Caco-2 cell monolayer. Values are represents mean ± SD
(n = 3)
Cao et al. Chemistry Central Journal (2016) 10:29
molecular weight, and metabolites M1 and M2 exhibited
higher permeability absorption than ADS-I.
Conclusion
In this study, the octanol/water distribution coefficients
(logP) and membrane permeability properties of ADS-I
and its metabolites (M1, M2) were investigated to predict their intestinal absorption in human. Our data suggest that ADS-I has a poor intestinal absorption in
human after oral administration. Metabolites (M1, M2)
of ADS-I, biotransformed by human intestinal bacteria,
exhibited a moderate absorption as well as higher permeability than ADS-I in the following decreasing order:
M2 > M1 > ADS-I. These results may suggest that these
metabolites may have better absorption than ADS-I, and
thus could be the major substances in vivo for inhibitory
activities against the growth of tumor after oral administration of ADS-I. In summary, the present results provide
useful information to predict the oral bioavailability of
ADS-I and its metabolites for the further clinical studies
of ADS-I.
Methods
Chemicals and reagents
ADS-I and its metabolites M1, M2 (purity > 95 %)
were provided by Dr. X.-J. Wang at the Department
of Pharmacy, School of Stomatology, the Fourth Military Medical University (Xi’an, China). Ginsenoside
Re (purity > 93.7 %) was purchased from the National
Institute for Food and Drug Control (Beijing, China),
6-well-Transwell plates (insert diameter 24 mm, pore size
0.4 μm, membrane growth area 4.67 cm2) and 96-well
plates from Corning Costar (Cambridge, MA, USA),
Millicell-ERS system from Millipore Corporation (Bedford, OH, USA), Dulbecco’s Modified Eagle’s medium
(DMEM) and fetal bovine serum (FBS) from HyClone
Laboratories (Logan, UT, USA), HPLC grade acetonitrile and methanol from Fisher Scientific (Pittsburgh, PA,
USA), and Penicillin–streptomycin and 0.25 % trypsin–
EDTA solutions from Solarbio (Beijing, China). Other
reagents were of analytical purity.
Determination of Log P of ADS‑I metabolites by HPLC–
ELSD
HPLC–ELSD instrumentation and chromatographic
conditions
ADS-I and its metabolites (M1, M2) concentrations in
two phases were quantified using a LC-20A high performance liquid chromatograph (Shimadzu Corporation,
Kyoto, Japan) equipped with a Alltech type 3300 evaporative light-scattering detector (Alltech Associates, Deerfield, USA). A Diamonsil C18 (2) column (4.6 × 250 mm,
5 µm) from Diamonsil Technologies (Beijing, China)
Page 6 of 8
was used for all the compound separations, and the column temperature was maintained at 25 °C. The mobile
phase consisted of 25 % (A) ultra-pure water and 75 %
(B) methanol using an isocratic elution. The flow rate was
1 mL/min, and the injection volume was 10 µl. The ELSD
was set to a probe temperature at 60 °C, a gain of 1 and
the nebulizer gas nitrogen at a flow of 2.0 L/min.
The liner regression equation for ADS-I was
y = 1.9726 x + 4.6654 (r = 0.9995), with a good linearity over the range from 0.1002 to 0.9018 mg/mL,
y = 1.8255x + 4.8093 (r = 0.9993) for M1 with a good
linearity over the range from 0.1018 to 0.9162 mg/mL,
and y = 1.8006x + 4.8211 (r = 0.9992) for M2 with a
good linearity over the range from 0.1010 to 0.9090 mg/
mL.
LogP of ADS‑I and its metabolites with a shake flask method
[23, 24]
Prior to the distribution experiment, octanol and phosphate buffer (10 mM, PH 7.4) were mutually saturated at
room temperature. ADS-I and its metabolites (M1, M2)
were dissolved in DMSO at final concentration of 20 mg/
mL, and a volume of 50 µL compound in DMSO solution was added to the octanol/phosphate buffer (1:1, v/v)
system. After vortex mixing, the mixtures were orbital
shaken for 48 h at 37 °C, and consequently the phases
were separated. The solution with two phases were then
centrifuged at 13,000 rpm min−1 for 10 min. The concentration of ADS-I and metabolites (M1, M2) in both the
phosphate buffer and n-octanol after the shaking was
determined by using HPLC-ELSD as described above.
Data analysis
The experiments measured logP was calculated using the
following equation: log P = log Co Cw where Co was the
concentration of a compound in the n-octanol phase, Cw
is the concentration of the compound in the phosphate
buffer phase.
The permeation characteristics of ADS‑I and its
metabolites across Caco‑2 cell monolayer
Cell culture
The human colon Caco-2 cells were purchased from the
Cell Bank of the Chinese Academy of Sciences (Shanghai, China), and were cultured in DMEM with 10 % FBS
(inactivation at 56 °C for 30 min), 1 % NEAA and 1 %
antibiotics (100 IU/ml penicillin and 100 µg/ml streptomycin in a humidified atmosphere of 5 % CO2 at 37 °C.
Cytotoxicity assay
The cytotoxicity of ADS-I and its metabolites (M1, M2)
against Caco-2 cells was evaluated by MTT assay. In
brief, 100 µL of Caco-2 cell suspension (2 × 10⁴ cells/mL)
Cao et al. Chemistry Central Journal (2016) 10:29
per well was seeded in 96-well plates, followed by 24 h
incubation (37 °C, 5 % CO2). ADS-I and its metabolites
(M1, M2) were dissolved in DMSO (<1 ‰) and diluted
in DMEM, A volume of 100 µL compounds solution
were added to each well and made the final concentrations were 5, 10, 20, 50, 100 µM, respectively. After 4 h
incubation, 20 μL of 5 mg/mL MTT was added to each
well and incubated for another 4 h. Then the medium was
removed and cells were dissolved in 150 µl DMSO with
gentle shaking for 10 min, and the optical density (OD)
was measured with an ELX800 reader (Bio-Tek instruments, Inc., Winooski, VT, USA) at 490 nm. Untreated
cells were used as controls. The doses of a compound
with survival rate higher than 90 % were considered
non-cytotoxicity.
The two‑way transport experiment
For transport experiments,Caco-2 cells were seeded
on the rat tail collagen-coated 6-wells Transwell plates
(insert diameter 24 mm, pore size 0.4 μm, membrane
growth area 4.67 cm2) at a density of 1 × 10⁵ cells/cm2
and incubated for 19–21 days. The medium was changed
every 2 days. The integrity and transportation ability of
the Caco-2 cell monolayer was examined by measuring the transepithelial electrical resistance (TEER) of
filter-grown cell monolayer with millicell-ERS equipment. Only a monolayer with a TEER value of more than
400 Ω cm2 was used for the trans epithelial transport
experiments.
The transport of ADS-I and its metabolites across
Caco-2 monolayer was investigated as previously
described [25, 26]. Before the transport experiment,
cells were washed three times with warm HBSS (pH 7.4,
37 °C). Cell monolayer was then incubated for 30 min at
37 °C in the transport buffer. To measure the apical (AP)to-basolated (BL) permeability, 0.5 mL of the transport
buffer containing different concentrations (2, 5, 10 µM)
of ADS-I, M1, or M2 was added to AP side of the transwell insert, and 1.5 mL of the HBSS was added to the BL
chamber. The plates were incubated in an orbital shaker
at 37 °C, 50 rpm/min. To assess the drugs transport from
AP to BL, after incubation for 30, 60, 90 or 120 min, a
volume of 200 μL aliquot was collected from BL side, followed by immediately being replenished with an equal
volume of blank HBSS. For the measurement of BL to AP
transport, 1.5 mL of the transport buffer containing different concentrations (2, 5, 10 µM) of ADS-I, M1, or M2
was added to the BL side, and 0.5 mL of the HBSS to AP
side. A volume of 200 μL aliquot was harvested from AP
side at time intervals of 30, 60, 90 and 120 min respectively, and immediately replaced with the same volume of
blank HBSS. The samples were frozen immediately and
stored at −80 °C before analysis by UHPLC–MS.
Page 7 of 8
In the Caco-2 cell model, the rate of transport was calculated based on the amount transported vs. time curve
using linear regression. The apparent permeability (Papp)
presented as an expression of the absorption rate constant was calculated using the following equation,
Papp =
Q
t A × C0
where Papp was the apparent permeability coefficient
(cm/s), ΔQ/Δt (µmol/s) represented the appearance rate
of the test compound on the receiver side, A (4.67 cm2) is
the surface area of the filter membrane and C0 (µmol/L)
was the initial concentration in the donor chamber.
The efflux ratio (Re) was determined by calculating the
ratio of Papp (B−A) versus Papp (A−B) as the following
equation,
Re = Papp (B−A) Papp (A−B)
Sample preparation for UHPLC–ESI–MS/MS assay
A sample (200 μL) from either cellular absorption or
transport experiments was mixed with 20 μL methanol containing the internal standard (ginsenoside Re,
0.498 μg/ml). The mixture was vortexed for 60 s. Then
after centrifugation at 10,000×g for 10 min, 5 μL of
supernatant was then injected into the LC/MS system.
Also, 200 μL of standard solutions containing different
concentrations of ADS-I, M1 or M2 was processed in the
same way as above. The calibration curves for ADS-I, M1
or M2 were generated by plotting the peak area ratios of
the analytes to the internal standard versus the concentrations by least-square linear regression.
UHPLC–MS analysis
UHPLC-MS analysis was performed using an Agilent
1290 Infinity ultra-high performance liquid chromatography (UHPLC) and 6460 type triple quadrupole
(QQQ) mass spectrometer equipped with electrospray
ion source (ESI) and Mass Hunter working software version B.04.10 (Agilent Technologies, California, USA). A
Poroshell 120 EC C18 column (2.1 × 100 mm, 2.7 µm)
from Agilent Technologies was used as an analytical
column and the column temperature was maintained
at 25 °C. The isocratic mobile phase consisted of 40 %
acetonitrile and 60 % H2O at a flow rate of 0.4 mL/min.
Quantification was determined using multiple reactions
monitoring model, and the operating parameters were
optimized as follows: drying gas (N2) flow rate, 10.0 L/
min; drying gas temperature, 350 °C; nebulizer, 45 psi;
capillary, 3500 V; fragmentor voltage, 150 V; sheath gas
temperature, 350 °C; sheath gas flow rate, 11 L/min. The
precursor-product ion pairs used in MRM mode were:
m/z 1073.5 → 927.3 for ADS-I, m/z 911.3 → 765.4 for
M1, m/z 765.4 → 603.1 for M2, 945.5 → 475.3 for Ginsenoside Re as an internal standard.
Cao et al. Chemistry Central Journal (2016) 10:29
Page 8 of 8
The sensitivity of UHPLC-MS/MS analysis was
first evaluated for drug quantification. The regression equation for the standard curve were as follow:
y = 1.7226x + 0.1239 (r = 0.9995) for ADS-I with the
range of 0.061–0.980 μg/mL and the lower limit of quantification was 10 ng/mL; y = 1.4379x + 0.0417 (r = 0.9993)
for M1 with the range of 0.064–1.020 μg/mL and
the lower limit of quantification was 8 ng/mL;
y = 1.2802x + 0.0579 (r = 0.9987) for M2 with the range
of 0.063–1.000 μg/mL and the lower limit of quantification was 6 ng/mL.
8.
Statistical analysis
13.
Data were expressed as means ± standard derivation
(SD). Statistical analysis was performed using the statistical software SPSS16.0 (SPSS Inc., Chicago, IL, USA).
Student’s t test was used to analyze statistical differences
between groups. P < 0.05 was considered statistically
significant.
Authors’ contributions
XJW and BF conceived and designed the experiments; WYC, LFC, YW and JW
performed the experiments and helped with the data analysis; and WYC, BF
and XJW wrote the paper. All authors read and approved the final manuscript.
9.
10.
11.
12.
14.
15.
16.
17.
Acknowledgements
This work was supported by Shaanxi Province Administration of Traditional
Chinese Medicine Foundation of China (No.13-ZY041).
18.
Competing interests
The authors declare that they have no competing interests.
19.
Received: 3 March 2016 Accepted: 26 April 2016
20.
References
1. Zhang QH, Wang XJ, Miu ZC, Feng R (1993) Chemical research on ardipu‑
silloside. Acta Pharm. Sin 28:673–678
2. Liang KM, Wang SW, Wang XJ (2001) Inhibitory effect on of ardipusilloside
on human cancer cell line. J Forth Mil Med Univ 22:671–672
3. Xiong Jian, Cheng Guang, Tang Hai-Feng, Zhen Hai-ning, Zhang Xiang
(2009) Ardipusilloside I induces apoptosis in human glioblastoma cells
through a caspase-8-independent FasL/Fas-signaling pathway. J Envir
Toxicol Pharmacol 27:264–270
4. Zhang Yan-min, You-le Qu, Zhang Jie, Xiao-juan W (2010) Ardipusilloside
I purified from Ardisia pusilla competitively binds VEGFR and induces
apoptosis in NCI-H460 cells. Phytomedicine 17:519–526
5. Lou Lian-qing, Ye Wei-wei, Chen Yong-xin, Shuang Wu, Jin Lin-zheng, He
Jin-ke, Tao Xing-fei, Zhu Jing-hong, Chen Xiang-yi, Deng An-mei, Wang
Jin-he (2012) Ardipusilloside inhibits survival, invasion and metastasis of
human hepatocellular carcinoma cells. Phytomedicine 19:603–608
6. Tao XJ, Wang PX, Yang XJ, Yao HP, Liu J, Cao YS (2005) Inhibitory effect of
Ardipusilloside-I on Lewis pulmonary carcinoma and hepatocarcinoma
SMMC-7721. J Chin Med Mater 28:574–577
7. Wang XJ, Cui H, Wang R, Huan ML, Zhang BL, Zhang WD, Teng ZH, Gan
HQ, Zhou SY, Gu Y (2012) Metabolism and pharmacokinetic study of
Ardipusilloside I in rats. Planta Med 78:565–574
21.
22.
23.
24.
25.
26.
Cao Wei-Yu, Wang Ya-Nan, Wang Peng-Yuan, Lei Wan, Feng Bin, Wang
Xiao-juan (2015) Ardipusilloside-I metabolites from human intestinal
bacteria and their antitumor activity. Molecules 20:20569–20581
Soumyajit M, Sridhar D, Ashim KM (2004) Membrane transporter/recep‑
tor-targeted prodrug design: strategies for human and veterinary drug
development. Adv Drug Delivery Rev 56:1437–1452
Odani T, Tanizawa H, Takino Y (1983) Studies on the absorption, distribu‑
tion, excretion and metabolism of Ginseng saponins. IV. Decomposition of
ginsenoside-Rg1 and Rb1 in the digestive tract of rats. Chem Pharm Bull
31:3691–3697
Qian T, Jiang ZH, Cai ZW (2006) High-performance liquid chromatograph
coupled with tandem mass spectrometry applied for metabolic study of
ginsenoside Rb1 on rats. Anal Biochem 352:87–96
Ruan Jian-Qing, Weng-im Leong Ru, Yan Yi-tao Wang (2010) Characteriza‑
tion of metabolism and in vitro permeability study of notoginsenoside R1
from Radix notoginseng. J Agric Food Chem 58:5770–5776
Tetko Igor V, Varbanov Hristo P, Galanski Markus, Talmaciu Mona, Platts
James A, Ravera Mauro, Gabano Elisabetta (2016) Prediction of logP for
Pt(II) and Pt(IV) complexes: comparison of statistical and quantum-chem‑
istry based approaches. J Inorg Biochem 156:1–13
Pienko Tomasz, Grudzien Monika, Taciak Przemysław Paweł, Mazurek Alek‑
sander Paweł (2016) Cytisine basicity, solvation, log P, and log D theoreti‑
cal determinationas tool for bioavailability prediction. J Mol Graph Model
63:15–21
Pinto M, Robine-Leon S, Appay MD, Kedinger M, Triadou N, Dussaulx
E, Lacroix B, Simon-Assmann P, Haffen K, Fogh J, Zweibaum A (1983)
Enterocyte-like differentiation and polarization of the human colon
carcinoma cell line Caco-2 in culture. Biol Cell 47:323–330
Grasset E, Pinto M, Dussaulx E, Zweibaum A, Desjeux JF (1984) Epithelial
properties of human colonic carcinoma cell line Caco-2: electrical param‑
eters. Am J Physiol 247:260–267
Borlak J, Zwadlo C (2005) Expression of drug- metabolizing enzymes,
nuclear transcription factors and ABC transporters in Caco-2 cells. Xeno‑
biotica 33:927–943
Lin JZ, Zou L, Fu CM, Zhang DK, Wang P, Qin L (2013) Octanol/water parti‑
tion coefficient and absorption kinetics of salidroside and tyrosol in rat
intestine. Chin Tradi Pat Med 35:483–486
Yang Yan-Fang, Wei Xu, Song Wei, Ye Min, Yang Xiu-Wei (2015) Transport
of twelve coumarins from Angelicae Pubescentis Radix across a MDCKpHaMDR cell monolayer-an in vitro model for blood-brain barrier perme‑
ability. Molecules 20:11719–11732
Yang XW, Huang X, Ma L, Wu Q, Xu W (2010) The intestinal permeability
of neolignans from the seeds of Myristica fragrans in the Caco-2 cell
monolayer model. Planta Med 76:1587–1591
Wahlang B, Pawar YB, Bansal AK (2011) Identification of permeabilityrelated hurdles in oral delivery of curcumin using the Caco-2 cell model.
Eur J Pharm Biopharm 77:275–282
Gao J, HuggerE D, Beck-Westermeyer MS (2000) Current protocols in
pharmacology estimation of intestinal mucosal permeation of com‑
pounds using Caco-2 cell monolayers. John Wiley Sons Inc, New York
Heshmati Nasim, Wagner B, Cheng X, Schol T, Kansy M, Eisenbrand G, Fric‑
ker G (2013) Physicochemical characterization and in vitro permeation of
an indirubin derivative. Europ J Pharm Sci 50:467–475
Morikawa Go, Suzuka Chihiro, Shoji Atsushi, Shibusawa Yoichi, Yanagida
Akio (2016) High-throughput determination of octanol/water partition
coefficients using a shake-flask method and novel two-phase solvent
system. J PharmBiomed Anal 117:338–344
Zheng Mengkai, Zhou Huifen, Wan Haitong, Yu-Lin C, H Y (2015) Effects
of herbal drugs in Mahuang decoction and their main components on
intestinal transport characteristics of Ephedra alkaloids evaluated by a
Caco-2 cell monolayer model. J Ethnopharmacol 164:22–29
Liu L, Guo L, Zhao C, Wu X, Wang R, Liu C (2015) Characterization of the
intestinal absorption of seven flavonoids from the flowers of Trollius
chinensis using the Caco-2 cell monolayer model. PLoS One 19(3):1–18