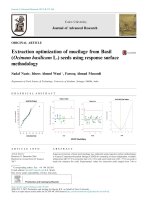
Optimization and in vitro antiproliferation of Curcuma wenyujin’s active extracts by ultrasonication and response surface methodology
Bạn đang xem bản rút gọn của tài liệu. Xem và tải ngay bản đầy đủ của tài liệu tại đây (5.67 MB, 14 trang )
Wang et al. Chemistry Central Journal (2016) 10:32
DOI 10.1186/s13065-016-0177-9
RESEARCH ARTICLE
Open Access
Optimization and in vitro
antiproliferation of Curcuma wenyujin’s active
extracts by ultrasonication and response surface
methodology
Xiaoqin Wang, Ying Jiang and Daode Hu*
Abstract
Background: Curcuma wenyujin, a member of the genus Curcuma, has been widely prescribed for anti-cancer
therapy. Multiple response surface optimization has attracted a great attention, while, the research about optimizing
three or more responses employing response surface methodology (RSM) was very few.
Results: RSM and desirability function (DF) were employed to get the optimum ultrasonic extraction parameters, in
which the extraction yields of curdione, furanodienone, curcumol and germacrone from C. wenyujin were maximum.
The yields in the extract were accurately quantified using the validated high performance liquid chromatography
method with a good precision and accuracy. The optimization results indicated that the maximum combined desirability 97.1 % was achieved at conditions as follows: liquid–solid ratio, 8 mL g−1; ethanol concentration, 70 % and
ultrasonic time, 20 min. The extraction yields gained from three verification experiments were in fine agreement with
those of the model’s predictions. The surface morphologies of the sonication-treated C. wenyujin were loose and
rough. The extract of C. wenyujin presented obvious antiproliferative activities against RKO and HT-29 cells in vitro.
Conclusion: Response surface methodology was successfully applied to model and optimize the ultrasonic extraction of four bioactive components from C. wenyujin for antiproliferative activitiy.
Keywords: Ultrasonic extraction, Response surface methodology, Curcuma wenyujin, High performance liquid
chromatography, Antiproliferative activity
Background
Rhizoma Curcumae, a number of the genus Curcuma,
is cultivated in tropical and subtropical countries [1].
In Chinese Pharmacopoeia, R. Curcumae means the
rhizomes derived from Curcuma phaeocaulis Val., C.
kwangsiensis S.G. Lee et C.F. Liang or C. wenyujin Y.H.
Chen et C. Ling [2, 3]. Recently, it is broadly prescribed
as an anti-cancer drug in some Asian countries, such as
China [4, 5]. Sesquiterpenes, the main biological active
compotents in R. Curcumae, such as germacrone, curcumol and furanodienone, possess powerful anti-cancer
*Correspondence:
Department of Clinical Pharmacology, Shanghai General Hospital,
Shanghai Jiao Tong University School of Medicine, 100 Haining Road,
Shanghai 200080, China
properties against breast cancer, liver cancer and lung
cancer [4–8]. Moreover, curcumol, germacrone and curdione have been chosen as the index ingredients for its
quality control [9, 10]. As for the quantitative analysis of
these volatile components with thermo-sensitive and biological ability in R. Curcumae, high performance liquid
chromatography (HPLC) is more suitable than gas chromatography-mass spectrometry [3].
Currently, ultrasonic extraction and supercritical fluid
extraction (SFE) are gradually substituting the conventional extraction methods [11–13]. However, the system
for SFE is a bit complicated and expensive [14]. Ultrasonic extraction can achieve a high extraction efficiency
in a very short period of time through promoting the liquids with different poralities to generate fine emulsions
© 2016 The Author(s). This article is distributed under the terms of the Creative Commons Attribution 4.0 International License
( which permits unrestricted use, distribution, and reproduction in any medium,
provided you give appropriate credit to the original author(s) and the source, provide a link to the Creative Commons license,
and indicate if changes were made. The Creative Commons Public Domain Dedication waiver ( />publicdomain/zero/1.0/) applies to the data made available in this article, unless otherwise stated.
Wang et al. Chemistry Central Journal (2016) 10:32
and accelerating the mass-transfer procedure in the
reaction system [15–17]. For these reasons, ultrasonic
extraction has been broadly adopted in extraction with
advantages of saving time [18] and protecting heat-sensitive bioactive compounds from damage at a lower performance temperature [19].
Many parameters, such as ultrasonic time and solvent composition can influence the ultrasonic extraction efficiency separately or jointly [20]. With the aid of
central composite design (CCD), response surface methodology (RSM) has been a very useful tool to investigate
the individual or collective effects of several parameters on responses [20]. Further, desirability function
(DF) can optimize performance conditions for one or
more responses simultaneously via combining several
responses into one [17]. Now, the RSM coupled with DF
has been employed to optimize extraction process [20]
and prepare nanoparticles [21]. However, the research
about optimizing on three or more responses via employing RSM and DF was very few.
Due to the complexity of the compotents in herbs, combined action often occurs, bringing in an improvement of
the therapeutic effect [9]. Currently, a great attention has
been given to the biological activities of Chinese medical
herb extracts and its mechanisms [22–24].
This study focused on optimizing the ultrasonic extraction conditions to achieve the maximum extraction
yields of four bioactive compotents from C. wenyujin by
employing RSM coupled with DF and evaluating the antiproliferative activities of the C. wenyujin extract against
two colorectal cancer (CRC) cell lines. Meanwhile, the
impacts of ultrasound on the surface morphologies of C.
wenyujin were explored.
Results and discussion
Analytical performance of high performance liquid
chromatography
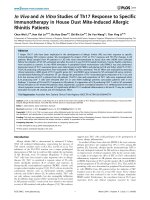
The HPLC prolife of the extract of C. wenyujin was demonstrated in Fig. 1. As expected, four peaks indicated
curdione, furanodienone, curcumol and germacrone
were identified, respectively. The HPLC method was validated through studying the regression equations, limits
of detection (LOD) and so on, as displayed in Additional
file 1: Table S1. The precision of the method was examined by analyzing the intra- and inter-day variations.
The relative standard deviations (RSDs) for the intra-day
variabilities of the four tested compounds were 1.57, 1.77,
4.18 and 2.04 %, respectively, and the RSDs for the interday variabilities were 1.13, 0.56, 5.61 and 1.47 %, respectively, indicating a high accuracy. The recoveries for the
four compotents were in the range of 97.91–104.28 %
with RSD ranging from 3.69 to 4.82 %. Summarily, the
Page 2 of 14
validated HPLC method was suitable for quantifing the
yields of these four bioactive compotents in the extract of
C. wenyujin.
Single factor tests
Single factor tests were adopted to evaluate whether the
type of solvent, solvent concentration, liquid–solid ratio,
ultrasonic time and extraction temperature could be
optimized for ultrasonic extraction yields of these four
bioactive compotents from C. wenyujin, and the results
are displayed in Additional file 2: Figure S1.
Additional file 2: Figure S1a demonstrates that the
extraction potential of ethanol is the second strongest,
which is weaker than that of methanol, but stronger than
those of ether and ethyl acetate. Besides, ethanol is safe
and eco-friendly compared with methanol. Especially,
Chen et al. adopted ethanol to prepare C. phaeocaulis
Val. extract with anti-tumor potential [24]. Therefore,
ethanol was chosen as solvent for next single factor tests.
Additional file 2: Figure S1b displays that the total
extraction yield started to increase with increasing
ethanol concentration, and peaked to the maximal yield
3.85 mg g−1 at concentration 80 % and then decreased,
consistent to Xu’s result [20]. Taking the extraction
yield and solvent consumption into consideration,
70 % was selected as the solvent concentration for next
analysis.
Additional file 2: Figure S1c reveals that the total
extraction yield was positively and significantly increased
by the liquid–solid ratio until the ratio was beyond
8 mL g−1; after that, the yield was almost unchanged.
Generally speaking, a higher solvent ratio can dissolve components more effectively from herbal materials, bringing in a promoted extraction efficiency [25].
Whereas excessive solvent will cause extra workload in
the concentration process [25]. Therefore, 8 mL g−1 was
ascertained as the liquid–solid ratio.
Additional file 2: Figure S1d presents that the extraction yield increased as the ultrasonic time increased
from 3 to 15 min. An adequate extraction time would be
beneficial for promoting the extraction efficiency, while
inordinately long extraction time might cause loss of
activities [20]. Accordingly, we fixed the ultrasonic time
at 15 min.
As we can see, the extraction yield was almost
unchanged when the extraction temperature changed
from 20 to 50 °C (Additional file 2: Figure S1e). Besides,
a higher extraction temperature probably was not good
for thermo-sensitive bioactive compotents, such as germacrone in R. Curcumae, leading to loss of activities [3,
20]. Thus, the extraction temperature was set at 30 °C for
further optimization experiments.
Wang et al. Chemistry Central Journal (2016) 10:32
Page 3 of 14
Fig. 1 HPLC chromatograms of a mixed standards of the four volatile components and b the four components in Curcuma wenyujin: (1) curdione;
(2) furanodienone; (3) curcumol and (4) germacrone
Three factors, the ethanol concentration, liquid–solid
ratio and ultrasonic time, were chosen for further optimizing ultrasonic extraction conditions of the four bioactive compotents from C. wenyujin by the subsequent
RSM coupled with DF.
Optimization employing response surface methodology
Statistical analysis and the model fitting
The data about the opration conditions of 17 runs and
the four responses are presented in Table 1. The analysis of variance (ANOVA) was employed to verify the
correctness of the quadratic models, as presented in
Table 2. The contributions of the models for these four
compotents were significant for the p values were less
than 0.05. The regression coefficients of the coded models for these four compounds are given in Table 2. Similarly, liquid–solid ratio (X1), ethanol concentration (X2),
ultrasonic time (X3) and quadratic ethanol concentration
(X22) are significant model terms. Moreover, the contributions of the three significant variables on the yields of the
four compotents could be ranked in the following orders:
ultrasonic time (X3) < ethanol concentration (X2) < liquid–solid ratio (X1). The lack of fit were not statistically significant (p = 0.4281, 0.4963, 0.2232 and 0.1346,
Table 2), suggesting the models fitted the data well.
The determination coefficient (R2) is another index of
model quality. For example, the determination coefficient
for the model of curdione (R2 = 0.9435) suggested that
Wang et al. Chemistry Central Journal (2016) 10:32
Page 4 of 14
Table 1 Central composite design and results for ultrasonic extraction of curdione, furanodienone, curcumol and germacrone from Curcuma wenyujin
Run
Factors
X1
1
2.6
2
6
X2
6.5
X3
Curdione
(mg g−1)
Furanodienone
(mg g−1)
Curcumol
(mg g−1)
Germacrone
(mg g−1)
Total yield
(mg g−1)
14
1.53
0.97
0.16
0.24
2.90
65
14
1.77
1.32
0.21
0.34
3.64
20
3
4
50
4
6
65
3.9
1.34
0.90
0.14
0.23
2.61
1.62
1.04
0.16
0.26
3.08
5
4
80
20
1.73
1.19
0.20
0.31
3.43
6
6
65
24.1
1.84
1.45
0.22
0.38
3.89
7
8
80
20
2.00
1.50
0.25
0.38
4.13
8
4
80
8
1.57
1.18
0.18
0.29
3.22
9
6
39.8
14
1.38
0.74
0.12
0.18
2.42
10
6
65
14
1.87
1.43
0.20
0.36
3.86
11
6
65
14
1.75
1.39
0.22
0.35
3.71
12
9.4
65
14
1.92
1.47
0.25
0.39
4.03
13
8
50
20
1.80
1.29
0.20
0.33
3.62
14
8
80
8
1.83
1.30
0.21
0.33
3.67
15
4
50
16
6
90.2
17
8
50
8
1.25
0.78
0.12
0.20
2.35
14
1.60
1.11
0.16
0.24
3.11
8
1.82
1.17
0.18
0.30
3.47
−1
X1 Liquid to solid ratio (mL g ); X2 Ethanol concentration (%); X3 Ultrasonic time (min)
94.35 % of the variation for the curdione yield would be
interpreted by the model [26]. As shown in Table 2, the
determination coefficients of these four models ranged
from 0.9435 to 0.9721, impling good fits between the
actual data and the empirical models. It is obvious that
the test objects were uniformly distributed and covered
the whole range of the training set, as indicated in Additional file 3: Figure S2. Besides, the predictive squared
correlation coefficients (Q2) [27] of these four models
were 0.8677, 0.9117, 0.8957 and 9076, as displayed in
Table 2. Therefore, each model possesses a high predictive ability [27]. The comparison of several methods often
encounters problems, such as not very fair, which could
be avoided by the sum of ranking differences (SRD) [28].
Therefore, we also employed SRD to evaluate the goodness of fit between the actual and the predicted value for
these four models by a software named SRDrep (SRD
with ties) [28, 29]. In the present study, the SRD values were 23, 14, 17 and 10 for the models of curdione,
furanodienone, curcumol and germacrone, respectively,
suggesting insignificant difference (p < 0.05) between the
actual and the predicted value for these four models.
From the above statistical results, it is possible to
regress the following second order polynomial equations:
Ycurdione = −1.954 + 0.287X1 + 0.072X2
+ 6.620 × 10−3 X3 − 4.479 × 10−3 X22
(1)
Yfuranodienone = −3.541 + 0.277X1 + 0.101X2
+ 0.032X3 − 0.012X12 − 6.664 × 10−4 X22
(2)
Ycurcumol = −0.472 + 0.020X1 + 0.016X2
+ 1.818 × 10−3 X3 − 1.095 × 10−4 X22
(3)
Ygermacrone = −1.045 + 0.064X1 + 0.031X2
+ 6.684 × 10−3 X3 − 2.096 × 10−4 X22 .
(4)
Response surface analysis
Three-dimensional response surface plots were depicted
to study the individual or collective effects of these three
vital parameters on the ultrasonic extraction yields of
these four main compotents from C. wenyujin (Fig. 2).
Figure 2a, d, g and j reveal that the interactive effects of
liquid–solid ratio (X1) and ethanol concentration (X2) on
the yields of the four compotents in 14 min of ultrasonic
time (X3). Although the interaction are not statistically
significant (p > 0.05, Table 2), the variation of these four
compotent yields in the extracts can also be seen in these
figures. When the two factors were at high levels, the
extraction yields were maximum. At a given ethanol concentration, the yields increased as the liquid–solid ratio
increased. While, the increment of the liquid–solid ratio
Wang et al. Chemistry Central Journal (2016) 10:32
Page 5 of 14
Table 2 Analysis of variance for central composite design and tests of the regression coefficients and intercepts of coded
equations for curdione, furanodienone, curcumol and germacrone
Source
Curdione
Mean squares
F
p value
0.075
12.99
0.0014
X1
0.360
61.88
0.0001
0.160
X2
0.120
20.88
0.0026
0.094
X3
0.042
7.29
0.0307
0.056
X1X2
0.029
5.04
0.0596
X1X3
1.326 × 10⁻³
0.23
0.6466
X2X3
8.001 × 10⁻³
1.38
0.2779
X21
X22
X23
4.588 × 10⁻³
0.79
0.4027
0.110
19.80
0.0030
3.531 × 10⁻³
0.61
0.4601
6.474 × 10⁻³
1.60
0.4281
0.098
27.14
0.0001
X1
0.330
90.16
<0.0001
0.150
X2
0.190
51.54
0.0002
0.120
X3
0.110
29.00
0.0010
0.088
X1X2
9.730 × 10⁻³
2.69
0.1452
X1X3
1.966 × 10⁻³
0.54
0.4852
−0.035
X2X3
1.566 × 10⁻⁴
0.04
0.8412
X21
X22
X23
0.025
7.01
0.0331
0.250
70.00
<0.0001
0.015
4.14
0.0813
Lack of Fit
3.853 × 10⁻³
1.27
0.4963
2.694 × 10⁻³
15.43
0.0008
X1
8.931 × 10⁻³
51.15
0.0002
0.026
X2
4.953 × 10⁻³
28.37
0.0011
0.019
X3
2.519 × 10⁻³
14.43
0.0067
0.014
X1X2
1.739 × 10⁻⁴
1.00
0.3515
X1X3
9.453 × 10⁻⁵
0.54
0.4858
−4.663 × 10−3
X2X3
9.045 × 10⁻⁵
0.52
0.4950
X21
3.674 × 10⁻⁷
2.10 × 10⁻³
0.9647
X22
6.848 × 10⁻³
39.22
0.0004
X23
2.553 × 10⁻⁴
1.46
0.2658
−4
3.76
0.2232
7.756 × 10⁻³
16.36
0.0007
X1
0.023
49.39
0.0002
X2
0.010
21.15
0.0025
0.027
X3
9.435 × 10⁻³
19.90
0.0029
0.026
X1X2
8.694 × 10⁻⁴
1.83
0.2178
X1X3
9.940 × 10⁻⁵
0.21
0.6609
−0.010
X2X3
−5
0.04
0.8559
1.450 × 10⁻³
−4
1.68
0.2365
−8.395 × 10⁻³
Model
Intercept
1.790
Lack of Fit
2
Coefficient estimate
−0.060
−0.013
0.032
−0.020
−0.100
−0.018
2
R = 0.9435, Q = 0.8677, Adeq Precision = 12.121
Furanodienone
Model
Intercept
1.370
−0.013
4.425 × 10⁻³
−0.047
−0.150
−0.036
R2 = 0.9721, Q2 = 0.9117, Adeq Precision = 16.176
Curcumol
Model
Intercept
Lack of Fit
0.210
2.209 × 10
3.437 × 10⁻³
3.362 × 10⁻³
−1.805 × 10⁻⁴
−0.025
−4.759 × 10⁻³
R2 = 0.9520, Q2 = 0.8957, Adeq Precision = 14.233
Germacrone
Model
Intercept
X21
0.350
1.682 × 10
7.945 × 10
0.041
3.525 × 10⁻³
Wang et al. Chemistry Central Journal (2016) 10:32
Page 6 of 14
Table 2 continued
Source
Mean squares
F
p value
X22
0.025
52.89
0.0002
X23
4.873 × 10⁻⁴
1.03
0.3444
Lack of Fit
6.264 × 10⁻⁴
6.72
0.1346
2
Coefficient estimate
−0.047
−6.574 × 10⁻³
2
R = 0.9546, Q = 0.9076, Adeq Precision = 13.465
X1 Liquid to solid ratio (mL g−1); X2 Ethanol concentration (%); X3 Ultrasonic time (min)
failed to enhance the extraction yields obviously with the
ratio in the range 7–8 mL g−1. This outcome was corresponding to the principle of mass transfer, where the
transport force stems from the concentration gradient of
a particular component between the solid and the liquid
[26]. The transport force increases when a higher liquid–
solid ratio is used [26]. However, the driving force will
not increase when the solvent volume is sufficient [26].
In our study, the extraction yields were not significantly
changed when the ratio was over 7 mL g−1, in agreement
with the reports by Tian and Lou [26, 30].
Figure 2c, f, i and l indicate the insignificant functions
of ethanol concentration (X2) and ultrasonic time (X3) for
the extraction yields of these four compotents (p > 0.05,
Table 2). As shown, the extraction yields were positively
correlated with ethanol concentration when it was lower
than about 70 %. However, they were negatively correlated when ethanol concentration increased beyond
about 70 %, consistent with the quadratic coefficients
of ethanol concentration (−0.100, −0.150, −0.025 and
−0.047, respectively, Table 2). Previous studies reported
that the ethanol solution with concentration ranging
from 70 to 80 % (v/v) was suitable for extracting lipophilic phytochemicals, such as isorhamnetin and piceatannol [20, 31]. In aqueous organic solution, the dried
herbal materials in dehydrated state could swell. Besides,
according to the ‘‘like dissolves like’’ extraction principle, extracting lipophilic compotents should use organic
solvents [31]. So, the action of ethanol concentration on
extraction yield results from its function on expanding
the herbs and promoting the dissolution of sesquiterpene
compotents from the herbs [31].
Figure 2b, e, h and k present that the mutual influences of liquid–solid ratio (X1) and ultrasonic time (X3)
were not correlated with the ultrasonic extraction yields
of these four compotents (p > 0.05, Table 2). Fixing the
liquid–solid ratio at 6 mL g−1, the extraction yields
increased with ultrasonic time between 8 and 20 min,
indicating the positive influence of ultrasonic time on
the ultrasonic extraction efficiency. While, the increase
in extraction yields was not particularly evident, when
the ultrasonic time was above 17 min. Obviously, when
the ethanol concentration was set at 65 %, the highest
extraction yields could be gained at the ultrasonic time
of 20 min and liquid–solid ratio of 8 mL g−1. Our result
was similar to that of Wang et al. suggested that after the
highest extraction yield was obtained, a extended ultrasonic time was not necessary [32].
The response surface plots indicated that the extraction
yields mainly depended on the liquid–solid ratio, ethanol
concentration and ultrasonic time, whereas no significant
impact was observed in the mutual functions of these
vital parameters, in good agreement with the ANOVA
results.
Optimization using desirability function
Based on the results of CCD, a DF approach was performed to achieve the purpose of optimizing the four
responses continuously. The response surfaces of the
combined desirability (D) were obtained, as illustrated
in Fig. 3, bringing in the maximum D at the top with a
condition as follows: liquid–solid ratio, 8 mL g−1; ethanol concentration, 70 % and ultrasonic time, 20 min. The
maximum yields predicted for the four compotents were
1.97, 1.56, 0.25 and 0.41 mg g−1, respectively. Additional
file 4: Figure S3 illustrates that the desirabilities of these
four compounds were more than 0.9. Furthermore, the
maximum D 0.971 was calculated out on the principle of
D (D = d1 × d2 × d3 × d4 = 0.905 × 1 × 0.983 × 1 = 0.9
71). The optimization result was considered as acceptable
and excellent with desirability value ranging from 0.8 to 1
[33]. In summary, the multiple response surface optimization result of this study was desirable.
Verification
Three verification experiments were performed to validate the ultrasonic extraction conditions optimized.
Mean extraction yields of curdione, furanodienone,
curcumol and germacrone were 1.98, 1.55, 0.25 and
0.40 mg g−1, respectively, consistent with the model’s
predictions. Therefore, the ultrasonic extraction conditions for extracting the four bioactive compotents from
C. wenyujin could be effectively optimized by employing
RSM and DF.
Wang et al. Chemistry Central Journal (2016) 10:32
Page 7 of 14
Fig. 2 Three-dimensional response surface plots showing the effects of experimental factors and their mutual functions on extraction of: a–c Curdione; d–f Furanodienone; g–i Curcumol and j–l Germacrone from Curcuma wenyujin. The unmarked factor in each plot is held at its central value
Comparison and field emission scanning electron
micrographs
The optimizated ultrasonic extraction method was
compared with the steam distillation (SD) extraction
and maceration extraction. The results are presented
in Table 3. The ANOVA results indicated that the total
extraction yield of these four compotents gained by ultrasonic extraction was the highest at 4.19 mg g−1, followed
by those of SD extraction and maceration extraction,
with extraction time of 20 min (p < 0.05). Besides, SD
extraction and maceration extraction took 1 and 2 h,
respectively, to gain the similar extraction yields of the
four compounds to that gained under the optimized
ultrasonic extraction conditions. Combined with prior
literature [34], our ultrasonic extraction method reduced
the extraction time obviously.
For elucidating the mechanism of ultrasonic extraction, the characterization of C. wenyujin samples from
Wang et al. Chemistry Central Journal (2016) 10:32
Page 8 of 14
Fig. 3 Response surface graph of the maximum global desirability function with 0.971 at a 20 min extraction time; b 70.1 % ethanol concentration
and c 8 mL g−1 liquid–solid ratio
Table 3 Extraction yields of curdione, furanodienone, curcumol and germacrone from Curcuma wenyujin by ultrasonic
extraction, SD extraction and maceration extraction
Extraction methods
Extraction
solvents
Extraction
time
Curdione
(mg g−1)
Furanodienone
(mg g−1)
Curcumol
(mg g−1)
Germacrone
(mg g−1)
Total yield
(mg g−1)
Ultrasonic extraction
70 % ethanol
20 min
2.00
1.56
0.25
0.41
4.22
SD extraction
Pure water
20 min
1.38
1.42
0.22
0.32
3.34
Maceration extraction
70 % ethanol
20 min
1.46
1.12
0.20
0.27
3.05
SD extraction
Pure water
1 h
1.89
1.52
0.24
0.39
4.04
Maceration extraction
70 % ethanol
2 h
1.94
1.52
0.26
0.38
4.10
SD means steam distillation
ultrasonic extraction, SD extraction and maceration
extraction were examined by field emission scanning
electron microscope (FESEM, JEOL Ltd., Japan; Fig. 4).
Comparing to the tight and smooth surface morphologies
of raw C. wenyujin samples in Fig. 4a, we can see that the
surface morphologies of ultrasound-treated C. wenyujin
samples became loose and rough. Besides, a longer ultrasonic extraction time brought serious changes in surface
morphology (Fig. 4c), increasing its surface area. It can
be found that the alterations in surface morphology in
Fig. 4c were the most apparent among the Fig. 4c–e, presenting the characterization results of ultrasonic extraction, SD extraction and maceration extraction treatments
on the C. wenyujin samples, respectively, for 20 min. Furthermore, extending SD and maceration extraction times
to 1 and 2 h, respectively, failed to bring similar serious
morphological changes in Fig. 4f and g to that in Fig. 4c.
Combined with the data in Table 3, we believed that the
characterization changes (e.g. loose, damaged and rough)
of surface morphology increased the extraction yields
of the four compotents from C. wenyujin. Our results
are agreement with those of prior researches indicating
ultrasound could apparently change the surface morphology of raw samples because of the surface cavitation [35,
36]. Moreover, the “mechanoacoustic effects” is able to
promote the availability of the phytomass through microjet erosion, cell wall disruption and mass transfer expansion in a heterogeneous mixture of phytomass and liquid,
leading to an enhanced extraction efficiency [37]. In summary, ultrasonic extraction could produce cavitation and
promote the expansion of the medicinal samples resulting in serious changes in surface morphology, which
improve the specific surface area, extraction solvent penetration into herbal materials and release of intracellular
soluble ingredients to solvent. Thus, ultrasonic extraction is suitable for extracting the four compotents from
C. wenyujin with advantages of short extraction time and
high efficiency.
Antiproliferative activities
The evaluation of whether the C. wenyujin extract could
effect the proliferation of RKO and HT-29 cells was performed using the CCK-8 assay. As displayed in Fig. 5a,
the extract of C. wenyujin gained under the optimal ultrasonic extraction conditions reduced the growth of the
two cells concentration-dependently at 1:80, 1:53 and
1:40 dilution rate after 48 h. The highest diluted extract
(1:160 dilution) did not inhibit the growth of RKO cells,
consistent to a previous research [38]. While, the antiproliferative rate against RKO cells was 79.5 % at 1:40
Wang et al. Chemistry Central Journal (2016) 10:32
Page 9 of 14
Fig. 4 FESEM images of raw and treated materials under different extraction conditions. a Raw materials; b Ultrasonic extraction 8 min; c Ultrasonic
extraction 20 min; d SD extraction 20 min; e Maceration extraction 20 min; f SD extraction 1 h and g Maceration extraction 2 h
dilution. After RKO and HT-29 cells were treated with
the extract for 48 h, the cell proliferation were observed
with half inhibitory concentration (IC50) values of 1:67
and 1:76 dilution rates, respectively. Therefore, the
extract of C. wenyujin exhibited remarkable antiproliferative potentials against the two cell lines for 48 h.
In order to ascertain which the compotent(s) in the
extract could play a role in the the antiproliferative
activity, these four main compotents of the extract were
individually tested. Results, demonstrated in Fig. 5b
and c, indicated that, all the four components showed
significant growth inhibitory effects on the two cells
except furanodienone on RKO cells at concentration
100 µmol L−1. Among these four bioactive compotents,
furanodienone, whose content was the second highest in the C. wenyujin extract (Table 3), inhibited the
growth of the two cell lines obviously, at concentration
200–400 µmol L−1, consistent to other studies [7, 39–41].
Wang et al. reported that curcumol was capable of inhibiting the cell viability of another two CRC cell lines in a
concentration-dependent manner [42]. In this study, we
further found that the inhibition rates of furanodienone
against RKO and HT-29 cells were more than 50.0 %
(52.0 and 51.7 %, respectively) at 400 µmol L−1, indicating
strong antiproliferative potential.
The joint inhibitory functions of the four components
on the two cells were also investigated at the concentration corresponding to that in Fig. 5a, as displayed in
Fig. 5d. The mixed solution displayed concentrationdependent antiproliferative potentials against the two
cells except against RKO cells at 50 µmol L−1. Besides, at
concentration of 200 µmol L−1, the inhibition rates were
56.3 and 63.4 %, to RKO and HT-29 cells, respectively. In
addition, the inhibitory actions of the mixed solution on
HT-29 cells were higher than that on RKO cells, at the
lower two concentrations (p < 0.05, Fig. 5d). This phenomenon may be explained that RKO cells were little less
sensitive to low drug concentrations than HT-29 cells
[43].
As compared Fig. 5a and d with Fig. 5b and c, it was
obvious that the antiproliferative activities of single component against RKO and HT-29 cells were lower than
those of the C. wenyujin extract or the mixture, at the
same concentration. It may be related to the interactions
among active components. For instance, the inhibitory
potential of furanodiene on proliferation of breast cancer cells could be enhanced by germacrone [9]. Moreover, the active components in zedoary oil probably have
a synergy on AGS cell growth [44]. Therefore, the antiproliferative activities of the C. wenyujin extract and the
mixed solution against the two cell lines may be caused
by the synergistic inhibition action of these components,
which needs further investigation. Actually, synergistic
action can exist in herbal medicine, decreasing active
concentration of pure compound [38, 45]. As compared
Fig. 5a with Fig. 5d, it can be seen that the proliferation
inhibitory effects of the C. wenyujin extract on the two
cell lines were slightly stronger than those of the mixture at the same concentration. A possibility for this
result might be that other compotents existed in the total
Wang et al. Chemistry Central Journal (2016) 10:32
Page 10 of 14
Fig. 5 Antiproliferative activities in CRC cells a the effect of Curcuma wenyujin extract on RKO and HT-29 cells; b the effect of the four compounds
on RKO cells; c the effect of the four compounds alone on HT-29 cells and d combined effect of these four compounds on RKO and HT-29 cells. In
picture d, the concentration in horizontal coordinate refers to that of curdione
extract (Fig. 1) which could also be conducive to its overall antiproliferative activity, resulting in a series of complex combined effects.
In conclusion, the extract of C. wenyujin gained under
the optimal ultrasonic extraction conditions demonstrated marked antiproliferative activities against RKO
and HT-29 cells in vitro. The molecular mechanism of
the antiproliferative activity needs to be further explored.
Conclusions
This study was conducted to model and optimize the
ultrasonic extraction conditions of extracting curdione, furanodienone, curcumol and germacrone from C.
wenyujin by employing RSM and evaluate the inhibitory potential of the C. wenyujin extract on proliferation of RKO and HT-29 cells. Quadratic models for the
four compounds content were derived with R2 in the
range of 0.9435–0.9721. The simultaneous optimization
of the multi-response system by DF indicated that the D
of 97.1 % can be possible under the conditions: liquid–
solid ratio, 8 mL g−1; ethanol concentration, 70 % and
ultrasonic time, 20 min. Ultrasonic treatment effectively
promoted the loose and rough morphology of C. wenyujin samples. Additionally, the C. wenyujin extract gained
under the optimal ultrasonic extraction conditions exhibited remarkable antiproliferative activities against the
two cell lines. In summary, the response surface methodology could been successfully employed to optimize
the ultrasonic extraction of C. wenyujin, and the results
demonstrates that the extract possesses a remarkable
antiproliferative activity against colorectal cancer cells
in vitro.
Wang et al. Chemistry Central Journal (2016) 10:32
Experimental
Materials
Curcuma wenyujin Y.H. Chen et C. Ling, which grew in
Zhejiang Province (China), was purchased from Shanghai General Hospital (China). The plant sample was
ground into powder using a cyclone mill, and the powder was sieved through a 60 mesh sieve for ultrasonic
extraction. HPLC-grade methanol and acetonitrile were
brought from TEDIA (Ohio, USA). Ethanol, ether and
ethyl acetate were analytically pure and obtained from
Sanjie Chemical Co., Suzhou, China. Pure water was
gained from a Millipore Milli Q-Plus system (Millipore,
Bedford, MA). Curcumol, curdione and germacrone were
obtained from Standard Bio-Technology Co., Ltd, Shanghai, China. Furanodienone was purchased from Yuanye
Bio-Technology Co., Ltd, Shanghai, China. Dulbecco’s
modified Eagle’s medium (DMEM), antibiotics (penicillin–streptomycin) and phosphate-buffered saline (PBS)
were obtained from Jinuo Biotechnology (Hangzhou,
China). Fetal bovine serum (FBS) was supplied by Gibco
(CA, USA). CCK-8 kit was obtained from Dojindo Laboratories (Tokyo, Japan). Dimethyl sulfoxide (DMSO) was
from Sigma (MO, USA).
Methods
High‑performance liquid chromatography
Agilent Series 1100 liquid chromatography (Agilent Technologies, USA) with a Zorbax C18 column
(4.6 × 150 mm, 5 µm) was adopted for HPLC analysis.
The elution system was: acetonitrile, solvent A; water,
solvent B. The gradient elution conditions applied were:
0–10 min, linear gradient 50–60 % A and 10–20 min,
linear gradient 60–80 % A. The column temperature was
25 °C. The injection volume was 20 µL, and the flow-rate
was 1 mL min−1. The peaks were detected at 210 nm.
Single factor tests
Taking previous researches and the constraints of experimental equipment into consideration [46], ultrasonic
extraction was performed using an ultrasonic cleaning
bath at 250 W and 25 kHz. The influences of five parameters, namely the type of solvent, solvent concentration,
liquid–solid ratio, ultrasonic time and extraction temperature, on the total extraction yields of curdione, furanodienone, curcumol and germacrone from C. wenyujin
were examined by single factor tests. Firstly, the extraction abilities of methanol, ethanol, ether and ethyl acetate
were examined. After ethanol was chosen as the suitable
extraction solvent, the ethanol concentration was investigated at 30 °C with 10.0 g samples and 80 mL ethanol
solutions at concentrations of 40, 60, 70, 80 and 100 %
for 10 min. After 70 % ethanol solution was chosen as
the optimum extraction solvent, 10.0 g samples were
Page 11 of 14
sonicated with different liquid–solid ratios (4, 6, 8 and
10 mL g−1) for 10 min at 30 °C. Then, the ultrasonic time
(3, 5, 10, 15 and 20 min) was investigated with 80 mL
extraction solvent at 30 °C. Finally, to evaluate the influence of temperature, 10.0 g samples with 80 mL extraction solvent were sonicated 15 min at 20, 30, 40 and
50 °C, respectively.
Ultrasonic extraction
Ultrasonic extraction was carried out for extracting the
main four compotents from C. wenyujin sample. Firstly,
10.00 g C. wenyujin sample and a certain volume of solvent were placed into a 100 mL flask and sonicated at a
fixed temperature for a given time. After extraction, the
extract was centrifugated at 6000 rpm for 10 min. Subsequently, the supernatant extracted using methanol,
ethanol or ethanol solution was poured into a 100 mL
volumetric flask which was then filled to the mark
with extraction solvent. Meanwhile, the supernatants
extracted using other two solvents were evaporated and
then dissolved with methanol. Lastly, each extracted
solution was filtered with a 0.45 µm econofilter for determination analysis by HPLC.
Central composite design
On the basis of single factor tests, a three-variable, fivelevel CCD with 17 runs was built (Table 1) [47]. The
ultrasonic treatments were conducted in random to
minimize systematic errors [17]. Design-Expert™ version 8.5 software (Stat-Ease Inc., Minneapolis, MN, USA)
was adopted to analyze the data and estimate the regression equation coefficients [48]. The form of quadratic
response model was as follows:
3
Yf = β0 +
3
i=1
2
3
βii Xi2 +
βi Xi +
i=1
βij Xi Xj
(5)
i=1 j=i+1
where β0; βi; βii and βij are the coefficients for the
response surface model. Xi and Xj are the independent
variables. Yf is the measured response variable.
Desirability function
A DF approach was employed to optimize the four
responses simultaneously. The principle is to transform
each predicted response to a dimensionless desirability
(di) between 0 and 1, and combine their geometric average of the di values into D. The equation was as follows
[17]:
1/n
n
D = (d1 × d2 × d3 × · · · × dn )1/n =
di
i=1
where n indicates the number of characteristics.
(6)
Wang et al. Chemistry Central Journal (2016) 10:32
The bound of each response and parameter was defined
by the results in Table 1, and the “Goal” field for each
response was set to the “maximum” to obtain the maximum D.
Comparison and field emission scanning electron microscope
In order to compare the extraction ability of the ultrasonic extraction technique to that of the classical
extraction methods and investigate the mechanism of
ultrasonic extraction, ultrasonic extraction, SD extraction and maceration extraction were all carried out with
a same liquid–solid ratio (8 mL g−1). After centrifugation, HPLC was employed for determination the extraction yields of the four compounds in the C. wenyujin
extract. Meanwhile, to protect the original structures of
these precipitates from damage, the dry process was performed on a vacuum freezerdrye (FreeZone Stoppering
Tray Dryer, Labconco) [49]. Micrographs about the surface morphologies of these samples were obtained with
FESEM.
Cell culture and CCK‑8 assay
CRC RKO and HT-29 cells provided by the Institute of
Clinical Translational Research, Shanghai General Hospital (Shanghai, China) were incubated in DMEM with 1 %
antibiotics and 10 % FBS at 37 °C and 5 % CO2.
Firstly, the raw C. wenyujin extract obtained under the
optimized ultrasonic extraction conditions was concentrated for 10 times to eliminate the influence of ethanol
on cytoactive by vacuum concentration method. The
concentrated C. wenyujin extract was then diluted with
DMEM, antibiotics and FBS to 1:160, 1:80, 1:53 and 1:40
solutions. Meanwhile, these four pure ingredients were
dissolved by DMSO to prepare stock solutions and then
diluted as needed. Based on the concentration proportion of these main four compounds in the extract of C.
wenyujin, the mixed solutions were prepared. The concentration of curdione in this mixture was used to mark
that of the mixed solution.
The antiproliferative activities of the C. wenyujin
extract against the two kinds of tumor cells were tested
by a CCK-8 kit. Briefly, the two cells were counted and
seeded into 96-well plates with a density of 5 × 10³ and
8 × 10³ cells per well, respectively, and allowed to adhere
to the plates overnight. Subsequently, the cells were
treated with a range of dilution ratios of C. wenyujin
extract for 48 h. Lastly, the absorbance was monitored at
450 nm using Microplate reader (BIO-RAD, CA, USA).
Similarly, the separate or joint effects of the main four
compotents in C. wenyujin extract on the proliferation of
the two cells were also examined.
Page 12 of 14
Statistical analysis
All analyses were carried out at three times. The CCD
results were analyzed by Design-expert version 8.5 software. The comparison of the actual and the predictive
value of these four models was performed by the SRD
analyses. IBM SPSS 20.0 software (SPSS Inc., Chicago,
IL, USA) was adopted to perform the ANOVA for the
extraction yields of different extraction methods and calculate IC50. In the present study, p < 0.05 was considered
as statistically significant.
Additional files
Additional file 1: Table S1. Analytical performance of these four investigated compounds in Curcuma wenyujin by the HPLC method.
Additional file 2: Figure S1. Effects of five factors on the total extraction
yield of curdione, furanodienone, curcumol and germacrone from Curcuma wenyujin. (a) type of solvent; (b) ethanol concentration; (c) liquid–
solid ratio; (d) ultrasonic time and (e) temperature.
Additional file 3: Figure S2. Predicted responses versus actual
responses. (a) curdione; (b) furanodienone; (c) curcumol; and (d)
germacrone.
Additional file 4: Figure S3. Bar graph showing individual desirability
values (di) of various objective responses and the maximum combined
desirability of 0.971 for the optimization of ultrasonic extraction conditions for extraction of curdione, furanodienone, curcumol and germacrone from Curcuma wenyujin.
Abbreviations
SFE: supercritical fluid extraction; RSM: response surface methodology; CCD:
central composite design; DF: desirability function; FESEM: field emission scanning electron microscope; HPLC: high performance liquid chromatography;
SD: steam distillation; RSD: relative standard deviations; CCK-8: cell counting kit-8; CRC: colorectal cancer; ANOVA: analysis of variance; D: combined
desirability; IC50: half maximal inhibitory concentration; SRD: sum of ranking
differences.
Authors’ contributions
DH and XW designed the study; XW and YJ performed the experiments; DH
and XW analysed the data; DH, XW and YJ wrote the paper. All authors read
and approved the final manuscript.
Acknowledgements
The authors gratefully acknowledge the financial support of the Shanghai
Committee of Science and Technology (12401900503), the Health Bureau of
Shanghai, China (2011ZJ021) and the State Key Laboratory of Clinical Pharmacology Department of Shanghai General Hospital.
Competing interests
The authors declare that they have no competing interests.
Received: 30 November 2015 Accepted: 9 May 2016
References
1. Makabe H, Maru N, Kuwabara A, Kamo T, Hirota M (2006) Anti-inflammatory sesquiterpenes from Curcuma zedoaria. Nat Prod Res 20:680–685
Wang et al. Chemistry Central Journal (2016) 10:32
2. Chinese Pharmacopoeia Committee (2010) The pharmacopoeia of the
People’s Republic of China, Part 1. Chemical Industry Press, Beijing, p
257–258
3. Yang FQ, Wang YT, Li SP (2006) Simultaneous determination of 11
characteristic components in three species of Curcuma rhizomes using
pressurized liquid extraction and high-performance liquid chromatography. J Chromatogr A 1134:226–231
4. Xie XH, Zhao H, Hu YY, Gu XD (2014) Germacrone reverses Adriamycin
resistance through cell apoptosis in multidrug-resistant breast cancer
cells. Exp Ther Med 8:1611–1615
5. Lu JJ, Dang YY, Huang M, Xu WS, Chen XP, Wang YT (2012) Anti-cancer
properties of terpenoids isolated from Rhizoma Curcumae—a review. J
Ethnopharmacol 143:406–411
6. Zhang W, Wang Z, Chen T (2011) Curcumol induces apoptosis via
caspases-independent mitochondrial pathway in human lung adenocarcinoma ASTC-a-1 cells. Med Oncol 28:307–314
7. Chen G, Wang Y, Li M, Xu T, Wang X, Hong B, Niu Y (2014) Curcumol
induces HSC-T6 cell death through suppression of Bcl-2: involvement of
PI3 K and NF-kappaB pathways. Eur J Pharm Sci 65:21–28
8. Li YW, Zhu GY, Shen XL, Chu JH, Yu ZL, Fong WF (2011) Furanodienone
induces cell cycle arrest and apoptosis by suppressing EGFR/HER2
signaling in HER2-overexpressing human breast cancer cells. Cancer
Chemother Pharmacol 68:1315–1323
9. Kong Q, Sun F, Chen X (2013) Impact of fixed-dose combination of germacrone, curdione, and furanodiene on breast cancer cell proliferation.
Cell J 15:160–165
10. Li J, Mao C, Li L, Ji D, Yin F, Lang Y, Lu T, Xiao Y, Li L (2014) Pharmacokinetics and liver distribution study of unbound curdione and curcumol in
rats by microdialysis coupled with rapid resolution liquid chromatography (RRLC) and tandem mass spectrometry. J Pharmaceut Biomed
95:146–150
11. Tao W, Zhang H, Xue W, Ren L, Xia B, Zhou X, Wu H, Duan J, Chen G
(2014) Optimization of supercritical fluid extraction of oil from the
fruit of Gardenia jasminoides and its antidepressant activity. Molecules
19:19350–19360
12. Wang HJ, Pan MC, Chang CK, Chang SW, Hsieh CW (2014) Optimization of
ultrasonic-assisted extraction of cordycepin from Cordyceps militaris using
orthogonal experimental design. Molecules 19:20808–20820
13. Bashipour F, Ghoreishi SM (2014) Response surface optimization of supercritical CO2 extraction of α-tocopherol from gel and skin of Aloe vera and
almond leaves. J Supercrit Fluid 95:348–354
14. Rui H, Zhang L, Li Z, Pan Y (2009) Extraction and characteristics of seed
kernel oil from white pitaya. J Food Eng 93:482–486
15. Liang P, Wang F, Wan Q (2013) Ionic liquid-based ultrasound-assisted
emulsification microextraction coupled with high performance liquid
chromatography for the determination of four fungicides in environmental water samples. Talanta 105:57–62
16. de Luque Castro MD, Priego-Capote F (2007) Ultrasound-assisted preparation of liquid samples. Talanta 72:321–334
17. Khodadoust S, Ghaedi M, Hadjmohammadi MR (2013) Dispersive nano
solid material-ultrasound assisted microextraction as a novel method for
extraction and determination of bendiocarb and promecarb: response
surface methodology. Talanta 116:637–646
18. Rodrigues S, Pinto GAS, Fernandes FAN (2008) Optimization of ultrasound
extraction of phenolic compounds from coconut (Cocos nucifera)
shell powder by response surface methodology. Ultrason Sonochem
15:95–100
19. Chen QH, Fu ML, Liu J, Zhang HF, He GQ, Ruan H (2009) Optimization
of ultrasonic-assisted extraction (UAE) of betulin from white birch bark
using response surface methodology. Ultrason Sonochem 16:599–604
20. Xu Q, Shen Y, Wang H, Zhang N, Xu S, Zhang L (2013) Application of
response surface methodology to optimise extraction of flavonoids from
fructus sophorae. Food Chem 138:2122–2129
21. Hao J, Wang F, Wang X, Zhang D, Bi Y, Gao Y, Zhao X, Zhang Q (2012)
Development and optimization of baicalin-loaded solid lipid nanoparticles prepared by coacervation method using central composite design.
Eur J Pharm Sci 47:497–505
22. Han SY, Zhao W, Sun H, Zhou N, Zhou F, An G, Li PP (2015) Marsdenia
tenacissima extract enhances gefitinib efficacy in non-small cell lung
cancer xenografts. Phytomedicine 22:560–567
Page 13 of 14
23. Zhang Y, Xie RF, Xiao QG, Li R, Shen XL, Zhu XG (2014) Hedyotis diffusa
Willd extract inhibits the growth of human glioblastoma cells by inducing mitochondrial apoptosis via AKT/ERK pathways. J Ethnopharm
158(Part A):404–411
24. Chen X, Pei L, Zhong Z, Guo J, Zhang Q, Wang Y (2011) Anti-tumor potential of ethanol extract of Curcuma phaeocaulis Valeton against breast
cancer cells. Phytomedicine 18:1238–1243
25. Dong J, Liu Y, Liang Z, Wang W (2010) Investigation on ultrasoundassisted extraction of salvianolic acid B from Salvia miltiorrhiza root.
Ultrason Sonochem 17:61–65
26. Tian Y, Xu Z, Zheng B, Martin Lo Y (2013) Optimization of ultrasonicassisted extraction of pomegranate (Punica granatum L.) seed oil. Ultrason Sonochem 20:202–208
27. Consonni V, Ballabio D, Todeschini R (2010) Evaluation of model predictive ability by external validation techniques. J Chemometr 24:194–201
28. Heberger K (2010) Sum of ranking differences compares methods or
models fairly. Trends Anal Chem 29:101–109
29. Kollar-Hunek K, Heberger K (2013) Method and model comparison
by sum of ranking differences in cases of repeated observations (ties).
Chemometr Intell Lab Systems 127:139–146
30. Lou Z, Wang H, Zhang M, Wang Z (2010) Improved extraction of oil from
chickpea under ultrasound in a dynamic system. J Food Eng 98:13–18
31. Lai TNH, André CM, Chirinos R, Nguyen TBT, Larondelle Y, Rogez H (2014)
Optimisation of extraction of piceatannol from Rhodomyrtus tomentosa seeds using response surface methodology. Sep Purif Technol
134:139–146
32. Wang Y, Liu Y, Hu Y (2014) Optimization of polysaccharides extraction
from Trametes robiniophila and its antioxidant activities. Carbohydr Polym
111:324–332
33. Amini Sarteshnizi R, Hosseini H, Bondarianzadeh D, Colmenero FJ, Khaksar
R (2015) Optimization of prebiotic sausage formulation: effect of using
β-glucan and resistant starch by D-optimal mixture design approach.
LWT Food Sci Technol 62:704–710
34. Deng C, Ji J, Li N, Yu Y, Duan G, Zhang X (2006) Fast determination of curcumol, curdione and germacrone in three species of Curcuma rhizomes
by microwave-assisted extraction followed by headspace solid-phase
microextraction and gas chromatography-mass spectrometry. J Chromatogr A 1117:115–120
35. Shi W, Jia J, Gao Y, Zhao Y (2013) Influence of ultrasonic pretreatment on
the yield of bio-oil prepared by thermo-chemical conversion of rice husk
in hot-compressed water. Bioresource Technol 146:355–362
36. Subhedar PB, Gogate PR (2014) Alkaline and ultrasound assisted alkaline
pretreatment for intensification of delignification process from sustainable raw-material. Ultrason Sonochem 21:216–225
37. Bussemaker MJ, Zhang DK (2013) Effect of ultrasound on lignocellulosic
biomass as a pretreatment for biorefinery and biofuel applications. Ind
Eng Chem Res 52:3563–3580
38. Cattaneo L, Cicconi R, Mignogna G, Giorgi A, Mattei M, Graziani G, Ferracane R, Grosso A, Aducci P, Schinina ME, Marra M (2015) Anti-proliferative
effect of Rosmarinus officinalis L. extract on human melanoma A375 Cells.
PLoS One 10:e0132439
39. Tang QL, Guo JQ, Wang QY, Lin HS, Yang ZP, Peng T, Pan XD, Liu B, Wang
SJ, Zang LQ (2015) Curcumol induces apoptosis in SPC-A-1 human lung
adenocarcinoma cells and displays anti-neoplastic effects in tumor bearing mice. Asian Pac J Cancer Prev 16:2307–2312
40. Li J, Bian WH, Wan J, Zhou J, Lin Y, Wang JR, Wang ZX, Shen Q, Wang KM
(2014) Curdione inhibits proliferation of MCF-7 cells by inducing apoptosis. Asian Pac J Cancer Prev 15:9997–10001
41. Liu Y, Wang W, Fang B, Ma F, Zheng Q, Deng P, Zhao S, Chen M, Yang G, He
G (2013) Anti-tumor effect of germacrone on human hepatoma cell lines
through inducing G2/M cell cycle arrest and promoting apoptosis. Eur J
Pharmacol 698:95–102
42. Wang J, Huang F, Bai Z, Chi B, Wu J, Chen X (2015) Curcumol inhibits
growth and induces apoptosis of colorectal cancer LoVo cell line via IGF1R and p38 MAPK pathway. Int J Mol Sci 16:19851–19867
43. Link A, Balaguer F, Shen Y, Lozano JJ, Leung HC, Boland CR, Goel A (2013)
Curcumin modulates DNA methylation in colorectal cancer cells. PLoS
One 8:e57709
44. Shi H, Tan B, Ji G, Lu L, Cao A, Shi S, Xie J (2013) Zedoary oil (Ezhu You)
inhibits proliferation of AGS cells. Chin Med 8:13
Wang et al. Chemistry Central Journal (2016) 10:32
45. Ulrich-Merzenich G, Panek D, Zeitler H, Wagner H, Vetter H (2009) New
perspectives for synergy research with the “omic”-technologies. Phytomedicine 16:495–508
46. Zhou G, Fu L, Li X (2015) Optimisation of ultrasound-assisted extraction
conditions for maximal recovery of active monacolins and removal of
toxic citrinin from red yeast rice by a full factorial design coupled with
response surface methodology. Food Chem 170:186–192
47. Derossi A, Severini C, Del Mastro A, De Pilli T (2015) Study and optimization of osmotic dehydration of cherry tomatoes in complex solution by
response surface methodology and desirability approach. LWT-Food Sci
Technol 60:641–648
Page 14 of 14
48. Wang Y, Wu Z, Ke G, Yang M (2015) An effective vacuum assisted extraction method for the optimization of labdane diterpenoids from Andrographis paniculata by response surface methodology. Molecules 20:430–445
49. Shi W, Gao Y, Yang G, Zhao Y (2013) Conversion of cornstalk to bio-oil in
hot-compressed water: effects of ultrasonic pretreatment on the yield
and chemical composition of bio-oil, carbon balance, and energy recovery. J Agric Food Chem 61:7574–7582