Different applications of isosbestic points, normalized spectra and dual wavelength as powerful tools for resolution of multicomponent mixtures with severely overlapping spectra
Bạn đang xem bản rút gọn của tài liệu. Xem và tải ngay bản đầy đủ của tài liệu tại đây (1.93 MB, 15 trang )
Mohamed et al. Chemistry Central Journal (2017) 11:43
DOI 10.1186/s13065-017-0270-8
Open Access
RESEARCH ARTICLE
Different applications of isosbestic
points, normalized spectra and dual
wavelength as powerful tools for resolution
of multicomponent mixtures with severely
overlapping spectra
Ekram H. Mohamed1*, Hayam M. Lotfy3, Maha A. Hegazy2 and Shereen Mowaka1,4
Abstract
Background: Analysis of complex mixture containing three or more components represented a challenge for
analysts. New smart spectrophotometric methods have been recently evolved with no limitation. A study of different novel and smart spectrophotometric techniques for resolution of severely overlapping spectra were presented in
this work utilizing isosbestic points present in different absorption spectra, normalized spectra as a divisor and dual
wavelengths. A quaternary mixture of drotaverine (DRO), caffeine (CAF), paracetamol (PCT) and para-aminophenol
(PAP) was taken as an example for application of the proposed techniques without any separation steps. The adopted
techniques adopted of successive and progressive steps manipulating zero /or ratio /or derivative spectra. The
proposed techniques includes eight novel and simple methods namely direct spectrophotometry after applying
derivative transformation (DT) via multiplying by a decoding spectrum, spectrum subtraction (SS), advanced absorbance subtraction (AAS), advanced amplitude modulation (AAM), simultaneous derivative ratio ( S1DD), advanced ratio
difference (ARD), induced ratio difference (IRD) and finally double divisor–ratio difference-dual wavelength (DD-RDDW) methods.
Results: The proposed methods were assessed by analyzing synthetic mixtures of the studied drugs. They were also
successfully applied to commercial pharmaceutical formulations without interference from other dosage form additives. The methods were validated according to the ICH guidelines, accuracy, precision, repeatability, were found to be
within the acceptable limits.
Conclusion: The proposed procedures are accurate, simple and reproducible and yet economic. They are also
sensitive and selective and could be used for routine analysis of complex most of the binary, ternary and quaternary
mixtures and even more complex mixtures.
Keywords: Derivative transformation, Advanced ratio difference, Induced ratio difference normalized spectra,
Isosbestic point, Dual wave length
Background
Drotaverine (DRO) hydrochloride, 1-[(3,4-Diethoxy phenyl)
methylene]-6,7-diethoxy-1,2,3,4-tetrahydroisoquinoline
*Correspondence:
1
Pharmaceutical Analytical Chemistry Department, Faculty of Pharmacy,
The British University in Egypt, El‑Sherouk City 11837, Egypt
Full list of author information is available at the end of the article
hydrochloride [1, 2] is non-anticholinergic antispasmodic
drug.
Caffeine (CAF) 1,3,7-Trimethylpurine-2,6-Dione, is an
adenosine receptor antagonist and adenosine 3′,5′cyclic
monophosphate (cAMP) phosphodiesterase inhibitor,
thus levels of cAMP increase in cells following treatment
with caffeine [2, 3].
© The Author(s) 2017. This article is distributed under the terms of the Creative Commons Attribution 4.0 International License
( which permits unrestricted use, distribution, and reproduction in any medium,
provided you give appropriate credit to the original author(s) and the source, provide a link to the Creative Commons license,
and indicate if changes were made. The Creative Commons Public Domain Dedication waiver ( />publicdomain/zero/1.0/) applies to the data made available in this article, unless otherwise stated.
Mohamed et al. Chemistry Central Journal (2017) 11:43
Page 2 of 15
Paracetamol (PCT) N-(4-hydroxyphenyl) acetamide,
also known as acetaminophen PAR is widely used as
analgesic and antipyretic for the relief of fever, headaches
and minor pains. It is a major ingredient in numerous
cold and flu remedies [4, 5].
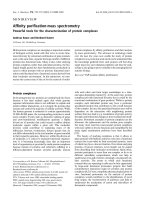
Para-aminophenol (PAP), is the primary impurity of
PCT, it occurs in PCT pharmaceutical preparations as a
consequence of both synthesis and degradation during
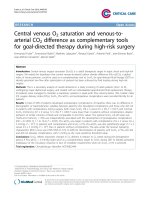
storage [6, 7]. The quantity of PAP must be strictly controlled as it is reported to have nephrotoxic and teratogenic effects [7]. The structures of the studied drugs are
presented in Fig. 1.
The analysis of mixtures containing DRO, CAF and PCT
was described in few analytical reports. These reports proposed spectrophotometric [8, 9], TLC [9] and high performance liquid chromatography (HPLC) [8, 10, 11].
While literature survey reveals that no methods have
been reported for the simultaneous determination of the
four components under study.
The aim of this work was to develop novel spectrophotometric methods based on smart original mathematical
techniques for resolving the quaternary mixture of DRO,
CAF, PCT and PAP with spectral interfering problems.
For simultaneous determination of ternary mixtures
two novel methods were newly proposed namely ratio
difference-isosbestic points (RD-ISO) and induced ratio
difference (IRD).
Ratio difference-isosbestic points (RD-ISO) is considered as an extension to ratio difference method [17]. The
method requires the presence of two isosbestic points
(λiso1 and λiso2) between two drugs for its successful application as discussed briefly.
If a ternary mixture X, Y and Z where (X and Y) shows
two isoabsorptive points, Z can be determined by dividing the spectrum of the ternary mixture by normalized
spectrum of X′.
The ratio spectra obtained using X′ as a divisor generated a constant value of its concentration along the whole
spectra.
Suppose the amplitudes of the ratio spectra of the ternary mixture at the two selected wavelength (λiso1 and
λiso2 between X and Y) are P1 and P2, respectively, then;
Theoretical background
Derivative transformation [12], spectrum subtraction
[13], amplitude factor [14], advanced absorbance subtraction method (AAS) [15], advanced amplitude modulation method (AAM) [15] and simultaneous derivative
ratio (S1DD) [16] are well developed method that were
successfully adopted for resolution of overlapped spectra
of binary mixtures.
By subtraction
Fig. 1 Structural formulae for a drotaverine, b caffeine, c paracetamol, d para-aminophenol
P1 = [Cx ] + [CY ] + [az1 Cz ]/ax
(1)
P2 = [Cx ] + [CY ] + [az2 Cz ]/ax
(2)
P1 − P2 =
az Cz
1−
ax
az Cz
2
ax
(3)
The concentration of Z is calculated using the regression equation representing the linear correlation between
the differences of ratio spectra amplitudes at the two
selected wavelengths to the corresponding concentrations of drug (Z).
While IRD method is a combination between induced
dualwavelength [18] and amplitude modulation theory.
All what it need is the extension of one of the three drugs
over the other two as summarized briefly.
The ratio spectra obtained using the normalized spectrum of the more extended component Z′ as a divisor
generated a constant value of its concentration along the
whole spectra that can be measured from the extended
region parallel to the X axis.
The constant value of Z was then subtracted from the
total ratio spectrum of the ternary mixture to obtain the
ratio spectra of the other two components X and Y.
For determination of X, two wave lengths were
selected in the ratio spectra of the resolved binary mixture. A remarkable amplitude difference between the
two selected wavelengths in the ratio spectra of pure X
should be present. To cancel the contribution of Y at the
two selected wavelengths upon obtaining the ratio difference, the equality factor of pure ratio spectra of Y at these
wavelengths (FY) is calculated.
Mohamed et al. Chemistry Central Journal (2017) 11:43
Page 3 of 15
Pm1 = PX1 + PY1
at
1
(4)
Pm2 = PX2 + PY2
at
2
(5)
P2 =
aX CX
aY CY
+
+ constant
[aZ + aW ]2 [aZ + aW ]2
aY CY
aY CY
=
[aZ + aW ]1
[aZ + aW ]2
FY = PY1 /PY2
∴ PY1 = FY PY2
Then by subtraction
By substituting in Eq. (4)
P1 − P2 =
Pm1 = PX1 + FY PY2
(6)
By multiply Eq. (5) by FY
FY Pm2 = FY PX2 + FY PY2
(7)
And by calculating the difference, Eqs. (6, 7), FY PY2 will
be cancelled:
�P (Pm1 − FY Pm2 ) = AX1 − FY AX2
(8)
Equation (8) indicated that the amplitude difference of
the ratio spectra of the resolved binary mixture X, Y is
dependent only on X and independent on Y.
The concentration of Y is calculated using the same
procedure after calculating the equality factor of pure X
(FX) at the two chosen wavelengths for Y.
Finally another novel method for simultaneous determination of quaternary mixtures was proposed and
named double divisor-ratio difference-dual wave length
(DD-RD-DW). It considered as one of the new applications of double divisor [19] and an extension to the double divisor-ratio difference method (DD-RD) [20] by
coupling it with dual wavelength method.
For the determination of concentration of component
of interest by the DD-RD-DW method, the component
of interest shows a significant amplitude difference at two
selected wavelengths λ1 and λ2 where the two interfering
substances used as double divisor give constant amplitude as while the third one shows the same amplitude
values at these two selected wavelengths.
This can be summarized in the following equations.
If we have a mixture of four drugs (X, Y, Z and W),
dividing the spectrum of the quaternary mixture by the
sum of the normalized spectra of Z and W (Z′ + W′) as
a divisor, a constant value is generated in a certain region
of wavelengths.
Pm =
aX CX
aY CY
+
+ constant
aZ + aW
aZ + aW
(11)
(9)
Suppose the amplitudes at the two selected wavelength
are P1 and P2 at λ1 and λ2 (where Y has the same amplitude), respectively, then;
aX CX
aY CY
P1 =
+
+ constant
[aZ + aW ]1 [aZ + aW ]1
(10)
aX CX
aZ+ aW
1−
aX CX
aZ+ aW
2
The concentration of X is calculated using the regression equation representing the linear correlation between
the differences of ratio spectra amplitude at the two
selected wavelengths to the corresponding concentrations of drug (X).
Experimental
Reagents and chemicals
(a)Pure samples—drotaverine (DRO) was kindly supplied by Alexandria Pharmaceuticals and Chemical
Industries, Alexandria, Egypt. CAF and PCT were
kindly supplied by Minapharm Pharmaceutical Company, Cairo, Egypt. Para-aminophenol was purchased
from Sigma Aldrich, Germany. The purities were
found to be 100.25 ± 0.39, 99.56 ± 0.59, 99.98 ± 0.25
and 99.99 ± 0.39 for DRO, CAF, PCT and PAP
respectively.
(b)Market sample—Petro tablets, labelled to contain
40 mg (DRO)/400 mg (PCT)/60 mg (CAF), Soumadril Compound tablets labelled to contain 200 mg
Carisopradol (CAR)/160 mg (PCT)/32 mg (CAF)
and Panadol Extra tablets labelled to contain 500 mg
(PCT)/65 mg (CAF), were purchased from the Egyptian market.
(c)Solvents—Spectroscopic analytical grade methanol
(S.d.fine-chem limited-Mumbai).
(d)Stock standard solutions—(1 mg/mL) stock solution
of each of DRO, CAF, PCT and PAP in methanol
were prepared. The prepared solutions were found to
be stable without any degradation when stored in the
dark in the refrigerator at 4° C for 1 week except for
PAP which should be freshly prepared.
(e)Working standard solutions—(50 μg/mL) working
solutions for DRO, CAF, PCT and PAP were prepared from (1 mg/mL) stock solutions by appropriate
dilutions with methanol.
Apparatus
Spectrophotometric measurements were carried out on
JASCO V-630 BIO Double-beam UV–Vis spectrophotometer (S/N C367961148), using 1.00 cm quartz cells.
Scans were carried out in the range from 200 to 400 nm
at 0.1 nm intervals. Spectra Manager II software was used.
Mohamed et al. Chemistry Central Journal (2017) 11:43
Procedures
Construction of calibration graphs
Aliquots equivalent to 10–260 μg DRO, 15–260 μg CAF,
10–240 μg PCT and 10–300 μg PAP were accurately
transferred from their working standard solutions into
four separate series of 10-mL volumetric flasks then completed to volume with the same solvent. The spectra of
the prepared standard solutions were scanned from 200
to 400 nm and stored in the computer against methanol
as a blank.
For DRO A calibration graph was constructed relating the absorbance of zero order spectra (D0) of DRO at
228.5 nm versus the corresponding concentrations.
The stored ( D0) spectra of DRO were divided by (a) the
normalized spectrum of CAF, (b) the normalized spectrum of DRO, (c) sum of normalized spectrum of CAF
and PAP, separately. Calibration graphs were constructed
by plotting (a) the difference between the amplitudes at
[263.6 and 291.8 nm], (b) the constant values measured
from 310–400 nm, (c) the difference between the amplitudes at [315 and 336 nm] versus the corresponding DRO
concentrations, respectively.
For CAF Two calibration graphs were constructed
using the zero order spectra ( D0). The first one related the
absorbance at 263.6 nm versus the corresponding CAF
concentrations. While the second one related the difference between the absorbance at 231.5 and 263.6 nm versus the absorbance at 263.6 nm.
The (D0) spectra of CAF were divided by the normalized spectrum of PCT, and then two calibration graphs
were constructed. The first was plotted between the
amplitudes difference at [240 and 263.6 nm] versus amplitudes at 263.6 nm where as the second graph between the
amplitudes difference at [233.8 and 273.7 nm] versus the
corresponding CAF concentrations.
The stored (D0) spectra of CAF were also divided by
the normalized spectrum of DRO and the obtained ratio
spectra were manipulate for construction of another 2
calibration graphs. A graph was directly constructed
between the amplitude difference at 265 and 295 nm
multiplied by (5.58) versus the corresponding CAF concentrations and the regression equations were computed. The first derivative of the above ratio spectra was
then recorded using scaling factor = 1 and ∆λ = 8 and
a calibration graph between the amplitude at 219 nm
versus the corresponding concentrations of CAF was
constructed.
For PCT A calibration graph was constructed relating
the absorbance of zero order spectra (D0) of CAF or PCT
at 263.6 nm versus the corresponding concentrations.
Page 4 of 15
The stored (D0) spectra of PCT were divided by (a)
the normalized spectrum of CAF, (b) normalized spectrum of DRO and (c) the sum of normalized spectrum of
DRO and CAF, separately. Three calibration graphs were
constructed by plotting (a) the amplitude differences
between 219.2 and 252 nm, (b) amplitude differences
between 257 and 230 nm multiplied by (4.73), (c) amplitude differences between 261.2 and 277.2 nm versus the
corresponding PCT concentrations, respectively.
For PAP The zero order spectra (D0) of PAP were
scanned and manipulated to obtain two calibration
graphs. Firstly, they were divided by the sum of normalized spectrum of DRO and CAF, to construct a calibration
graph was constructed between the amplitude differences
at 311 and 318 nm versus the corresponding PAP concentrations. Then their first derivative spectra (D1) were
recorded using scaling factor = 10 and ∆λ = 8 and a calibration graph was constructed relating the amplitude of
the obtained (D1) spectra of PAP at 314.5 nm versus the
corresponding concentrations.
Application to laboratory prepared mixtures
Into a series of 10 mL volumetric flask, accurate aliquots
of DRO, CAF, PCT and PAP were transferred from their
working standard solutions to prepare five mixtures containing different ratios of the cited drugs. The volumes
were completed with methanol.
Each drug in the quaternary mixture can be determined and analysed by more than one method using different approaches.
DRO was determined by four different methods; direct
spectrophotometric method after derivative transformation, ratio difference-isosbestic points, induced
ratio difference and double divisor-ratio difference-dual
wavelength;
CAF was determined by five different methods;
advanced absorbance subtraction, advanced amplitude
modulation, simultaneous derivative ratio, ratio difference-isosbestic points and induced ratio difference.
PCT was determined using six different methods;
advanced absorbance subtraction, advanced amplitude
modulation, simultaneous derivative ratio, ratio difference-isosbestic points, induced ratio difference and double divisor-ratio difference-dual wavelength.
While PAP was determined adopting two methods;
first derivative spectrophotometric method and double
divisor-ratio difference-dual wavelength.
Ten tablets of each of P
etro®, Soumadril Compound® and
®
Panadol Extra formulations were accurately weighed,
finely powdered and homogenously mixed. A portion
Application to pharmaceutical dosage form
Mohamed et al. Chemistry Central Journal (2017) 11:43
Page 5 of 15
Results and discussion
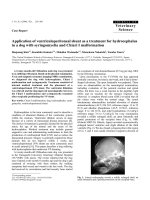
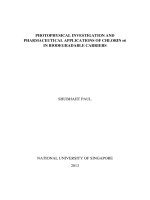
By scanning the absorption spectra of DRO, CAF, PCT
and PAP in the solution of dosage forms in methanol,
severely overlapped spectral bands were observed in
the wavelength region of 200–300 nm; which hindered
their direct determination (Fig. 2). DRO showed extension over the PAP but with low absorptivity, in addition
that PAP may exhibit a contribution at DRO extended
region in high concentrations, and although PAP was
more extended than CAF and PCT after 315 nm, but it
can only be measured at a shoulder which could decrease
sensitivity especially at high concentration of PCT which
is the major component in all the proposed dosage forms.
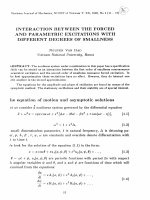
Upon derivatization using scaling factor = 10 and
∆λ = 8 nm, the contribution of PAP at the extended
region of DRO was completely cancelled as shown in
Fig. 3, but it was difficult to accurately measure the
amplitude of DRO at its extended region due to its low
absorptivity, so derivative transformation was adopted
to overcome this problem. The derivative transformation
was applied to obtain the (D0) of DRO by dividing the
spectrum of the quaternary mixture by the first derivative of normalized spectrum of DRO (d/dλ) [aDRO], and
then the constant generated in the region 360–380 nm
was multiplied by the normalized spectrum of DRO
[aDRO] where the absorbance of DRO can be measured at
its 228.5 nm (λmax) giving maximum sensitivity and minimum error as shown in Fig. 4.
Also when the generated constant was multiplied by
the first derivative of normalized spectrum of DRO used
as divisor, the (D1) spectrum of DRO in the mixture was
obtained and then subtracted from the total (D1) of the
quaternary mixture via spectrum subtraction technique
the spectrum of the first derivative of the resolved ternary
mixture of CAF, PCT and PAP was obtained and PAP was
determined by measuring the peak amplitude at 314.3 nm
where CAF and PAP showed no contribution as shown in
Fig. 3. Similarly, derivative transformation technique was
adopted to obtain the D0 of PAP by dividing the spectrum
of the above resolved ternary mixture by the first derivative of normalized spectrum of PAP (d/dλ) [aPAP], and
then the constant generated in the region 310–330 nm
was multiplied by the normalized spectrum of PAP [ aPAP].
2
Amplitude
of the powder equivalent to 5 mg PCT were separately
weighed from
Petro® (A), Soumadril
Compound® (B)
®
and Panadol E
xtra (C), respectively and dissolved in
methanol by shaking in ultrasonic bath for about 30 min.
The solution was filtered into a 100 mL measuring flask
and the volume was completed with the same solvent.
2 mL were accurately transferred from the above prepared solutions of formulations (A, B) and 4 mL were
accurately transferred from the solution of formulation
(C), to three separate 10-mL volumetric flasks. The concentration of each drug was calculated using its specified methods. When carrying out the standard addition
technique, different known concentrations of pure standard of each drug were added to the pharmaceutical dosage form before proceeding in the previously mentioned
procedure.
314.3nm
1
0
-1
200
250
300
350
400
Wavelength [nm]
Fig. 3 First order absorption spectra of 10 μg/mL DRO (solid line),
10 μg/mL PCT (dotted line), 10 μg/mL CAF (dashed line) and 10 μg/mL
PAP (dashed dotted line)
2
2
1.5
1
Abs
Abs
1.5
0.5
1
0.5
0
200
250
300
350
400
Wavelength [nm]
Fig. 2 Zero order absorption spectra of 10 μg/mL DRO (solid line),
10 μg/mL PCT (dotted line), 10 μg/mL CAF (dashed line) and 10 μg/mL
PAP (dashed dotted line)
0
200
250
300
350
400
Wavelength [nm]
Fig. 4 Zero order absorption spectra of DRO in mixtures (2, 6, 10, 12,
and 20 μg/mL)
Mohamed et al. Chemistry Central Journal (2017) 11:43
Page 6 of 15
Advanced absorbance subtraction
2
1.5
Abs
Advanced amplitude modulation method (AAM)
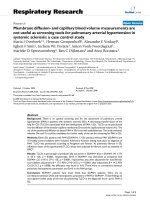
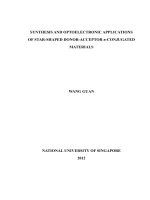
As shown in (Fig. 5), the absorption spectra of CAF and
PCT in methanol shows isoabsorptive point at 263.6 nm
(aCAF = aPCT) which is retained at the same place in the
ratio spectrum of CAF using the normalized spectrum of
PCT as a divisor (Fig. 6a).
At first a regression equation was formulated representing the linear relationship between the amplitudes
difference of different pure CAF concentrations at (263.6–
240 nm) versus its corresponding amplitude 263.6 nm.
The AAM method was applied by dividing the spectrum
of the binary mixture by the normalized divisor of PCT to
obtain the ratio spectra (Fig. 6b). The amplitudes difference of the obtained ratio spectrum at 263.6 nm (λiso) and
240 nm were recorded (∆Pm). And by substituting in the
above regression equation previously formulated postulated amplitude of CAF alone at 263.6 nm (λiso).
Subtracting the postulated amplitude of CAF at λiso
from the practically recorded amplitude [ PRecorded] of the
binary mixture at λiso we get that corresponding to PCT.
The advantage of this method over the advanced
absorbance subtraction method is the complete
a
50
40
30
20
10
0
210
220
240
260
280
260
280
Wavelength [nm]
b
Amplitude
The absorption spectra of CAF and PCT are severely
overlapped in the wavelength region of 200–300 nm and
intersect at 3 isoabsorptive point 226.9, 263.6 and 292 nm
where the mixture of the drugs acts as a single component and give the same absorbance value as pure drug.
The absorption spectra of the standard solutions of
CAF with different concentrations were recorded in the
wavelength range of 200–400 nm. Two wavelengths are
selected (λiso of CAF 263.6 nm and λ2 = 231.5 nm) where
PCT shows equal absorbance at these wavelengths. The
absorbance difference ∆A (Aiso – A231.5) between two
selected wavelengths on the mixture spectra is directly
proportional to the concentration of CAF; while for PCT
the absorbance difference inherently equals to zero. A
calibration graph is constructed for pure CAF representing the relationship between (Aiso – A2) and A
iso and a
regression equation was computed.
By substituting the absorbance difference ∆A
(Aiso – A2) between the two selected wavelengths of the
mixture spectrum in the above equation, the absorbance
Apostulated corresponding to the absorbance of CAF only
at Aiso was obtained.
Subtracting the postulated absorbance of CAF at Aiso
from the practically recorded absorbance [ARecorded] at
Aiso to get that corresponding to PCT.
The concentrations of CAF and PCT were calculated
using the corresponding unified regression equation
(obtained by plotting the absorbance of the zero order
spectra of CAF or PCT at λiso 263.6 nm against the corresponding concentrations).
Amplitude
The obtained D0 of PAP was successively subtracted from
the D0 spectrum of the resolved ternary mixture to get the
D0 spectrum of binary mixture of CAF and PCT.
Three different novel, simple and accurate methods
were adopted for simultaneous determination of CAF
and PCT in presence of each other either in bulk, in different dosage forms as binary mixture and in presence of
other components after their resolutions.
55
40
20
1
0
210
0.5
0
200
220
240
Wavelength [nm]
250
300
350
400
Wavelength [nm]
Fig. 5 Zero order absorption spectra of 10 μg/mL PCT (dotted line)
and CAF (dashed line) showing 3 isoabsorptive points at 226.9 263.6
and 292 nm and the binary mixture of CAF and PCT 10 μg/mL of
each
Fig. 6 a Ratio absorption spectra of 10 μg/mL PCT (dotted line),
10 μg/mL CAF (dashed line) and the binary mixture of CAF and PCT
5 μg/mL of each (dotted straight line) obtained after division by the
normalized spectra of PCT. b Ratio absorption spectra of 10 μg/mL
PCT (dotted line), 10 μg/mL CAF (dashed line) and the binary mixture
of CAF and PCT 10 μg/mL of each (dotted straight line) obtained after
division by the normalized spectra of PCT
Mohamed et al. Chemistry Central Journal (2017) 11:43
Page 7 of 15
cancelling of the interfering component in the form of
constant where the difference at any two points along its
ratio spectrum will be equal to zero. So there is no need
for critical selection of wavelengths which leads to highly
reproducible and robust results.
Simultaneous derivative ratio
Salinas et al. [21] developed derivative ratio spectrophotometry (1DD) method to remove the interference of one
component and to determine the other. This method was
then modulated to be simultaneous by coupling with
amplitude modulation theory to generate simultaneous
derivative ratio method (S1DD) [16]. In S1DD after division by the normalized spectra of PCT and before the derivatization step took place, the amplitude at isoabsorptive
point (263.6 nm) was determined representing the actually concentration of CAF and/or PCT. Then derivative of
these ratio spectra was obtained to remove the constant
generated of PCT concentration in the division spectrum.
Figure 7 shows the obtained derivative ratio spectra of
different concentrations of CAF using scaling factor = 1
and ∆λ = 8 nm. A correlation between the peak amplitudes at 219 nm and the corresponding CAF concentration was plotted from which its concentration could be
determined. The concentration of PCT was progressively
determined by subtraction of the obtained CAF concentration from the total concentration at isosbestic point
(λiso 263.6 nm) recorded before derivatization.
Then the difference between the amplitudes at the two
selected isosbestic points between CAF and PCT (263.6
and 291.8 nm) was directly proportional to DRO concentration only.
For determination of PCT, the difference between the
amplitude of the above ratio spectra obtained after dividing the spectrum of the ternary mixture by the normalized spectrum of CAF at the two selected isosbestic points
(219.2 and 252 nm) between CAF and DRO was corresponding to PCT concentration only as shown in Fig. 9a.
The same procedures were applied for determination of
CAF where the absorption spectrum of the mixture was
divided by the absorption spectrum of the normalized
spectra of PCT as divisor and the difference between the
amplitude at the two selected isosbestic points (233.8 and
273.7 nm) between DRO and PCT was corresponding to
CAF concentration only as shown in Fig. 9b.
Induced ratio difference method
The concentration of DRO was determined using amplitude modulation method from the straight line parallel to
the x-axis in the extended region at 310–400 nm for DRO
as shown in Fig. 10a. The obtained constants of DRO are
then subtracted from the total ratio spectra of the mixture obtaining the ratio spectra of binary mixtures of
a
For simultaneous determination of ternary mixture
Ratio difference‑isosbestic points
2
The zero order of the studied drugs showed the presence
of three isoabsorpative points between CAF and PCT as
shown in Fig. 5, three isoabsorptive points are between
DRO and CAF (Fig. 8a) while another two isoabsorptive
points are between DRO and PCT (Fig. 8b).
For determination of DRO the absorption spectrum of
the mixture was divided by the absorption spectrum of
the normalized spectra of CAF, the obtained ratio spectrum is shown in Fig. 9a.
Abs
1.5
1
0.5
0
200
250
300
350
400
350
400
Wavelength [nm]
b2
1.5
Abs
15
1
Amplitude
10
0.5
0
-10
-12
205
0
200
220
240
260
280
Wavelength [nm]
Fig. 7 First derivative of ratio spectra of CAF (2–26 μg/mL) using
normalized PCT spectrum as a divisor
300
250
300
Wavelength [nm]
Fig. 8 a Zero order absorption spectra of DRO (solid line) and CAF
(dashed line) showing three isoabsorptive points at 219.2, 252 and
288 nm 10 μg/mL of each. b Zero order absorption spectra of DRO
(solid line) and PCT (dotted line) showing two isoabsorptive points at
233.8 and 273.7 nm 10 μg/mL of each
Mohamed et al. Chemistry Central Journal (2017) 11:43
a
Page 8 of 15
200
Amplitude
150
100
50
0
200
220
240
260
280
300
Wavelength [nm]
b
100
Amplitude
80
60
40
20
0
200
220
240
260
280
300
Wavelength [nm]
Fig. 9 a Ratio spectra of DRO (solid line), CAF (dashed line), PCT
(dotted line) and their ternary mixture (dashed dotted line) containing 10 μg/mL of each using normalized CAF spectrum as a divisor.
b Ratio spectra of DRO (solid line), CAF (dashed line), PCT (dotted line)
and their ternary mixture (dashed dotted line) containing 10 μg/mL of
each using normalized PCT spectrum as a divisor
both CAF and PCT divided by normalized spectra of
DRO as shown in Fig. 10b.
By screening the ratio spectra of pure CAF divided by
the normalized spectra of DRO, two wavelengths were
selected, 265 and 295 nm, where 265 nm showed the
maximum peak in order to obtain maximum sensitivity.
To cancel the contribution of PCT at both selected wavelengths, induced dual wave length method was adopted
by calculating an equality factor for pure PCT at two
selected wave lengths of CAF (F = [P265 /P295 ] = 5.58)
as shown in Fig. 10b.
In order to determine of PCT, the same procedures
were applied as described for CAF. The two selected
wavelengths were 257 nm (maximum peak amplitude) and 230 nm. The factor that equalize the amplitude of CAF at the selected wavelengths was calculated
(F = [P257 /P230 ] = 4.73).
For simultaneous determination of quaternary mixture
Double divisor‑ratio difference‑dual wave length
For the successful application of the proposed method, it
is a must to obtain a constant region in the ratio spectra
Fig. 10 Ratio spectra of DRO (solid line), CAF (dashed line), PCT (dotted
line) and their ternary mixture (dashed dotted line) containing 10 μg/
mL of each using normalized DRO spectrum as a divisor. b Ratio
spectra of CAF (dashed line), PCT (dotted line) and their resolved binary
mixture (dashed dotted line) containing 10 μg/mL of each using normalized DRO spectrum as a divisor after subtraction of the obtained
constant
resulted after dividing the total spectrum of any two
drugs by the sum of their normalized spectra.
For determination of DRO, the spectra of quaternary
mixtures of DRO, CAF, PCT and PAP were divided by
the sum of the normalized spectra of both CAF and PAP
where a constant region from 300–340 nm was generated for CAF and PAP as shown in Fig. 11a. A correlation was obtained between the amplitude difference at
315 and 336 nm at which PCT have the same amplitude
(�PPCT = P1 − P2 = zero) and the corresponding DRO
concentration was plotted from which its concentration
could be determined as shown in Fig. 11b.
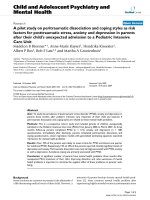
For determination of PCT and PAP, the spectra of
quaternary mixtures were divided by the sum of normalized spectra of both DRO and CAF, where constant
regions at 260–280 nm and at 307–325 nm for DRO and
CAF were obtained as shown in Fig. 12a. A correlation
was obtained between the amplitude difference at 261.2
and 277.2 nm at which PAP have the same amplitude
(�PPAP = P1 − P2 = zero) and the corresponding PCT
concentration was plotted from which its concentration
could be determined as shown in Fig. 12b. While for PAP
the correlation was obtained between the amplitude difference at 311 and 318 nm at which PCT have the same
Mohamed et al. Chemistry Central Journal (2017) 11:43
Page 9 of 15
15
a
10
Abs
30
Amplitude
5
20
0
300
310
320
330
340
Wavelength [nm]
10
0
200
250
300
350
400
Wavelength [nm]
Amplitude
b
Wavelength [nm]
Fig. 11 a Ratio spectra of three binary mixtures of CAF and PAP in
different concentrations using the sum of normalized spectra of CAF
and PAP as double divisor showing the obtained constant region.
b Ratio spectra of DRO (solid line), binary mixture of CAF and PAP
(dashed line), PCT (dotted line) and their quaternary mixture (dashed
dotted line), 5 μg/mL each using the sum of normalized spectra of
CAF and PAP as double divisor
amplitude (�PPCT = P1 − P2 = zero) and the corresponding PAP concentration was plotted from which its
concentration could be determined as shown in Fig. 12b.
The method failed in determination of CAF. The main
disadvantage of this method is the restriction in the
choice of the selected wavelengths which are restricted to
those wavelengths with constant absorbance of the interfering substance.
The proposed spectrophotometric methods were
compared to a recently reported HPLC method [10]
in which a separation was achieved on a C
18 column
(250 mm × 4.6 mm, 5 μm particle size), using methanol and 0.02 M phosphate buffer, pH 4.0 (50:50, v/v) as
a mobile phase and UV detection at 220 nm. The chromatographic method showed better sensitivity where
concentrations up to 0.5 µg/mL of each of DRO, CAF
and PCT could be quantified. While the proposed novel
spectrophotometric methods showed wider range. In
addition the presented methods were capable to determine the concentration of PAP which is the main degradation products and synthetic impurity of PCT and
thus could be considered as stability indicating methods.
Also it needs no tedious conditions optimization as that
required for the chromatographic method. The proposed
spectrophotometric methods are also considered to be
fast and time saving where the analysis of the quaternary
or the ternary mixture takes few seconds once calibration
graphs were constructed and regression equations are
computed where all the reported chromatographic techniques needs at least 10 min in a single run to resolve the
ternary mixture.
Method validation
The proposed spectrophotometric methods were validated in compliance with the ICH guidelines [22], as
shown in Table 1.
The specificity of the proposed methods was assessed
by the analysis of laboratory prepared mixtures containing different ratios of the drugs, where satisfactory results
were obtained over the calibration range as shown in
Table 2. The proposed methods were also applied for the
determination of the drugs in Petro, Soumadril Compound and Panadol Extra tablets. The validity of the
proposed methods was further assessed by applying the
standard addition technique as presented in Table 3. In
Soumadril Compound, Carisopradol which is an open
aliphatic structure doesn’t show any interference, therefore the mixture acts as a binary mixture of CAF and
PCT.
Statistical analysis
Table 4 showed statistical comparisons of the results
obtained by the proposed methods and reported method
for DRO [23], and official methods for CAF [24] and PCT
[25]. The calculated t and F values were less than the
theoretical ones indicating that there was no significant
difference between them with respect to accuracy and
precision.
Conclusions
In this work more than eight novel and smart spectrophotometric methods were developed and validated for
the resolution of the quaternary mixtures either successively or progressively. Drotaverine, caffeine, paracetamol
and para-aminophenol, the main degradation product
and synthetic impurity of Paracetamol quaternary mixture was taken as a model for application of the proposed
methods.
Mohamed et al. Chemistry Central Journal (2017) 11:43
20
20
20
15
15
10
15
10
5
5
0
260
Amplitude
Abs
Abs
a
Page 10 of 15
265
270
275
Wavelength [nm]
280
0
305
310
315
Wavelength [nm]
320
325
10
5
0
200
250
300
350
400
Wavelength [nm]
b
20
20
Abs
20
10
Abs
Abs
15
5
0
260
265
270
Wavelength [nm]
275
280
10
10
-1
200
-1
305
250
300
350
400
310
315
320
325
Wavelength [nm]
Wavelength [nm]
Fig. 12 a Ratio spectra of 4 binary mixtures of DRO and CAF in different concentrations using the sum of normalized spectra of DRO and CAF as
double divisor showing the obtained constant regions. b Ratio spectra of binary mixture of DRO and CAF (solid line), PCT (dotted line), PAP (dashed
single dotted line) and their quaternary mixture (dashed double dotted line), 5 μg/mL each using the sum of normalized spectra of CAF and PAP as
double divisor
It could be concluded that the proposed procedures are accurate, simple and reproducible and yet
economic. They are also sensitive and selective and
could be used for routine analysis of complex most
of the binary, ternary and quaternary mixtures and
even more complex mixtures. The proposed methods
also showed the significance of isoabsorptive point,
normalized spectra as divisors and dual wavelengths
as powerful tools that could either be used alone or
in combination with each other for the resolution
of severely overlapped spectra without preliminary
separation.
1.0000
99.74 ± 0.40
0.249
0.317
Correlation coefficient (r)
Accuracy
RSD%a
RSD%b
1.0000
100.15 ± 0.31
0.380
0.388
Correlation coefficient (r)
Accuracy
RSD%a
RSD%b
0.372
0.315
100.30 ± 0.20
1.0000
0.0091
0.9961
1–30
AAM
0.186
0.105
0.372
0.398
0.324
0.382
0.205
0.110
0.286
0.279
0.207
0.115
0.228
0.201
0.293
0.374
99.98 ± 0.19
0.9999
0.0087
0.945
DD-RD-DW
100.25 ± 0.02
1.0000
0.0091
0.9961
AAM
100.20 ± 0.21
1.0000
0.0175
1.9062
IRD
100.05 ± 0.14
1.0000
−0.0005
0.0525
1.5–26
100.01 ± 0.17
1.0000
0.0331
3.6059
RD-Iso
100.77 ± 0.37
0.9999
0.0158
0.3179
99.97 ± 0.25
1.0000
0.0091
0.9961
S DD
1
100.04 ± 0.29
1.0000
0.0036
1.0018
DD-RD-DW
0.223
0.187
0.231
0.177
0.857
0.727
0.211
0.110
100.08 ± 0.02
1.0000
−0.003
1.92333
IRD
0.860
0.732
100.146 ± 0.39
0.9999
0.0886
1.8265
DD-RD-DW
99.96 ± 0.02
1.0000
−0.0043
2.7068
RD-Iso
101.81 ± 0.40
0.9999
0.0010
0.0213
D1
PAP
99.99 ± 0.01
1.0000
−0.0008
0.5027
S1DD
RSD% , RSD% : the intra-day, inter-day respectively (n = 3) relative standard deviation of concentrations DRO (6, 14, 22 µg/mL), CAF (6, 14, 22 µg/mL), PCT (6, 14, 22 µg/mL) and PAP (10, 18, 26 µg/mL)
b
0.0005
Intercept
a
1–24
0.0525
Linearity (µg/mL)
0.315
0.248
99.67 ± 0.41
1.0000
0.0727
1.4648
Slope
AAS
PCT
0.0036
Intercept
Parameters
1–26
0.0722
Linearity (µg/mL)
IRD
AAS
RD-Iso
0
D
CAF
DRO
Slope
Parameters
Table 1 Assay parameters and method validation obtained by applying the proposed spectrophotometric methods for determination of DRO, CAF, PCT and PAP
Mohamed et al. Chemistry Central Journal (2017) 11:43
Page 11 of 15
2
2.6
0d
The ratio of the lab mixture in Petro tablets
6
2
1
2
4
100.10 ± 0.16
99.95
100.21
100.18
99.84
100.33
100.07
d
The ratio of the lab mixture of (CAF:PCT) in Panadol Extra tablets
The ratio of the lab mixture of (CAF:PCT) in Soumadril Compound tablets
c
20
10
8
4
Average of three determinations
b
a
Mean ± SD
20
12
0c
6
12
8
6
20
1
100.11
10
2
10
3
10
2b
20
AAS
PAP
CAF
DRO
PCT
PCT
Lab prepared mix.
2
1
99.83
100.13
99.42
Recovery%a
20
10
2
4
6
98.24
101.24
99.77 ± 1.09
2.6
0d
8
4
6
2
1
Concentration (µg/mL)
2
0c
20
10
D
Mean ± SD
8
20
6
20
12
10
12
3
10
2b
PAP
100.56 ± 0.49
99.91
100.89
99.98
100.37
100.92
100.65
101.21
AAM
99.56 ± 0.49
99.82
100.05
99.41
99.75
98.78
RD-Iso
99.46
100.21
100.19
100.00
100.00
100.23
99.98
100.27
S1DD
100.09 ± 0.20
99.76
100.31
100.12
99.94
100.34
100.07
100.11 ± 0.17
100.32
99.89
100.12
99.94
100.34
100.08
100.12
DD-RD-DW
100.17 ± 0.19 100.12 ±0.12
99.89
99.97
100.22
100.18
100.43
100.17
100.35
AAM
100.12
IRD
99.78 ± 0.21
100.07
99.97
99.78
99.62
99.94
99.65
100.19 ± 0.34
99.82
99.65
100.35
100.39
100.65
100.26
100.21
RD-Iso
99.78 ± 1.09
99.84
100.14
99.42
98.24
101.25
DD-RD-DW
100.22 ± 0.29
99.97
100.45
100.46
100.25
100.59
100.02
99.80
S DD
1
99.99 ± 0.53
99.84
99.96
99.87
99.33
100.95
IRD
AAS
PCT
0
CAF
DRO
Lab prepared mix.
DRO
CAF
Recovery%a
Concentration (µg/mL)
100.20
100.15
100.00
100.01
100.24
99.98
100.27
IRD
99.45 ± 1.40
98.02
99.42
99.65
98.80
102.38
98.66
99.20
D1
PAP
99.57 ± 0.99
100.75
99.38
98.00
98.80
100.68
99.61
99.85
DD-RD-DW
100.20 ± 0.52 100.12 ± 0.12
99.67
101.20
100.01
99.98
100.22
99.97
100.22
RD-Iso
Table 2 Determination of DRO, CAF, and PCT and PAP in laboratory prepared mixtures and pharmaceutical dosage forms by the proposed methods and results
obtained by standard addition technique
Mohamed et al. Chemistry Central Journal (2017) 11:43
Page 12 of 15
D0
DRO
Recovery%a
RD-Iso
IRD
CAF
DD-RD-DW AAS
99.82 ± 0.65
S1DD
IRD
PCT
AAS
AAM
100.38 ± 0.55 100.79 ± 0.84 100.54 ± 0.57 99.88 ± 0.47 100.17 ± 1.35 100.24 ± 0.82 99.57 ± 0.54
Standard addition,
mean ± SD
Average of three determinations
100.55 ± 0.36 100.05 ± 0.39 99.76 ± 0.78
Panadol Extra 500
(PCT)/65 (CAF),
mean ± SD
IRD
DD-RD-DW
100.64 ± 0.60 100.77 ± 0.55 100. 81 ± 0.68 100.47 ± 0.85
100.58 ± 0.61 101.03 ± 0.53 100.85 ± 0.47 100.75 ± 0.62
100.78 ± 1.30 100.84 ± 0.64 100.58 ± 0.59 100.59 ± 0.72
100.08 ± 0.45 100.19 ± 0.16 100.05 ± 0.27
RD-Iso
99.86 ± 0.57
100.34 ± 0.68 100. 08 ± 0.78 100.29 ± 0.61
99.68 ± 0.73 100.08 ± 0.31 100.14 ± 0.58 100.01 ± 0.82 100.22 ± 0.30 100.27 ± 0.28 100.32 ± 0.71 100.54 ± 0.25
100.48 ± 1.35 99.30 ± 0.32
101.08 ± 0.76 101.23 ± 0.43 100.88 ± 0.59 99.63 ± 0.85 99.57 ± 1.21
99.85 ± 0.05
Standard addition,
mean ± SD
99.96 ± 1.71
100.76 ± 0.49 100.02 ± 0.51 100.01 ± 0.51 99.86 ± 0.46 100.01 ± 0.41 100.20 ± 0.62 99.52 ± 0.43
a
S1DD
99.72 ± 0.79 99.83 ± 0.70 100.14 ± 0.21 100.18 ± 0.58 99.63 ± 0.40
RD-Iso
99.63 ± 0.22 99.70 ± 0.35 99.27 ± 0.16 99.57 ± 0.44 101.61 ± 0.97 100.98 ± 0.35 100.32 ± 0.21 99.51 ± 1.80 98.98 ± 1.66
99.90 ± 0.78
AAM
Soumadril Comp. 200
(CAR)/160 (PCT)/32
(CAF), mean ± SD
Standard addition,
mean ± SD
Petro 40(DRO)/
99.79 ± 0.48 99.93 ± 0.57 99.91 ± 0.30 99.80 ± 0.49 99.01 ± 0.81
400(PCT)/60
(CAF), mean ± SD
Pharmaceutical
dosage form
Table 3 Determination of DRO, CAF, and PCT and PAP in pharmaceutical dosage forms by the proposed methods and results obtained by standard addition
technique
Mohamed et al. Chemistry Central Journal (2017) 11:43
Page 13 of 15
0.481
5
0.2304
1.663
1.515
RSD%
n
Variance
Student’s t
testd (2.306)
F valued
1.690
0.1609
0.0900
5
0.300
0.30
99.91
IRD
1.579
1.607
0.240
5
0.490
0.49
99.80
DD-RDDW
0.1521
5
0.389
0.39
100.25
d
5
0.780
0.78
99.90
AAM
5
0.651
0.65
99.82
S1DD
1.885
1.227
The values in the parenthesis are the corresponding theoretical values of t and F at P = 0.05
1.748
1.214
0.7774 0.6623
0.6561 0.6084 0.4225
5
0.818
0.81
99.01
AAS
Proposed methods
CAF
Direct UV spectrophotometric method, measuring the absorbance in water at 244 nm
Potentiometric titration using 0.1 M perchloric acid
b
c
2.136
1.036
0.324
5
0.570
0.57
99.93
RD-Iso
Reported
method
[23]a
Dualwavelength spectrophotometric method at 271.5 and 280.0 nm
0.48
a
99.79
SD
D0
Proposed methods
DRO
Mean
Values
5
0.701
0.70
99.83
IRD
1.793
1.408
0.3629 0.5281
0.6241 0.49
5
0.792
0.79
99.72
RDIso
0.3481
5
0.592
0.59
99.56
Official
method
[24]b
AAM
S1DD
5
0.578
0.58
5
0.402
0.40
5
0.449
0.45
100.08
1.417
1.096
5.382
2.560
0.7081 1.659
3.240
0.4344
2.441
0.1523
0.0256
5
0.159
0.16
100.19
RD-Iso IRD
0.0441 0.3364 0.1600 0.2025
5
2.097
0.21
100.14 100.18 99.63
AAS
Proposed methods
PCT
1.166
0.4254
0.0729
5
0.269
0.27
100.05
0.0625
5
0.250
0.25
99.98
Official
method
DD-RD-DW [25]c
Table 4 Statistical comparison for the results obtained by the proposed spectrophotometric methods, the reported method [23] for the analysis of DRO
and official methods [24, 25] for analysis of CAF and PCT
Mohamed et al. Chemistry Central Journal (2017) 11:43
Page 14 of 15
Mohamed et al. Chemistry Central Journal (2017) 11:43
Authors’ contributions
EHM collected the data, wrote the manuscript, made the practical work in the
lab, and put the theoretical background. HML put the theoretical background,
revised the manuscript, revised the results, and collected the data. MAH
revised the manuscript and the data, collected the data, and put the theoretical background. SHM revised the manuscript, revised the data and the figures,
and collected the data. All authors read and approved the final manuscript.
Author details
1
Pharmaceutical Analytical Chemistry Department, Faculty of Pharmacy, The
British University in Egypt, El‑Sherouk City 11837, Egypt. 2 Pharmaceutical
Analytical Chemistry Department, Faculty of Pharmacy, Cairo University, Kasr
El‑Aini Street, Cairo 11562, Egypt. 3 Pharmaceutical Chemistry Department,
Faculty of Pharmaceutical Science & Pharmaceutical Industries, Future University, Cairo 12311, Egypt. 4 Pharmaceutical Analytical Chemistry Department,
Faculty of Pharmacy, Helwan University, Ein Helwan, Cairo 11795, Egypt.
Competing interests
The authors declare that they have no competing interests.
Publisher’s Note
Springer Nature remains neutral with regard to jurisdictional claims in published maps and institutional affiliations.
Received: 7 September 2016 Accepted: 12 May 2017
References
1. Budavari S (2003) The merck index, 13th edn. Merck and Co Inc, Whitehouse Station
2. Sweetman SC (2009) Martindale: the complete drug reference, 33rd edn.
Pharmaceutical Press, London
3. Shafer SH, Phelps SH, Williams CL (1998) Reduced DNA synthesis and
cell viability in small cell lung carcinoma by treatment with cyclic AMP
phosphodiesterase inhibitors. Biochem Pharmacol 56:1229–1236
4. Fredholm BB, Battig K, Holmen J, Nehlig A, Zvatau EE (1999) Actions of
caffeine in the brain with special reference to factors that contribute to its
widespread use. Pharmacol Rev 51:83–88
5. Gilman AC, Rall TW, Nies AS, Tayor P (2001) Goodman and Gilman’s the
pharmacological basis of therapeutics, 10th edn. Pergamon Press, New
York
6. Nemeth T, Jankovics P, Nemeth-Palotas J, Koszegi-Szalai H (2008) Determination of paracetamol and its main impurity 4-aminophenol in analgesic
preparations by micellar electrokinetic chromatography. J Pharm Biomed
Anal 47:746–749
7. Dejaegher B, Bloomfield MS, Smeyers-Verbeke J, Vander Heyden Y (2008)
Validation of a flourimetric assay for 4-aminophenol in paracetamol
formulations. Talanta 75:258–265
8. El-Gindy A, Emara S, Shaaban H (2010) Validation and application of
chemometrics-assisted spectrophotometry and liquid chromatography
for simultaneous determination of two ternary mixtures containing
drotaverine hydrochloride. J AOAC Int 93:536–548
9. Metwally FH, El-Saharty YS, Refaat M, El-Khateeb SZ (2007) Application
of derivative, derivative ratio, and multivariate spectral analysis and
thin-layer chromatography–densitometry for determination of a ternary
mixture containing drotaverine hydrochloride, caffeine, and paracetamol.
J AOAC Int 90:391–404
Page 15 of 15
10. Belal FF, Sharaf El-Din MK, Tolba MM, Elmansi H (2015) Determination of
two ternary mixtures for migraine treatment using HPLC method with
ultra violet detection. Sep Sci Tech 50:592–603
11. Issa YM, Hassoun ME, Zayed AG (2012) Simultaneous determination of
paracetamol, caffeine, domperidone, ergotamine tartrate, propyphenazone, and drotaverine HCl by high performance liquid chromatography. J
Liq Chromat Rel Tech 35:2148–2161
12. Hegazy MA, Lotfy HM, Rezk MR, Omran YR (2015) Novel spectrophotometric determination of chloramphenicol and dexamethasone in the
presence of non labeled interfering substances using univariate methods
and multivariate regression model updating. Spectrochim Acta A Mol
Biomol Spectrosc 140:600–613
13. Lotfy HM, Hegazy MA, Mowaka S, Mohamed EH (2015) Novel spectrophotometric methods for simultaneous determination of amlodipine,
valsartan and hydrochlorothiazide in their ternary mixture. Spectrochim
Acta A Mol Biomol Spectrosc 140:495–508
14. Lotfy HM, Tawakkol SM, Fahmy NM, Shehata MA (2013) Validated stability
indicating spectrophotometric methods for the determination of lidocaine hydrochloride, calcium dobesilate, and dexamethasone acetate in
their dosage forms. Anal Chem Lett 3:208–225
15. Lotfy HM, Hegazy MA, Rezk MR, Omran YR (2015) Comparative study of
novel versus conventional two-wavelength spectrophotometric methods for analysis of spectrally overlapping binary mixture. Spectrochim
Acta A Mol Biomol Spectrosc 148:328–337
16. Lamie NT, Yehia AM (2015) Development of normalized spectra manipulating spectrophotometric methods for simultaneous determination of
dimenhydrinate and cinnarizine binary mixture. Spectrochim Acta A Mol
Biomol Spectrosc 150:142–150
17. Lotfy HM, Hegazy MA (2013) Simultaneous determination of some
cholesterol-lowering drugs in their binary mixture by novel spectrophotometric methods. Spectrochim Acta Part A Mol Biomol Spectrosc
113:107–114
18. Lotfy HM, Saleh SS, Hassan NY, Salem H (2015) Novel two wavelength
spectrophotometric methods for simultaneous determination of binary
mixtures with severely overlapping spectra. Spectrochim Acta A Mol
Biomol Spectrosc 136:1786–1796
19. Dinç E (1999) The spectrophotometric multicomponent analysis of a
ternary mixture of ascorbic acid, acetylsalicylic acid and paracetamol by
the double divisor-ratio spectra derivative and ratio spectra-zero crossing
methods. Talanta 48:1145–1157
20. Hegazy MA, Eissa MS, Abd El-Sattar OI, Abd El-Kawy MM (2014) Determination of a novel ACE inhibitor in the presence of alkaline and oxidative
degradation products using smart spectrophotometric and chemometric
methods. J Pharm Anal 4:132–143
21. Salinas F, Nevado JJ, Mansilla AE (1990) A new spectrophotometric
method for quantitative multicomponent analysis resolution of mixtures
of salicylic and salicyluric acids. Talanta 37:347–351
22. International conference on harmonization (ICH), Q2B: validation of analytical procedures: methodology, vol 62. US FDA, Federal Register (1997)
23. Jain J, Patadia R, Vanparia D, Chauhan R, Shah S (2010) Dual wavelength
spectrophotometric method for simultaneous estimation of drotaverine
hydrochloride and aceclofenac in their combined tablet dosage form. Int
J Pharm Pharm Sci 2:76–79
24. British pharmacopoeia, vol. 11. Her Majesty’s Stationery Office, London
(2003)
25. The United States pharmacopeia, the national formulary: USP 29 NF 24
(2007)