Busulfan systemic exposure and its relationship with efficacy and safety in hematopoietic stem cell transplantation in children: A meta-analysis
Bạn đang xem bản rút gọn của tài liệu. Xem và tải ngay bản đầy đủ của tài liệu tại đây (1.06 MB, 11 trang )
Feng et al. BMC Pediatrics
(2020) 20:176
/>
REVIEW
Open Access
Busulfan systemic exposure and its
relationship with efficacy and safety in
hematopoietic stem cell transplantation in
children: a meta-analysis
Xinying Feng1,3, Yunjiao Wu1,3, Jingru Zhang1, Jiapeng Li1,4, Guanghua Zhu2, Duanfang Fan1,3,
Changqing Yang3* and Libo Zhao1*
Abstract
Background: Busulfan (Bu) is a key component of several conditioning regimens used before hematopoietic stem
cell transplantation (HSCT). However, the optimum systemic exposure (expressed as the area under the
concentration-time curve [AUC]) of Bu for clinical outcome in children is controversial.
Methods: Research on pertinent literature was carried out at PubMed, EMBASE, Web of science, the Cochrane
Library and ClinicalTrials.gov. Observational studies were included, which compared clinical outcomes above and
below the area under the concentration-time curve (AUC) cut-off value, which we set as 800, 900, 1000, 1125, 1350,
and 1500 μM × min. The primary efficacy outcome was notable in the rate of graft failure. In the safety outcomes,
incidents of veno-occlusive disease (VOD) were recorded, as well as other adverse events.
Results: Thirteen studies involving 548 pediatric patients (aged 0.3–18 years) were included. Pooled results showed
that, compared with the mean Bu AUC (i.e., the average value of AUC measured multiple times for each patient) of
> 900 μM × min, the mean AUC value of < 900 μM × min significantly increased the incidence of graft failure (RR =
3.666, 95% CI: 1.419, 9.467). The incidence of VOD was significantly decreased with the mean AUC < 1350 μM × min
(RR = 0.370, 95% CI: 0.205–0.666) and < 1500 μM × min (RR = 0.409, 95% CI: 0182–0.920).
Conclusions: In children, Bu mean AUC above the cut-off value of 900 μM × min (after every 6-h dosing) was
associated with decreased rates of graft failure, while the cut-off value of 1350 μM × min were associated with
increased risk of VOD, particularly for the patients without VOD prophylaxis therapy. Further well-designed
prospective and multi centric randomized controlled trials with larger sample size are necessary before putting our
result into clinical practices.
Keywords: Busulfan, Area under the concentration-time curve, Efficacy, Veno-occlusive disease, Meta-analysis
* Correspondence: ;
3
School of Basic Medicine and Clinical Pharmacy, China Pharmaceutical
University, Nanjing 211198, China
1
Clinical Research Center, Beijing Children’s Hospital, Capital University of
Medical Sciences, Beijing 100045, China
Full list of author information is available at the end of the article
© The Author(s). 2020 Open Access This article is licensed under a Creative Commons Attribution 4.0 International License,
which permits use, sharing, adaptation, distribution and reproduction in any medium or format, as long as you give
appropriate credit to the original author(s) and the source, provide a link to the Creative Commons licence, and indicate if
changes were made. The images or other third party material in this article are included in the article's Creative Commons
licence, unless indicated otherwise in a credit line to the material. If material is not included in the article's Creative Commons
licence and your intended use is not permitted by statutory regulation or exceeds the permitted use, you will need to obtain
permission directly from the copyright holder. To view a copy of this licence, visit />The Creative Commons Public Domain Dedication waiver ( applies to the
data made available in this article, unless otherwise stated in a credit line to the data.
Feng et al. BMC Pediatrics
(2020) 20:176
Background
Hematopoietic stem cell transplantation (HSCT) is
widely used for the treatment of various malignancies
and inherited disorders diseases. High-dose busulfan
(Bu) as an alternative to total body irradiation in many
pre-transplant conditioning regimens used in clinics
today [1]. Although effective, Bu has a relatively narrow therapeutic index, low drug exposure is associated
with increased risk of graft failure and disease relapse
in transplant recipients [2–4], whereas high drug exposure is associated with increased frequency of hepatic complications, especially veno-occlusive disease
(VOD) [5–7]. To improve treatment outcomes of Bu,
therapeutic drug monitoring (TDM) and dose adjustment, following the first dose, has highly recommended regardless of the dosing guideline was used
[8]. The area under the drug plasma concentration
time curve (AUC) or its counterpart, the concentration at steady state (CSS) (the AUC divided by dose
frequency) best describes the relationship between the
pharmacokinetic (PK) and pharmacodynamic (PD)
properties of Bu [9].
To our knowledge, there is no conclusive evidence
on the relationship between optimum exposure range
of Bu and its effectiveness or toxicity in children. The
guidelines from the European Medicines Agency
(EMA) recommended a target Bu AUC in children of
900 to 1500 μM × min [10]. The FDA labeling recommended a target intravenous (IV) Bu AUC 900 to
1350 ± 5% μM × min after 6 h dosing [8]. The European Society for Blood and Marrow Transplantation
(EBMT) guidelines recommend a total AUC after 16
doses of 90 mg × h/L (an equivalent of 1370 μM × min
after every 6 h dosage) for myeloablative exposure,
without strict distinction between children and adults
[11]. Numerous observational studies have recommended target Bu exposure ranges at different cut-off
values, including 900 [2, 12–17], 1000 [18], 1225 [11],
1350 [15–17], 1500 [14] and 1575 [11] μM × min for
every 6-h dosage. On the contrary, some observational studies found no statistically significant differences in transplant-related toxicity (TRT) or graft
failure rate between different Bu AUC [19–21].
Evidence for optimum Bu exposure range described
in these studies has obvious limitations. Frist, most of
the observational studies that contributed to the
aforementioned guidelines had too small a sample
size and had no clear inclusion/ exclusion criteria.
What’s more, these studies failed to identify different
patient groups of adults or children. In light of these
uncertainties, we conducted this systematic review
and meta-analysis to evaluate the relationship between
the reported Bu AUC and clinical outcomes in children undergoing HSCT.
Page 2 of 11
Methods
Search strategy
This meta-analysis is reported in accordance with the
Cochrane Handbook for Systematic Reviews and the
Meta-analysis of Observational Studies in Epidemiology
guidelines [22]. Studies were accessed from the PubMed,
EMBASE, Web of science, the Cochrane Library and
ClinicalTrials.gov. Search terms included “busulfan” in
combination with “area under the curve”, “AUC”,
“pharmacokinetics*” and “concentration”. Reference lists
of retrieved articles and related reviews were also examined, with no language or date restrictions.
Study selection
Two authors (X.Y.F and Y.J.W) independently applied
the inclusion criteria to all identified and retrieved articles, if the two authors could not reach a consensus,
a third reviewer (J.R.Z) was brought in to resolve the
disagreement. We included studies when: (i) it was an
observational study; (ii) Bu was administered 4 times
daily for 4 days (16 doses), either orally or by an IV
infusion route during the conditioning regimen before
HSCT; (iii) TDM was performed; (iv) AUC were reported for included patients; (v) Rate of graft failure
and Bu-related adverse events at both below and
above the cut-off value of the AUC were reported for
included patients, or sufficient data to estimate these
was provided; and (vi) sample size was ≥10 patients.
The exclusion criteria were as follows: (i) the object
of the study was older than 18; (ii) Data came from
simulated patients or pharmacokinetic models rather
than real patients and; (iii) Clinical data were not presented by Bu AUC strata.
Cut-off value establishment
According to the cut-off values of target Bu AUC
ranges recommended by guidelines from EMA [10],
EBMT [11] and the observational studies that we
mentioned above [2, 14–17, 20, 23–27] The stepwise
cut-off values as 800, 900, 1000, 1225, 1350, and
1500 μM × min was established.
Data extraction and quality assessment
The primary efficacy outcomes were graft failure (defined as non-engraftment or rejection). The major safety
outcomes were VOD incidence and other adverse
events. High-risk ratio (RR) denoted a high rate of graft
failure, VOD or other adverse events.
Data abstraction was conducted independently by the
same two authors (X.Y.F and Y.J.W), and any discrepancy between the investigators was resolved by a third
investigator (J.R.Z). The following data were collected
and organized from chosen studies: the author’s name,
year of publication, study design, number of patients
Feng et al. BMC Pediatrics
(2020) 20:176
included, methods for measuring Bu concentration, type
of AUC (initial, mean or final), cut-off value of Bu AUC,
and pre-specified study outcomes of efficacy and safety.
Where the study already included the cut-off value, we
considered patient groups treated with Bu at an AUC
below the pre-defined cut-off value as the treatment
group, and those above the pre-defined cut-off value as
the control. Where individual patient data were available, we extracted the number of events used all our
pre-defined cut-off values to divide patients into two
groups in the same way. When the AUC was measured
multiple times for each patient, we extracted the first
dose AUC (i.e., AUC calculated from 0 h to 6 h after Bu
administration) and the mean AUC (i.e., the average
value of AUC measured multiple times for each patient).
When neither first dose nor mean was available, we used
the reported AUC for that patient in the article. When
necessary, we contacted the article’s corresponding author by email for the required information.
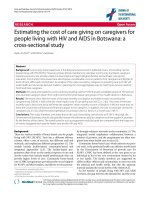
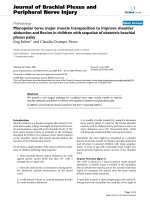
Fig. 1 Flow chart of study selection process
Page 3 of 11
The quality of the included studies was independently
assessed by two reviewers (X.Y.F and Y.J.W) according
to the Newcastle–Ottawa Scale with a maximum score
of 9 [28]. This tool consists of three major sections concerning the methodological quality: the representative,
comparability and outcome of each included study. Any
disagreements that arose between the reviewers were resolved through discussion. A third reviewer (J.R.Z) was
available to settle disputes.
Statistical analysis
Data analysis was performed using Open Meta-Analyst
software (Tufts Medical Center, Boston, MA, USA). To
assess variations between studies in addition to sampling
error within these, the I2 statistic was used to assess for
heterogeneity across the included studies. An I2 value >
50% suggests substantial heterogeneity between studies.
The DerSimonian-Laird was used to calculate RR and
95% confidence interval (CI) for each study. The 95% CI
Japan
USA
UK
Okamoto (2014) [23]
Maheshwari (2013) [13]
Veal (2012) [24]
France
Vassal (2008) [16]
USA
USA
France
Bolinger (2000) [17]
Tran (2000) [29]
VASSAL (1996) [27]
retrospective
prospective
prospective
prospective
retrospective
Study design
retrospective
prospective
prospective
prospective
prospective
prospective
prospective
retrospective
Study design
AML (8); JMML (2); MDS (2);
β-thalassemia (3); Others (9)
–
5.9 (1–15)
7.6 (0.8–18)
(0.6–18)
(0.6–17.1)
0, 0.5, 1, 2, 4, 6 h after the start of
infusion for dose 1, dose 5 and
dose 9/HPLC-UV
20 min, 40 min as well as 1, 1.5, 2, 3, 4,
and 6 h after the start of infusion for
dose 1, dose 5 and dose 9/GC-MS
po 40 mg/m2
po 1 mg/kg or 30–37.5 mg/m2
NB (28); Brain tumors (13);
NHL (5); others (11)
ALL (13); AML (7); MDS (3);
CML (1); NHL (1)
0, 0.5, 1, 2, 3, 4, 5 and 6 h after the
start of infusion for dose 1 and dose
13/GC-MS
po total dose 14–20 mg/kg
β-thalassemia (10); AML
(9); others (13)
0.5, 1, 2, 3, 4, 5, 6 h after the start of
infusion for dose 1; 0, 0.5, 1, 2, 4, 6 h
after the start of infusion for dose
5, 9 and 13/GC-MS
po total dose 10.9–28.9 mg/kg
AML (6); CML (5); β-thalassemia
(3); AA (4); SCD (4); others (10)
0, 1, 2, 3, 4, 6 h after the start of infusion
for dose 5 and dose 9/GC-MS
Sampling and analysis
0.5, 2 and 6 h after the start of infusion
for dose 1;
6 h after the start of infusion for dose
2, 3, 4, 12,13/GC-MS
0, 1, 2, 2.25, 2.5, 3 and 6 h after the start
of infusion for doses 1 and 9;0, 2.25 and
6 h after the start of infusion for
doses13/GC-MS
2,3,4,5,6 h after the start of infusion for
doses 1 and 9;2 and 6 h after the start of
infusion for doses 13 /GC-MS
NR/GC-MS
1, 2.25, 2.5, 3 and 6 h after the start of
infusion for doses 1 and 9; 0, 2.5, 6 h
after the start of infusion for dose
13/GC-MS
2, 2.25,2.5,3, 4, 5 and 6 h after the start
of infusion/GC-MS
1, 2, 2.25, 2.5, 3, and 6 h after the start
of infusion/GC-MSD
1,2, 2.5, and 6 h after dose 9; 0, 2.5and
6 h after dose 13/GC-MS
Follow-up (months)
NR
32 (11–52)
NR
NR
NR
b
NR
NR
10.2 (2–23.2)
–
≥60
36 (14.4–72)
≥3.33
Follow-up (months)
48.8 (0.4–139)
0,1, 2, 4, and 6 h after the start of
infusion/HPLC-UV
b
Sampling and analysis
po total dose 11–28 mg/kg (q6h*4d)
Dosing
po 37.5 mg/m 2 (q6h*4d)
iv 0.8–1.2 mg/kg (q6h*4d)
iv1.0 mg/kg or 0.8 mg/kg (q6h*4d)
iv 0.8–1.2 mg/kg (q6h*4d)
po 1.45 or 1.55 mg/kg (q6h*4d)
iv 0.8–1.2 mg/kg (q6h*4d)
iv1.0 mg/kg or 0.8 mg/kg (q6h*4d)
iv 0.8–1.2 mg/kg (q6h*4d)
iv 0.8–1.2 mg/kg (q6h*4d); po
16 mg/kg or 480 mg/m2(q6h*4d)
Dosing
AML (19); MDS (7); SCID (5);
others (22)
Diagnosis
Age (y)a
6 (0.25–16)
malignant solid tumor
4.4 (1.1–15.7)
NB (24); AML (14); SCD (5);
EWS (3); CML (3); Others (6)
AML (17); SCD (7); CML (3);
NB (27); others (10)
–
5.6 (0.3–17.2)
NB
SCD
AML (10); ALL (4); CML (2);
JMML (5); Others (4)
NR
Diagnosis
mean3.6
6.2 (1.2–15.5)
6 (0.5–17)
2.9 (1.56–9.9)
Age (y)a
(2020) 20:176
NR Not reported, GC-MS Gas chromatography with mass spectrometry detection, IV Intravenous, HPLV-UV High-performance liquid chromatography (HPLC) with the ultraviolet (UV) detection, AA Aplastic anemia, NB
Neuroblastoma, AML Acute myeloid leukemia, ALL Acute lymphocytic leukemia, MDS Myelodysplastic syndrome, NHL Non-Hodgkin’s lymphoma, SCD Sickle cell disease, SCID Severe combined immunodeficiency
syndrome, EWS Ewing’s sarcoma, JMML Juvenile myelomonocytic leukemia; a age was represented as median (range) or mean ± SD; bFollow-up (moths) was represented as median (interquartile range); c31 patients in
the autologous group (aged 0.7 to 14.9 years; median, 4 year), follow up with (49.1 to 56.9 months; median, 52.3 months) and 36 in allogeneic group, (aged 0.3 to 17.2 years old; median, 7.5 years).follow up with (45.5
to 52.8 months; median, 48.5 months);d 13 patients in the ≤4 years group, (aged 0.5 to 3.8 years; median, 1.6 year) and 11 patients in the> 4 years group, (aged 4.5 to 16.7; midian 10.7 years old); d 13 patients in the ≤4
years group, (aged 0.5 to 3.8 years; median, 1.6 year) and 11 patients in the> 4 years group, (aged 4.5 to 16.7; midian 10.7 years old); e Bu with MEL group had received more prior chemotherapy courses were not
considered for this article; f 31 patients were accessible for efficacy (one patient older than 18 was not included)
USA
Bolinger (2001) [26]
f
McCune (2003) [2]
USA
Country
Reference
f
France
Bouligand (2003) [25]
e
USA
Wall (2009) [15]
d
Michel (2011) [14]
France
Italy
Faraci (2017) [20]
c
Country
Reference
Table 1 Characteristics of included studies
Feng et al. BMC Pediatrics
Page 4 of 11
Feng et al. BMC Pediatrics
(2020) 20:176
Page 5 of 11
of outcome among distinct groups did not overlap,
showing that outcomes were statistically significant. A P
value < 0.05 was considered statistically significant.
To explore the heterogeneity among different studies, subgroup analysis was performed when more than
two studies were included in the analysis of each cutoff level. For the efficacy outcome, studies were stratified by orally or an IV infusion route during the conditioning regimen before HSCT. For the safety
outcome, studies were stratified by: i) studies reporting presence or absence of VOD prophylaxis therapy.
ii) Orally or an IV infusion route during the conditioning regimen before HSCT. The robustness of our
meta-analysis was assessed using leave-one-out approach. We isolated each study and evaluated its effect on the summary estimates and heterogeneity of
the main analysis, reporting the results for sensitivity
analysis when the conclusions differed.
Results
Search strategy and selection criteria
A total of 4673 articles were initially identified. Of the
3570 articles remaining after excluding duplicate publications, 3501 were excluded after screening the title and
abstract because they were not relevant. An additional
62 articles were excluded during the full-text review
owing to data proceeding from simulated patients, the
subjects of the study being age over 18, insufficient data
on clinical outcomes, clinical data not having been presented by Bu AUC strata or Bu not having been administered 4 times daily for 4 days, among other reasons.
Consequently, a total of 13 studies involving 548 patients
met the inclusion criteria and, accordingly, were included for meta-analysis [2, 13–17, 20, 23–27, 29]. The
literature selection process is summarized in Fig. 1.
Study characteristics
A summary of descriptions of included studies is reported
in Table 1, the studies were published between 1996 and
2017. Nine [13–17, 23, 24, 26, 29] were prospective studies
and four [2, 20, 25, 27] were retrospective studies. Six
studies were conducted in Europe [14, 16, 20, 24, 25, 27],
six studies were in United States [2, 13, 15, 17, 26, 29] and
one [23] was in Japan. Bu concentrations were measured
by high-performance liquid chromatography by means of
ultraviolet detection [23, 29], while the remainder [2, 13–
17, 20, 24–27] were measured by gas chromatography
with mass spectrometry detection.
Evaluation of efficacy
Table 2 displays a summary of outcomes for each study.
Table 3 display summaries of meta-analysis for efficacy,
Table 2 Outcomes and results of included studies
Reference
Type of AUC
Cut-off value
Reported outcome
Graft failure
Definition of graft failure
or rejection
Definition of VOD
Faraci [20]
Initial
900
NR
Mcdonald criteria [30]
Okamoto [23]
Initial
800; 900; 1000; 1225; Graft failure; VOD
1350; 1500
Failure to reach ANC > 0.5*109/L
by day 28 after transplantation
Mcdonald criteria [30]
maheshwari [13] Initial and mean
1350; 1500
VOD
NR
McDonald criteria [31]
veal [24]
Mean
1350;1500
Hepatic toxicity or VOD NR
Bearman criteria [32]
Michel [14]
Mean
900;1350;1500
VOD
NR
McDonald criteria [33]
Wall [15]
Initial, mean and Final 800; 900; 1000; 1225; Graft failure, VOD
1350; 1500
Failure to reach ANC > 0.5*109/L
at any time after transplantation
Jones criteria [34]
vassal [16]
Mean
900;1350;1500
Graft failure; VOD
Failure to reach ANC > 0.5 *109/L
for three consecutive days by
day 100 after transplantation
Jones criteria [34]
Bouligand [25]
Final
1350;1500
VOD
NR
McDonald criteria [33]
Graft failure; TRT
9
Failure to reach ANC > 0.5 *10 /L Bearman criteria [32]
McCune [2]
Mean
900;1350
Bolinger [26]
Mean
800; 900; 1000; 1225; Graft failure
No evidence of donor cells or
initial evidence of donor
engraftment followed by full
autologous recovery
Bearman criteria [32]
Bolinger [17]
Initial and mean
800; 900; 1000; 1225; Graft failure
No evidence of donor cells or
initial evidence of donor
engraftment followed by full
autologous recovery
Bearman criteria [32]
Tran [29]
Mean
1350;1500
VOD
NR
Bearman criteria [32]
VASSAL [27]
Initial
1350;1500
VOD
NR
McDonald criteria [33]
NR Not reported, VOD Veno-occlusive disease, TRT Transplant-related toxicity
Feng et al. BMC Pediatrics
(2020) 20:176
Page 6 of 11
Table 3 Summary of meta-analyses for the incidence of graft failure
Type of AUC
Cut-off value (μM*min/L)
RR (95% CI)
Number of studies
Number of participants
in treatment group
Number of participants
in control group
I2%
AUC first dose
< 800 verse ≥800
2.664 (0.857, 8.282)
4
24
67
0
AUC mean
< 900 verse ≥900
2.208 (0.686, 7.107)
5
73
100
0
< 1000verse ≥1000
1.544 (0.315, 7.561)
4
48
43
0
<1225verse ≥1225
1.007 (0.222, 4.578)
4
66
25
0
< 800 verse ≥800
5.296 (1.389, 20.191)
3
22
78
0
< 900 verse ≥900
3.666 (1.419, 9.467)
7
59
216
0
<1000verse ≥1000
1.245 (0.267, 5.809)
4
62
38
0
<1225verse ≥1225
0.559 (0.125, 2.505)
4
78
22
0
CI Confidence interval
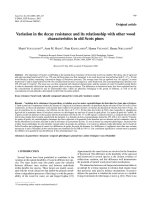
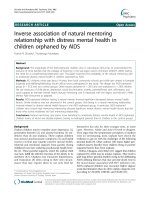
Forest plots are shown in Fig. 2. Raw data were shown
in Supplementary data (Table S1 and Figures S1–S12).
Our meta-analysis demonstrated that there were no
significant first dose AUC cut-off values for efficacy. We
found the cut-off level (AUC mean) of < 900 μM × min
to be significantly associated with higher incidence of
graft failure (RR = 3.666, 95% CI: 1.419, 9.467).
Subgroup analyses showed that the incidence of graft
failure significantly decreased above a cut-off level with
mean AUC 900 μM × min in the subgroup of administration by an IV infusion route alone (RR = 9.718; 95%
CI: 1.499–62.989), There were no significant differences
at other cut-off levels (Table 4).
Sensitivity analysis on each study’s effect on the summary estimates for efficacy was shown in Supplementary
data (Table S3), which illustrated that our results were not
driven by any single study, as the RRs remained stable.
Evaluation of safety
A summary of primary and subgroup analysis for safety
are shown in Table 5 and Table 6. Forest plots are
shown in Fig. 3 and Fig. 4. Raw data were shown in Supplementary data (Table S2 and Figures S13-20).
The definitions of VOD varied across the 10 studies (Table 2), the incidence of VOD ranged from
4.8% [2, 13–17, 20, 24–27] to 40% [27]. On average,
VOD occurred between 1 and 29 days after HSCT.
Our meta-analysis demonstrated a significantly lower
incidence of VOD with mean AUC below cut-off
levels of 1350 μM × min (RR = 0.370, 95% CI: 0.205–
0.666) and 1500 μM × min (RR = 0.409, 95% CI:
0182–0.920). In terms of the relationship between
first dose AUC and clinical outcomes, our metaanalysis demonstrated there were no significant differences at all cut-off values for VOD.
Subgroup analyses showed that the rate of VOD significantly decreased below a cut-off level with mean
AUC 1350 μM × min in the subgroup of without VOD
prophylaxis therapy (RR = 0.349; 95% CI: 0.182–0.670),
administration by an IV infusion route alone (RR = 0.378;
95% CI: 0.158–0.906) or not (either administration by an
IV infusion route or by oral) (RR = 0.363; 95% CI: 0.163–
0.805). There were no significant differences at other cutoff levels.
For others toxic effects, the relationship of Bu AUC
with graft versus-host disease (GVHD) was not found,
although two studies [35, 36] reported a higher incidence of GVHD when Bu/cyclophosphamide was
combined with melphalan. Regarding neurotoxicity, as
benzodiazepine or phenytoin was routinely given for
Fig. 2 Meta-analysis for rate of graft failure (mean AUC of < 900 μM × min comparison with ≥900 μM × min, RR <1 favors ≥900 μM × min)
Feng et al. BMC Pediatrics
(2020) 20:176
Page 7 of 11
Table 4 Summary of subgroup analysis for the incidence of graft failure
Subgroup
Administration route
IV Bu
Oral Bu
Cut-off value
(μM*min/L)
RR (95% CI)
Number
of studies
Number of participants
in treatment group
Number of participants
in control group
I2%
≤800 versus> 800
11.282 (0.930, 136.897)
2
2
36
0
≤900 versus> 900
9.718 (1.499, 62.989)
4
10
150
0
≤1000 versus> 1000
0.418 (0.030, 5.850)
2
23
15
0
≤1225 versus> 1225
0.139 (0.011, 1.729)
2
32
6
0
≤800 versus> 800
3.904 (0.800,19.055)
2
20
42
0
≤900 versus> 900
2.613 (0.869,7.860)
3
49
66
0
≤1000 versus> 1000
2.189 (0.328,14.587)
2
39
23
0
≤1225 versus> 1225
1.197 (0.186,7.720)
2
46
16
0
CI Confidence interval, NA Not applicable, IV Intravenous
seizure prophylaxis, the incidence of neurotoxicity
was relatively low. We could not pool the data to
perform a meta-analysis. Therefore, an association between AUC and other toxic effects could not be
evaluated.
On each study’s effect on the summary estimates
showed that exclusion of studies by Wallet al [15],
Bouligand et al. [25] and Tran et al. [29] resulted in
an insignificant difference at a cut-off level of
1500 μM × min Raw data were shown in Supplementary data (Table S4).
Quality assessment
The quality assessment of the included studies is presented in Supplementary Table S5. Overall, the subjects
included were representative, and ascertainment of exposure was confirmed by secure record, six studies were
comparable on basis of main factors [2, 14–16, 24, 25],
and seven studies were comparable on two or more factors [13, 17, 20, 23, 26, 27, 29]. Outcome assessment was
based on pharmacy and medical records, the follow-up
period was sufficient for outcomes to occur, and adequacy
of follow-up of cohorts. According to the NOS tool, the
quality assessment showed that two studies [17, 26] were
scored 6 stars, four studies 7 stars [20, 25, 27, 29], three
studies [13, 16, 23] 8 stars, and four studies [2, 14, 15, 24]
9 stars. No study was excluded after rating because the
study quality was always above 5 stars.
Discussion
As a bifunctional alkylating agent, Bu is a key component of several conditioning regimens used before
HSCT. It has been demonstrated that low plasma Bu
exposure is associated with potentially fatal outcomes including graft failure, whereas high exposure
is associated with toxicity, such as VOD [3, 5, 7].
Due to the high inter- and intra-patient variability in
the PK profile following oral and IV infusion [10],
major guidelines support and recommend TDM for
Bu to improve transplant outcomes [9, 26, 37], although the exact therapeutic window in children remains inconclusive.
Our meta-analysis revealed that a Bu mean AUC
above the value 900 μM × min is associated with lower
incidence of graft failure. This lower threshold of exposure is similar to the guideline recommendation
[8]. We conducted a subgroup analysis by orally or
by an IV infusion route during the conditioning regimen before HSCT, thereby demonstrating that the incidence of graft failure significantly decreased at a
cut-off level of > 900 μM × min in subgroup of administration by an IV infusion route. As we know, oral
Bu presents a wide inter- and intrapatient variability
of plasma exposures, especially in young children,
which results in poor clinical outcomes [35]. That
might explain why the oral Bu subgroup did not show
significance at the 900 μM × min cut-off level. Our
sensitivity analysis further validated the cut-off value
Table 5 Summary of meta-analyses for the incidence of VOD
Type of AUC
Cut-off value
(μM*min/L)
RR (95% CI)
Number
of studies
Number of participants
in treatment group
Number of participants
in control group
I2 %
AUC first dose
≤1350 versus>1350
0.562 (0.126,2.496)
3
51
23
26.96%
≤1500 versus>1500
0.761 (0.435,1.333)
4
87
44
0
≤1350 versus>1350
0.370 (0.205,0.666)
7
207
61
0
≤1500 versus>1500
0.409 (0.182,0.920)
5
163
28
0
AUC mean
CI Confidence interval
Feng et al. BMC Pediatrics
(2020) 20:176
Page 8 of 11
Table 6 Summary of subgroup analysis for incidence of VOD
Sub group
Administration
route
Cut-off value
(μM*min/L)
IV Bu alone
Number
Number of participants Number of participants I2%
of studies in treatment group
in control group
RR (95% CI)
≤1350 versus> 1350 0.378 (0.158,0.906)
3
106
30
0
≤1500 versus> 1500 0.485 (0.171,1.377)
3
129
17
0
IV Bu + oral Bu/oral ≤1350 versus> 1350 0.363 (0.163, 0.805) 4
Bu
≤1500 versus> 1500 0.316 (0.087,1.145) 2
101
31
0
34
11
0
≤1350 versus> 1350 0.476 (0.120, 1.885) 1
42
15
NA
VOD prophylaxis Yes
No
≤1500 versus> 1500 0.491 (0.109, 2.216) 1
56
11
NA
≤1350 versus> 1350 0.349 (0.182, 0.670) 6
165
46
0
≤1500 versus> 1500 0.380 (0.145, 0.994) 4
107
17
0
CI Confidence interval, NA Not applicable, IV Intravenous
900 μM × min for efficacy. In addition, numerous
studies [19, 35] have found that the first-dose Bu
AUC was significantly lower than the subsequent
daily ones and AUC remained unchanged during the
following days. However, we cannot identify the relationship between AUC at the first dose and efficacy
as there is insufficient data from studies to support
this. Thus, the correlation remain inconclusive and
further investigation is needed.
Our meta-analysis also demonstrated that a target
value of 1350 μM × min is associated with an increased risk of VOD. This conclusion differs from
the 900–1500 μM × min threshold that some publications [11, 12, 15] have suggested. This is likely due
to the fact that those studies are mainly conducted
on adults and their subjects of study are relatively
limited. In our subgroup analyses, we stratified studies according to administration route and whether
Bu treatment was combined with VOD prophylaxis
therapy. In subgroup patients without VOD prophylaxis therapy, a significantly decreased incidence of
VOD was detected when Bu AUC was below the
cut-off value of 1350 μM × min, which could not be
seen in those patients with VOD prophylaxis therapy. Plausible explanations are as follows. First, only
high-risk patients (pre-existing liver damage, history
of pancreatitis, genetic polymorphisms and mutations) were considered eligible for VOD prophylaxis
therapy [38], which may have physiological effects
on identifying the relationship between drug exposure and VOD. Secondly, as there are only two studies that include patients with VOD prophylaxis
therapy, we regard these subgroup analysis results as
likely to be unreliable.
The optimum Bu AUC of 900–1350 μM × min is
consistent with some previous research recommendations [15, 39], but differs from a recently multicenter,
retrospective cohort analysis reported by Bartelink
et al. [11] which showed that, in children and young
adults, the optimum Bu AUC is at a cumulative AUC
of 78–101 mg × h/L (equivalent to 1225–1575 μM ×
min after every 6 h dosing). However, there were
some discrepancies that should be noted. We
enforced a restriction on enrolled patients being less
than 18 years of age and to be administered with Bu
4 times a day for 4 days, while in the study by Bartelink et al. [11], patients older than 18 were included
and Bu was given once or four times a day. These
differences in age and frequency of administration
might lead to a different optimum AUC.
Fig. 3 Meta-analysis for incidence of VOD (mean AUC of < 1350 μM × min comparison with ≥1350 μM × min, RR < 1 favors ≥1350 μM × min)
Feng et al. BMC Pediatrics
(2020) 20:176
Page 9 of 11
Fig. 4 Meta-analysis for incidence of VOD (mean AUC of < 1500 μM × min comparison with ≥1500 μM × min, RR < 1 favors ≥1500 μM × min)
Our study has several strengths. First and foremost, it is the first meta-analysis focusing on the relationship of Bu AUC with efficacy and safety in
children, providing certain reference to individualized therapy. Secondly, our meta-analysis allowed for
comparison of commonly used cut-off levels for efficacy and safety in a single analysis for individual
cut-off levels. Finally, our study takes the approaches
of AUC estimation (AUC for the first dose or the
mean value) among transplant centers into consideration, which allowed us carry out more comprehensive comparisons of Bu AUC, despite the fact that
the patients came from different institutions.
We acknowledge the following limitations to our
work. First, due to the shortage of available data, a
detailed analysis according to different conditioning
regimens and underlying disease (malignant or nonmalignant disease) was not performed, which may
have drug-drug interaction, and physiological effects
on identifying the cut-off value of drug exposure (patients with a different disease should be treated as
separate populations as they may respond to treatment differently). Moreover, we were unable to include enough data from Asian location, because we
only identified one study conducted in Japan [23].
This is a timely reminder that the optimized AUC
should be considered with caution when applying the
results in Asian location. Finally, the use of observational studies in the meta-analysis implies biases and
confounding factors, given that these are inherent in
the original studies. As such, there is a clear requirement for further research.
Conclusion
This meta-analysis demonstrated that Bu mean AUC
above the cut-off value of 900 μM × min (after every
6-h dosing), was associated with decreased rates of
graft failure, while the cut-off value of 1350 μM × min
were associated with increased risk of VOD in children, particularly for the patients without VOD
prophylaxis therapy. However, our result is a synthesis of observational studies, which are the relatively
low-level evidence, and should be treated carefully.
Further well-designed prospective and multi centric
randomized controlled trials with larger sample size
are necessary before putting our result into clinical
practices.
Supplementary information
Supplementary information accompanies this paper at />1186/s12887-020-02028-6.
Additional file 1. Supplementary data.
Abbreviations
AUC: Area under the drug plasma concentration time curve; RR: Relative risk;
HSCT: Hematopoietic stem cell transplantation; TDM: Therapeutic drug
monitoring; VOD: Veno-occlusive disease; NOS: Newcastle–Ottawa Scale
Acknowledgements
The authors gratefully acknowledge the support by the Basic Clinical
Research Cooperation Project of Capital University of Medical Sciences and
the National Science and Technology Major Project of the Ministry of
Science and Technology of China.
Authors’ contributions
LBZ conceived and designed the study. XYF, YJW, JRZ and DFF conducted
the literature search, quality assessment, data extraction and synthesis. XYF,
YJW, CQY and JRZ interpreted the statistical analysis and drafted the
manuscript. LBZ, CQY, JPL and GHZ provided critical revision on subsequent
drafts and approved of the manuscript in its final form. All of the authors
read and approved the final manuscript.
Funding
This research was financially supported by the Basic Clinical Research
Cooperation Project of Capital University of Medical Sciences (grant number
17JL08), and the National Science and Technology Major Project of the
Ministry of Science and Technology of China (grant number
2017ZX09304029). The funders had no role in study design, data collection
and analysis, decision to publish, or preparation of manuscript.
Availability of data and materials
Raw data from this review is available in Supplementary data.
Ethics approval and consent to participate
Not applicable.
Consent for publication
Not applicable.
Feng et al. BMC Pediatrics
(2020) 20:176
Competing interests
The authors declare that they have no competing interests.
Author details
1
Clinical Research Center, Beijing Children’s Hospital, Capital University of
Medical Sciences, Beijing 100045, China. 2Department of Hematology and
Oncology, Beijing Children’s Hospital, Capital University of Medical Sciences,
Beijing 100045, China. 3School of Basic Medicine and Clinical Pharmacy,
China Pharmaceutical University, Nanjing 211198, China. 4Department of
Clinical Pharmacy, University of Michigan, Ann Arbor, MI 48109, USA.
Received: 19 June 2019 Accepted: 12 March 2020
References
1. Sisler IY, Koehler E, Koyama T, Domm JA, Ryan R, Levine JE, Pulsipher MA,
Haut PR, Schultz KR, Taylor DS. Impact of conditioning regimen in
allogeneic Hematopoetic stem cell transplantation for children with acute
Myelogenous leukemia beyond first complete remission: a pediatric Blood
and marrow transplant consortium (PBMTC) study. Biol Blood Marrow
Transplant. 2009;15(12):1620–7.
2. McCune JS, Gooley T, Gibbs JP, Sanders JE, Petersdorf EW, Appelbaum FR,
Anasetti C, Risler L, Sultan D, Slattery JT. Busulfan concentration and graft
rejection in pediatric patients undergoing hematopoietic stem cell
transplantation. Bone Marrow Transplant. 2002;30(3):167–73.
3. Slattery JT, Sanders JE, Buckner CD, Schaffer RL, Lambert KW, Langer FP,
Anasetti C, Bensinger WI, Fisher LD, Appelbaum FR, et al. Graft-rejection and
toxicity following bone marrow transplantation in relation to busulfan
pharmacokinetics. Bone Marrow Transplant. 1995;16(1):31–42.
4. Grochow LB. Busulfan disposition: the role of therapeutic monitoring in
bone marrow transplantation induction regimens. Semin Oncol. 1993;20(4):
18–25.
5. Geddes M, Kangarloo SB, Naveed F, Quinlan D, Chaudhry MA, Stewart D,
Savoie ML, Bahlis NJ, Brown C, Storek J. High busulfan exposure is
associated with worse outcomes in a daily i.v. busulfan and fludarabine
allogeneic transplant regimen. Biol Blood Marrow Transpl J Am Soc Blood
Marrow Transpl. 2008;14(2):220–8.
6. Copelan EA, Bechtel TP, Avalos BR, Elder PJ, Ezzone SA, Scholl MD, Penza SL.
Busulfan levels are influenced by prior treatment and are associated with
hepatic veno-occlusive disease and early mortality but not with delayed
complications following marrow transplantation. Bone Marrow Transplant.
2001;27(11):1121.
7. Dix SP, Wingard JR, Mullins RE, Jerkunica I, Davidson TG, Gilmore CE, York
RC, Lin LS, Devine SM, Geller RB. Association of busulfan area under the
curve with veno-occlusive disease following BMT. Bone Marrow Transplant.
1996;17(2):225–30.
8. IV Busulfex Product Information. 2015. 10.Available at: />media/static/IVBus-ulfex. PI.pdf. Accessed February 10, 2016.
9. Palmer J, McCune JS, Perales MA, Marks D, Bubalo J, Mohty M, Wingard JR,
Paci A, Hassan M, Bredeson C, et al. Personalizing Busulfan-based
conditioning: considerations from the American Society for Blood and
Marrow Transplantation Practice Guidelines Committee. Biol Blood Marrow
Transplant. 2016;22(11):1915–25.
10. Nguyen L, Fuller D, Lennon S, Leger F, Puozzo C. I.V. busulfan in pediatrics: a
novel dosing to improve safety/efficacy for hematopoietic progenitor cell
transplantation recipients. Bone Marrow Transplant. 2004;33(10):979.
11. Bartelink IH, Lalmohamed A, van Reij EM, Dvorak CC, Savic RM, Zwaveling J,
Bredius RG, Egberts AC, Bierings M, Kletzel M, et al. Association of busulfan
exposure with survival and toxicity after haemopoietic cell transplantation
in children and young adults: a multicentre, retrospective cohort analysis.
Lancet Haematol. 2016;3(11):e526–36.
12. Philippe M, Goutelle S, Guitton J, Fonrose X, Bergeron C, Girard P, Bertrand
Y, Bleyzac N. Should busulfan therapeutic range be narrowed in pediatrics?
Experience from a large cohort of hematopoietic stem cell transplant
children. Bone Marrow Transplant. 2016;13(4):72–8.
13. Maheshwari S, Kassim A, Yeh RF, Domm J, Calder C, Evans M, Manes B,
Bruce K, Brown V, Ho R. Targeted Busulfan therapy with a steady-state
concentration of 600-700?Ng/mL in patients with sickle cell disease
receiving HLA-identical sibling bone marrow transplant. Bone Marrow
Transplant. 2013;49(3):366–9.
Page 10 of 11
14. Michel G, Valteaucouanet D, Gentet JC, Esperou H, Socié G, Méchinaud F,
Doz F, Neven B, Bertrand Y, Galambrun C. Weight-based strategy of dose
administration in children using intravenous busulfan: clinical and
pharmacokinetic results. Pediatr Blood Cancer. 2011;58(1):90–7.
15. Wall DA, Chan KW, Nieder ML, Hayashi RJ, Yeager AM, Kadota R, Przepiorka
D, Mezzi K, Kletzel M, Blood P. Safety, efficacy, and pharmacokinetics of
intravenous busulfan in children undergoing allogeneic hematopoietic stem
cell transplantation. Pediatr Blood Cancer. 2010;54(2):291–8.
16. Vassal G, Michel G, Espérou H, Gentet JC, Valteau-Couanet D, Doz F,
Mechinaud F, Galambrun C, Neven B, Zouabi H. Prospective validation of a
novel IV busulfan fixed dosing for paediatric patients to improve
therapeutic AUC targeting without drug monitoring. Cancer Chemother
Pharmacol. 2008;61(1):113–23.
17. Bolinger AM, Zangwill AB, Slattery JT, Glidden D, Desantes K, Heyn L, Risler
LJ, Bostrom B, Cowan MJ. An evaluation of engraftment, toxicity and
busulfan concentration in children receiving bone marrow transplantation
for leukemia or genetic disease. Bone Marrow Transplant. 2000;25(9):925–30.
18. Zwaveling J, Bredius RG, Cremers SC, Ball LM, Lankester AC, Teepe-Twiss IM,
Egeler RM, Den HJ, Vossen JM. Intravenous busulfan in children prior to stem
cell transplantation: study of pharmacokinetics in association with early clinical
outcome and toxicity. Bone Marrow Transplant. 2005;35(1):17–23.
19. Jacobson P, Park JJ, Defor TE, Thrall M, Abel S, Krivit W, Peters C. Oral
busulfan pharmacokinetics and engraftment in children with hurler
syndrome and other inherited metabolic storage diseases undergoing
hematopoietic cell transplantation. Bone Marrow Transplant. 2001;27(8):855.
20. Faraci M, Tinelli C, Lanino E, Giardino S, Leoni M, Ferretti M, Castagnola E,
Broglia M, Silvestri AD, Martino DD. Monitoring of Busulphan concentrations
in children undergone hematopoietic stem cell transplantation: Unicentric
experience over 10 years. Eur J Drug Metab Pharmacokinet. 2017;43(Suppl
2):1–9.
21. Blazar BR. Relationship of plasma pharmacokinetics of high-dose oral
busulfan to the outcome of allogeneic bone marrow transplantation in
children with thalassemia. Bone Marrow Transplant. 1997;20(11):915–20.
22. Stroup DF, Berlin JA, Morton SC, Olkin I, Williamson GD, Rennie D, Moher D,
Becker BJ, Sipe TA, Thacker SB. Meta-analysis of observational studies in
epidemiology: a proposal for reporting. Meta-anal Observational Stud
Epidemiol (MOOSE) Group. 2008;283(15):2008.
23. Yasuhiro O, Yoshihisa N, Yoshiyuki K, Akira K, Shunichi K, Hisato K, Yasuo H,
Megumi O, Makoto K, Tetsuya M. Prospective pharmacokinetic study of
intravenous busulfan in hematopoietic stem cell transplantation in 25
children. Pediatr Transplant. 2014;18(3):294–301.
24. Veal GJ, Nguyen L, Paci A, Riggi M, Amiel M, Valteau-Couanet D, Brock P,
Ladenstein R, Vassal G. Busulfan pharmacokinetics following intravenous
and oral dosing regimens in children receiving high-dose myeloablative
chemotherapy for high-risk neuroblastoma as part of the HR-NBL-1/SIOPEN
trial. Eur J Cancer. 2012;48(16):3063–72.
25. Bouligand J, Boland I, Valteau-Couanet D, Deroussent A, Kalifa C, Hartmann
O, Vassal G. In children and adolescents, the pharmacodynamics of highdose busulfan is dependent on the second alkylating agent used in the
combined regimen (melphalan or thiotepa). Bone Marrow Transplant. 2003;
32(10):979–86.
26. Bolinger AM, Zangwill AB, Slattery JT, Risler LJ, Sultan DH, Glidden DV,
Norstad D, Cowan MJ. Target dose adjustment of busulfan in pediatric
patients undergoing bone marrow transplantation. Bone Marrow Transplant.
2001;28(11):1013–8.
27. Vassal G, Koscielny S, Challine D, Valteau-Couanet D, Boland I, Deroussent A,
Lemerle J, Gouyette A, Hartmann O. Busulfan disposition and hepatic venoocclusive disease in children undergoing bone marrow transplantation.
Cancer Chemother Pharmacol. 1995;37(3):247–53.
28. Wells G, Shea B, O’Connell J. The Newcastle-Ottawa Scale (NOS) for
Assessing The Quality of Nonrandomised Studies in Meta-analyses, vol. 7;
2014.
29. Tran HT, Madden T, Petropoulos D, Worth LL, Felix EA, Sprigg-Saenz HA,
Choroszy M, Danielson M, Przepiorka D, Chan KW. Individualizing high-dose
oral busulfan: prospective dose adjustment in a pediatric population
undergoing allogeneic stem cell transplantation for advanced hematologic
malignancies. Bone Marrow Transplant. 2000;26(5):463.
30. Mcdonald GB, Sharma P, Matthews DE, Shulman HM, Thomas ED.
Venocclusive disease of the liver after bone marrow transplantation:
diagnosis, incidence, and predisposing factors. Hepatology. 1984;4(1):
116–22.
Feng et al. BMC Pediatrics
(2020) 20:176
31. Deleve LD, Shulman HM, Mcdonald GB. Toxic injury to hepatic sinusoids:
sinusoidal obstruction syndrome (veno-occlusive disease). Semin Liver Dis.
2002;22(01):27–42.
32. Bearman SI, Appelbaum FR, Buckner CD, Petersen FB, Fisher LD, Clift RA,
Thomas ED. Regimen-related toxicity in patients undergoing bone marrow
transplantation. J Clin Oncol Off J Am Soc Clin Oncol. 1988;6(10):1562–8.
33. Mcdonald GB, Hinds MS, Fisher LD, Schoch HG, Wolford JL, Banaji M, Hardin
BJ, Shulman HM, Clift RA. Veno-occlusive disease of the liver and multiorgan
failure after bone marrow transplantation: a cohort study of 355 patients.
Ann Intern Med. 1993;118(4):255.
34. Jones RJ, Lee KS, Beschorner WE, Vogel VG, Grochow LB, Braine HG,
Vogelsang GB, Sensenbrenner LL, Santos GW, Saral R. Venoocclusive disease
of the liver following bone marrow transplantation. Transplantation. 1987;
44(6):778–83.
35. Mårtensson T, Priftakis P, Casswall T, Ringdén O, Mattsson J, Remberger M,
Hassan M, Gustafsson B. Increased risk of gastrointestinal acute GVHD
following the addition of melphalan to busulfan/cyclophosphamide
conditioning. Pediatr Transplant. 2013;17(3):285–93.
36. Malär R, Sjöö F, Rentsch K, Hassan M, Güngör T. Therapeutic drug
monitoring is essential for intravenous busulfan therapy in pediatric
hematopoietic stem cell recipients. Pediatr Transplant. 2011;15(6):580–8.
37. Zao JH, Schechter T, Liu WJ, Gerges S, Gassas A, Egeler RM, Grunebaum E,
Dupuis LL. Performance of Busulfan dosing guidelines for pediatric
hematopoietic stem cell transplant conditioning. Biol Blood Marrow
Transplant. 2015;21(8):1471–8.
38. Corbacioglu S, Cesaro S, Faraci M, Valteaucouanet D, Gruhn B, Rovelli A,
Boelens JJ, Hewitt A, Schrum J, Schulz AS. Defibrotide for prophylaxis of
hepatic veno-occlusive disease in paediatric haemopoietic stem-cell
transplantation: an open-label, phase 3, randomised controlled trial. Lancet.
2012;379(9823):1301–9.
39. Javid G, Antonella I, Alessia Francesca M, Aurèlie P, Laurent N, Cristiano I,
Vincenzo D, Pietro S, Marco M, Marco A. New insights into the
pharmacokinetics of intravenous busulfan in children with sickle cell anemia
undergoing bone marrow transplantation. Pediatr Blood Cancer. 2015;62(4):
680–6.
Publisher’s Note
Springer Nature remains neutral with regard to jurisdictional claims in
published maps and institutional affiliations.
Page 11 of 11