A multivariate multilevel analysis of the risk factors associated with anthropometric indices in Iranian mid-adolescents
Bạn đang xem bản rút gọn của tài liệu. Xem và tải ngay bản đầy đủ của tài liệu tại đây (687.08 KB, 9 trang )
Alamolhoda et al. BMC Pediatrics
(2020) 20:191
/>
RESEARCH ARTICLE
Open Access
A multivariate multilevel analysis of the risk
factors associated with anthropometric
indices in Iranian mid-adolescents
Marzieh Alamolhoda1, Seyyed Taghi Heydari1* , Seyyed Mohammad Taghi Ayatollahi2, Reza Tabrizi1,
Maryam Akbari1 and Arash Ardalan3
Abstract
Background: The present study was conducted to jointly assess some specific factors related to body fat measures
using a multivariate multilevel analysis in a representative sample of Iranian mid-adolescents.
Methods: This study was conducted among 2538 students (1286 boys) aged 14–20 years old, who were randomly
selected among 16 public high schools by multi-stage random sampling procedure from all education districts of
Shiraz, Iran. Data on demographic characteristics, family history of obesity, physical activity, socio-economic (SES)
variables and screen time were collected. Height, weight, triceps (TST), abdominal (AST), and subscapular (SST)
skinfold thickness were measured and their body mass index (BMI) was calculated. A multivariate multilevel
approach was used to analyze the factors associated with obesity measures of the TST, AST, SST at the child and
district levels.
Results: In this study, the prevalence of overweight and obesity was estimated to be 10.2 and 5.1%, respectively.
Overall, the major portion of the total variance in TST (97.1%), AST (97.7%), and SST (97.5%) was found at the child
level. The results of multivariate multilevel method revealed that being girls, having a family history of obesity, and
SES were significantly associated with increasing of three body fat measures (all the p-values were less than 0.05).
There were significant positive associations between moderate to vigorous physical activities with AST and SST (for
AST: β =2.54, SE = 1.40, p = 0.05; for SST: β =2.24, SE = 1.20, p = 0.05). Compared to children in 14–16 age group,
children in age group 16–18 years had less TST (β = − 0.67, SE = 0.34, p = 0.04). Furthermore, other age groups and
screen time did not play an important role in three outcome variables.
Conclusions: The results showed some factors that contribute to three body fat measures. Therefore, it is necessary
to develop effective interventions to prevent the effects of individual and environmental undesirable factors on
childhood obesity in both family and community levels.
Keywords: Childhood obesity, Skinfold thickness, Socio-economic status, Physical activity, Family history of obesity,
Multivariate multilevel analysis
* Correspondence:
1
Health Policy Research Center, Institute of Health, Shiraz University of
Medical Sciences, Shiraz, Iran
Full list of author information is available at the end of the article
© The Author(s). 2020 Open Access This article is licensed under a Creative Commons Attribution 4.0 International License,
which permits use, sharing, adaptation, distribution and reproduction in any medium or format, as long as you give
appropriate credit to the original author(s) and the source, provide a link to the Creative Commons licence, and indicate if
changes were made. The images or other third party material in this article are included in the article's Creative Commons
licence, unless indicated otherwise in a credit line to the material. If material is not included in the article's Creative Commons
licence and your intended use is not permitted by statutory regulation or exceeds the permitted use, you will need to obtain
permission directly from the copyright holder. To view a copy of this licence, visit />The Creative Commons Public Domain Dedication waiver ( applies to the
data made available in this article, unless otherwise stated in a credit line to the data.
Alamolhoda et al. BMC Pediatrics
(2020) 20:191
Background
In recent years, the rapid growth of obesity among children and adolescents has become a serious public health
challenge in both developing and developed countries
[1–3]. The prevalence of childhood obesity has an arising trend in Iran, like other developing countries [4, 5].
Obesity in early life, as an important metabolic problem
leads to major health disorders such as hypertension [4],
non-alcoholic fatty liver disease [6], obesity in the adulthood and more other nutrition -related chronic diseases
such as type 1 diabetes, cardiovascular disease [7], some
types of cancer [8] as well as a decrease in the life expectancy [9].
Among several approaches used to measure the obesity,
Body Mass Index (BMI), Skinfold Thickness (ST) and
waist circumference (WC) have been more frequently
used in clinical setting [8]. Although, BMI, as a simple and
inexpensive parameter is used more than other approaches for measuring the obesity, it has several drawbacks as mentioned in the literature [10]. ST is an easily
obtained adiposity index, which is commonly used, and is
an accurate estimate for measuring the subcutaneous body
fat among children and adolescents [7, 11–13]. It also can
be easily applied in clinics, laboratories and schools because of its portable, low cost and non-invasive nature
[14]. Further, the use of ST as an epidemiological screening tool for cardio metabolic risk factors, a better predictor of high body fatness during adulthood than BMI
and a reliable tool in assessing the effect of lifestyle factors
in children and adolescent has been reported in earlier reports [15–17].
The mechanism of obesity development has remained
unidentified, and the researchers characterize the obesity
as a health disorder with multiple causes [18]. Certainly,
a lot of influential factors have been reported to be effective on childhood obesity. Individual factors such as
physical and social functioning as well as environmental
factors, lifestyle preferences, and cultural environment
play an important role in increasing or decreasing the
prevalence of childhood obesity [19, 20]. A systematic
review of the published studies in South Asian countries
revealed that the lack of proper physical activities, prolonged TV watching or using different electronic media,
unhealthy dietary patterns, family history of obesity, and
the family socio-economic status are among the main individual factors found to be significantly associated with
the obesity in children and adolescents [21]. Moreover,
previous studies showed that behavioral and environmental factors were significantly associated with increasing childhood obesity [22, 23]. In fact, factors related to
childhood obesity are a subset of multi-factorial etiology
in three levels: family, school, and community. Therefore, the coverage of the risk factors contributing to
childhood obesity needs to consider muti-sectoral
Page 2 of 9
approaches. However, many studies have examined
simple relationships between predictor variables with
adiposity indices and there are limited studies that have
considered hierarchical structure in these models [19,
20, 24, 25]. It is necessary to consider effective strategies in order to prevent and control childhood obesity
in different aspects.
Since anthropometric measures seemingly share common
biological and environmental relationships, simultaneous
evaluation of multiple outcomes and the influential covariates using multivariate multilevel approaches will lead to
more accurate results than univariate approaches. Furthermore, when the data have a hierarchical structure, predictor
variables in ordinary multivariate regression models with
single level do not provide correct inferences for outcome
variables, due to the dependency existing between the observations. Therefore, it is necessary to fit a model that can
accurately estimate the parameters. The present study
aimed to simultaneously investigate the relationship between the influential covariates and three anthropometric
measures including triceps (TST), abdominal (AST), and
sub-scapular (SST) skinfold thickness using multivariate
multilevel analysis.
Methods
Subjects, study design, and sampling procedure
The sample of the current study was collected from high
school students in Shiraz during September to December
2014. Administratively, Shiraz, the capital of Fars Province
in southern Iran, is divided into 4 educational districts.
Each district has distinct social, cultural, economic and
health characteristics. In this cross-sectional study, 2538
healthy subjects (1286 boys and 1252 girls) aged 14–20
years old were selected among 16 public high schools by
multi-stage random sampling procedure from 4 education
districts of Shiraz. In the first step, 4 schools were chosen
from each district (two from boy’s schools and two from
girl’s schools) using simple random sampling. In the next
step, based on the school sample size, 2 or 3 classrooms
were randomly selected from each school, and all the students in the classroom were studied.
Children gave oral assent before participating in the
study and written informed consent was obtained from
their parents. The study protocol was approved by the Ethics Committee of Shiraz University of Medical Sciences.
Moreover, the permission was obtained from schools principal for collecting the data from the selected classrooms.
Measurements
The collected data were classified into two groups:
demographic characteristics and anthropometric measurements; the former describing sex, age, screen time,
family history of obesity, Physical Activities (PA), and
Socio-Economic Status (SES) variables. These data were
Alamolhoda et al. BMC Pediatrics
(2020) 20:191
collected through a questionnaire. Content validity of
the questionnaire was confirmed by three specialists in
epidemiology, biostatistics and endocrinology.
Screen time was defined as the times spent on watching
TV, using computer, and playing video games by using a
question: “How long do you spend your time on watching
TV, using computer, and playing video game per day?”.
Family history of obesity was assessed using a question, “Is
there a history of obesity in your family?”. PA was assessed
using two questions: during the past week, “What kind of
physical activity do you do? “ and “How many days do you
have physical activity for more than 30 min?”. PA was classified into three levels, namely mild, moderate, and vigorous
activities. SES was calculated using principal component
analysis by available variables used for SES measurement
[19, 26]. Variables such as parents’ education level, parents’
occupation, as well as choice of car type and homeownership (Ownership or Rent) were included in the analysis to
make one main component. The SES score calculated using
the weighted averages of the variables was categorized into
three levels (low, middle, and high) to define the SES.
The second data related to anthropometric measurements included body weight and height, BMI, TST, AST
and SST. Height and weight were measured in all students, while wearing light clothing and no shoes, with 0.1
cm and 0.1 kg accuracy, respectively using tape measure
and a SECA digital scale (Germany). BMI was calculated
by dividing weight (kg) by height squared (m2) and was
classified based on the WHOs growth charts [27]. The
subjects of the same sex and age with BMI less than 85th
percentile, between 85th and 95th percentile and above
95th percentile were classified into three groups: normal,
overweight and obese, respectively [28]. A graded caliper
was used to measure the ST in three sites of the body (triceps, abdominal, and subscapular). To measure the triceps, the technician bent the elbow to 90 degrees and
marked the point midway between the top of the shoulder
and elbow, and then measured a vertical fold by the caliper at a 90-degree angle on that midway point with the
arm hanging naturally at the subject’s side. For AST measurements, vertical folds were measured at 2 cm to the
right and left of the navel. Finally, a diagonal fold (calipers
held at a 45-degree angle) was taken across the back, just
below the shoulder blade to measure the SST. ST was
measured on both right and left sides of the body separately, and the average of two measurements was recorded
to the nearest 0.5 mm [29]. All anthropometric measurements of the students were done by two trained technicians. Measurement was repeated by another technician if
there was a great difference in the right and left sides.
Statistical analysis
Mean and standard deviation were calculated for quantitative data, and frequency and percentage were reported
Page 3 of 9
for qualitative variables. Pearson Chi-Square, and OneWay ANOVA tests were used to investigate the association between the variables at the child level. A P-value
of less than 0.05 was considered as statistically significant. Since, in this study, the data had a hierarchical
structure with multiple outcomes, multivariate multilevel
analysis was used to depict the hierarchical structure of
the data [30]. The ability to model the correlation between response variables (in our case, at individual and
district levels), increasing the power, performing a single
test to avoid the risk of chance capitalization, which is
inherent to carrying out a separate test for each
dependent variable, and measuring the effect of any exploratory variable separately across multiple outcome
variables are main advantages using multivariate hierarchical analysis [31]. In this study, TST, AST, and SST
as three multiple outcome variables were at the first
level in the hierarchy. Therefore, for each subject, three
quantitative measures were recorded simultaneously as
units in level 1. The subjects included as units in the
second level, and districts were considered at the third
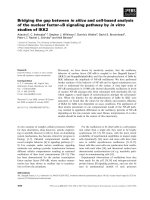
level in the hierarchy. These levels are shown in Fig. 1.
The multilevel structure makes it possible to evaluate
whether the districts made a difference to individual anthropometric measures. Three outcome variables were
regressed on a set of explanatory variables in the random
intercept model, which were in levels 2 and 3. Primary
analysis of the data was carried out using SPSS software
(Ver. 18.0). The MLwiN software version 2.00 was used
to analyze the hierarchical model.
Results
Table 1 shows the results of descriptive statistics (percentage) for the children in 4 districts. A total of 1286 (50.7%)
subjects were boys and were roughly distributed equally in
4 districts. Mean age (SD) of the participants was equal to
15.99 (0.94) years old, which was not distributed equally
in the districts (P-value < 0.05). The distribution of screen
time was somewhat different between 4 districts (p =
0.05). On average, more times on watching TV or using
computer were recorded for students living in districts 4
and 1 (Means (SD) in 4 districts were 4.47 (2.29), 4.39
(2.12), 4.36 (2.52) and 4.72 (2.52) h/day, respectively).
About 44% of the participants were categorized into family history of obesity group. Having mild physical activities
was reported by 76.6% of the students and only 3.1% of
them had vigorous physical activities. Compared to other
districts, more children from district 3 lived in a family
with low SES. The results of Chi-Square test revealed that,
the subjects were distributed differently with regard to
physical activities, SES and prevalence of overweight and
obesity in four districts. However, there was not a statistically significant difference between the four groups with
respect to gender and family history of obesity.
Alamolhoda et al. BMC Pediatrics
(2020) 20:191
Page 4 of 9
Fig. 1 Multivariate multilevel structures of anthropometric measures (TST, AST and SST) at level one nested within children at level 2, nested
within districts at level 3
Table 1 Descriptive statistics among individuals by districts
Variables
Descriptor
District 1
(n = 699)
District 2
(n = 601)
District 3
(n = 609)
District 4
(n = 629)
Total
(n = 2538)
< 2 h/day
N (%)
51 (9.5)
43 (8.5)
48 (13.7)
43 (8.7)
185 (9.8)
≥ 2 h/day
N (%)
486 (90.5)
463 (91.5)
302 (86.3)
452 (91.3)
1703 (90.2)
P-valuea
Screen time
0.05
Sex
Boy
N (%)
359 (51.4)
309 (51.4)
295 (48.4)
323 (51.4)
1286 (50.7)
Girl
N (%)
340 (48.6)
292 (48.6)
314 (51.6)
306 (48.6)
1252 (49.3)
N (%)
362 (51.9)
347 (57.8)
320 (52.6)
347 (55.2)
1376 (54.3)
0.66
Age groups (year)
[14–16)
[16–18)
N (%)
328 (47.0)
252 (42.0)
254 (41.8)
260 (41.3)
1094 (43.2)
[18–20]
N (%)
8 (1.1)
1 (0.2)
34 (5.6)
22 (3.5)
65 (2.6)
0.00
Family history of obesity
Yes
N (%)
296 (42.6)
261 (43.8)
270 (44.6)
286 (45.9)
1113 (44.2)
No
N (%)
399 (57.4)
335 (56.2)
336 (55.4)
337 (54.1)
1407 (55.8)
0.67
Physical activity
Mild
N (%)
431 (75.0)
315 (72.9)
355 (82.2)
379 (76.7)
1480 (76.6)
Moderate
N (%)
124 (21.6)
99 (22.9)
65 (15.0)
105 (21.3)
393 (20.3)
Vigorous
N (%)
20 (3.5)
18 (4.2)
12 (2.8)
10 (2.0)
60 (3.1)
Low
N (%)
124 (26.1)
48 (11.3)
349 (76.9)
191 (44.3)
712 (39.9)
Med
N (%)
303 (63.8)
307 (72.1)
98 (21.6)
227 (52.7)
935 (52.4)
High
N (%)
48 (10.1)
71 (16.7)
7 (1.5)
13 (3.0)
139 (7.8)
0.02
SES status
0.00
Obesity Status
Normal
N (%)
568 (82.2)
501 (83.5)
535 (88.6)
532 (84.7)
2136 (84.7)
Overweight
N (%)
74 (10.7)
70 (11.7)
47 (7.8)
67 (10.7)
258 (10.2)
Obese
N (%)
49 (7.1)
29 (4.8)
22 (3.6)
29 (4.6)
129 (5.1)
SES socio-economic status
a
P-value are derived from Chi squared tests
0.02
Alamolhoda et al. BMC Pediatrics
(2020) 20:191
Page 5 of 9
Overall, in this study, the prevalence of overweight
and obesity was equal to 10.2 and 5.1%, respectively, and
there was no significant association in the gender groups
(prevalence of overweight and obesity was equal to 10.0
and 5.2% for boys and 10.3 and 5.0% for girls, respectively, with P-value> 0.05). The results of anthropometric
measures in 4 districts are presented in Table 2. Generally, there were statistically significant differences in all
anthropometric variables between four groups (P-values
< 0.01). The results of ANOVA tests revealed that, district 4 and 1 had the highest values of TST, AST, and
SST. Means in all anthropometric measures were significantly lower in the third district than those of other districts. Furthermore, prevalence of overweight and
obesity in the third district was lower than other regions.
Table 3 illustrates the effect of the covariates on three
outcomes in a multivariate multilevel model. As shown
in Table 3, being girl, having a family history of obesity,
and SES were significantly associated with three anthropometric measures. Although boys had greater mean
BMI than girls (mean (SD) of BMI was equal to 21.81
(4.51) for boys and 21.23 (3.49) for girls, respectively,
with P-value < 0.001), the subcutaneous adipose tissue
was thicker in girls than that of boys by over 3, 2 and 2
mm in TST, SST and AST, respectively (for TST: β =
3.02, SE = 0.37, p < 0.001; for AST: β =2.33, SE = 0.49,
p < 0.001; for SST: β =2.17, SE = 0.42, p < 0.001). Furthermore, subjects who lived in a family with a history of
obesity had more fat (for TST: β =2.25, SE = 0.34, p <
0.001; for AST: β =3.30, SE = 0.45, p < 0.001; for SST: β
=3.49, SE = 0.39, p < 0.001), than others did. Results of
Table 3 also showed that, SES had a significant direct effect on all three anthropometric measures. It was found
that, compared to children with low SES, children with
high and moderate SES had more TST, AST and SST.
The levels of physical activity had a positive relationship
with individual outcomes, with significant associations
between the moderate to vigorous physical activities.
Children with moderate physical activity had higher
AST and SST than those with vigorous physical activity
by over 2, 2 mm (for AST: β =2.54, SE = 1.40, p = 0.051;
for SST: β =2.24, SE = 1.20, p = 0.047). Compared to
children in 14–16 age group, children in age group 16–
18 years had less TST (β = − 0.67, SE = 0.34, p = 0.04).
Moreover, screen time did not play an important role in
three outcome variables.
-2loglikelihood statistic with Iterative Generalized
Least Squares (IGLS) as an estimation method was obtained as 26,653.0 with 42 estimated parameters in final
model, so that compared to the null model (null model
is a model having only intercepts with the -2loglikelihood of 47,697.8 with 15 estimated parameters), the deviance was statistically significant (21,044.8 with 27
degree of freedom and P-value< 0.001) and given the
dramatic reduction in deviance, this model fits the data
well.
Overall, the major portion of the total variation in
TST (97.1%), AST (97.7%), and SST (97.5%) was found
at the child level. Further, at the child level (within-districts), high correlations were obtained between three
outcomes (the within-district correlations were obtained
as 0.68, 0.72, and 0.80 for the (TST, AST), (TST, SST),
and (AST, SST), respectively). Although districts explain
a relatively small amount of the total variation of TST
(2.9%), AST (2.3%) and SST (2.5%), relatively high correlations between the outcome variables indicated that the
districts are properly positioned in the third level of the
hierarchy. The results of the correlation between the
outcomes showed that, the intra-district correlations
were obtained as 0.49, 0.21, and 0.80 for the (TST,
AST), (TST, SST), and (AST, SST), respectively.
Discussion
The present study was an attempt to jointly evaluate the
relationships between three body fat measures with a set
of covariates in Iranian mid-adolescents within different
4 districts, using a multivariate multilevel analysis. Given
the multifactorial nature of childhood obesity which
form a hierarchical structure, we analyzed the data
through a multilevel model. One of the main finding of
this study is the high positive correlations between TST,
AST and SST at the child level, suggesting that children
with higher TST tend to also have higher AST and SST
after adjusting for a set of covariates at the child and
Table 2 Anthropometric measurement of individual at district level
TST (mm)
Descriptor
District 1
District 2
District 3
District 4
P-value
Mean (SD)
16.36 (7.33)
15.65 (7.02)
13.08 (5.93)
16.71 (8.25)
0.00
AST (mm)
Mean (SD)
17.49 (9.34)
16.49 (7.78)
14.61 (8.83)
17.57 (9.36)
0.00
SST (mm)
Mean (SD)
16.60 (8.14)
16.10 (7.83)
13.85 (6.71)
17.91 (8.84)
0.00
Height (cm)
Mean (SD)
165.88 (8.69)
167.28 (8.08)
163.62 (8.37)
165.48 (8.60)
0.00
Weight (kg)
Mean (SD)
60.50 (13.99)
60.79 (13.43)
56.47 (12.12)
59.32 (13.97)
0.00
2
Mean (SD)
21.86 (4.22)
21.61 (3.85)
21.01 (3.69)
21.59 (4.33)
0.00
BMI (kg/m )
P-values are derived from ANOVA tests (p-value < 0.05 was statistical significant), SD standard deviation
Abbreviation: TST triceps skinfold thickness, AST abdominal skinfold thickness, SST subscapular skinfold thickness, BMI body mass index
Alamolhoda et al. BMC Pediatrics
(2020) 20:191
Page 6 of 9
Table 3 associated factors with three anthropometric measures
in hierarchical model
Fixed Effects
Intercept
TST
AST
SST
Estimate SE
Estimate SE
Estimate SE
10.49*
1.17 11.11*
1.55 10.60*
1.34
3.02*
0.37 2.33*
0.49 2.17*
0.42
0.34 3.30*
0.45 3.49*
0.39
Sex
girls/boy
Family history of obesity
yes/no
2.25*
Physical activity
mild /vigorous
0.81
moderate/ vigorous 1.51
1.16 1.67
1.52 1.27
1.32
1.04 2.54*
1.40 2.24*
1.20
SES
moderate/low
0.81*
0.39 1.01*
0.52 0.80*
0.45
high/low
1.70*
0.66 2.25*
0.90 2.48*
0.77
group2/group1
−0.67*
0.34 −0.09
0.46 0.54
0.39
group3/group1
0.30
1.30 −1.09
1.76 1.75
1.51
0.06
0.08 0.15
0.10 0.11
0.09
Age groups
Screen time (min per day)
watching TV or
video games
Random Effects
TST
AST
SST
Variance
Estimate SE
Estimate SE
Estimate SE
Child-level
38.85
1.46 70.82
2.66 52.32
1.97
District-level
1.18
0.62 1.63
0.94 1.33
0.74
TST, AST SE
TST, SST SE
AST, SST SE
Covariance
Child-level
35.85
1.69 32.41
1.47 48.71
2.07
District-level
0.68
0.62 0.27
0.51 1.18
0.76
Child-level
0.68
–
0.72
–
0.80
–
District-level
0.49
–
0.21
–
0.80
–
Correlation
Abbreviation: TST triceps skinfold thickness, AST abdominal skinfold thickness,
SST subscapular skinfold thickness, SES socio-economic status
Age groups: group1 [14–16) years, group2 [16–18) years and group 3
[18–20] years
*p-value < 0.05
district levels. Moreover, positive correlations were also
observed between three outcomes at district level. This
finding implies that communities play an important role
in promotion of adolescent’s health. Therefore, health
behaviors associated with childhood obesity are influenced by a combination of behavioral and environmental
factors including community, school and family.
The prevalence of childhood obesity has sharply increased from 1990 to 2010 in low- and middle-income
countries compared to the developed countries [32],
which can have undesirable effects on physical, mental,
and psychosocial health in adolescents [33–35]. Studies
reported that, the prevalence of overweight and obesity
in adolescents varies in different parts of Iran [4, 19, 36].
People, who were living in the same region with the
same habits were similar in terms of growth, development, and body shape, which might be due to their lifestyle, dietary patterns, and socio-cultural factors [19, 20].
The results of Table 2 revealed that, there were statistically significant differences between the anthropometric
measures with respect to 4 districts. Therefore, the effect
of individual level risk factors may vary according to the
environment in which one lives.
To the best of our knowledge, limited studies have examined the association between individual factors and
adiposity indices across children through multivariate
multilevel analysis [20, 24]. Results of multivariate multilevel approach showed that, some risk factors associated
with the obesity in adolescents were consistent with
those reported in previous researches in Iran [19, 20,
37]. Results of multivariate multilevel analysis indicated
a statistically significant association between the sex,
family history of obesity, and SES with three anthropometric measures. Sex was positively and highly associated with three outcomes, proving that girls had higher
TST, AST, and SST than the boys. However, boys had
better growth in terms of height, weight and subsequently in BMI than the girls. These results were in line
with the previous studies which reported that, the percentage of subcutaneous adipose tissue was higher in females bodies than that of males due to their sedentary
lifestyle, less involvement in vigorous physical activities
and less expenditure of energy [7, 16]. Although, an
agreement has been proved between BMI and TST in
some studies [29, 38], BMI may not be a useful parameter in measuring the subcutaneous body fat of children,
because changing the body shape occurs in childhood.
Furthermore, it fails to differentiate the fat from the
muscle mass and may classify children with large muscle
into obese children group [18]. Shriraam et al. explained
that, BMI is a crude measure, which does not provide a
precise assessment of body density [10].
A positive association was found between family history of obesity and anthropometric measures similar to
other studies [20, 39]. Khashayar et al. reported that, the
odds of obesity in Iranian students with obese parents
were about 2 times greater than the others [19]. Environmental factors such as family lifestyle, eating habits
and also becoming obese due to the genetic factors are
considered as the subset of family history of obesity, and
are the most important reasons influencing the persistence of obesity in adulthood [4, 40, 41]. Therefore,
modification of diet, having proper physical activities,
and health care in the families could be an effective
Alamolhoda et al. BMC Pediatrics
(2020) 20:191
approach to decrease the risk of childhood and adulthood obesity.
In line with previous studies in Iran [19, 20], our findings showed positive relationships between SES with
three outcome variables, especially at high levels, which
revealed that higher risk of overweight/obesity is related
to the social environment. Bahreynian et al. study reported that the prevalence of overweight was greater in
areas with high SES, whereas underweight and short
stature were more prevalent in areas with low SES [42].
In the current study, students with higher anthropometric measures were living in families with higher SES, as
confirmed in some other studies conducted in Iran and
some other countries, in which positive significant associations were found between SES and adiposity among
children and adolescents in developing countries [20, 24,
43]. It is noteworthy that, the means of body fat, height,
weight, and prevalence of overweight and obesity were
lower in the students living in district 3 than other children (Table 2). Only 1.5% of families living in this district had a relatively high SES level and about 77% of
them were classified as families with low income, educational and occupational levels. These findings highlight
the need for planning to increase the level of awareness
in the families in order to improve their lifestyle, nutrition and try to have more physical activities.
Several studies have reported time spent in watching
TV or playing video games increased the risk of overweight/obesity in children [20, 24, 44]. Moreover, the results obtained in some studies revealed a negative
correlation between inactivity/sedentary behavior and
physical activities in children and adolescents [25, 45]. In
our study, however, there was no statistically significant
association between screen time and mild physical activities with anthropometric measures. The results of Table
2 revealed that, the subjects living in districts one and
four were more likely to be at risk of obesity with respect to body fat measures and BMI indices than other
groups. Adolescents living in these two districts had
more physical activities and also spent more time in
watching TV or playing computer games compared to
other two groups (Table 1). Watching TV and other sedentary behaviors increases the consumption of the most
advertised goods, including sweetened cereals, sweets,
salty snacks, and sweetened beverages leading to increased appetite, energy intake, thus affecting the body
weight in children [46]. Therefore, it seems that the
presence of one behavior may be so strong that it cannot
compensate for the presence of the other.
One of the strengths of the study was concerned with
the results obtained in the random effects section in
Table 3. The outcome variables were correlated at the
districts and the subject levels, confirming the appropriateness of classifying the individual and district in the
Page 7 of 9
second and third hierarchical levels. The major portion
of the total variance in TST (97.1%), AST (97.7%), and
SST (97.5%) was found at the child level, meaning that
children with higher TST tend to have high AST and
SST. Results also highlighted the importance of clustering in assessing the relationships between demographic
characteristics and anthropometric measures.
The cross-sectional nature of the study could be considered as a limitation in this study, because, it is not
clear how response variables are influenced by the covariates. Further studies could take a prospective and timebased approach to obtain more accurate results. Another
limitation is the use of a single self-reported item to assess family history of obesity and it may have introduced
a bias and underreporting of subjects. The lack of other
predictor variables related to adolescent obesity such as
eating habits, biological measures, as well as the selection of the district as the only variable in the third hierarchical level were also regarded as the third limitation
of the study.
Conclusion
The results of multivariate multilevel analysis showed
that sex, family history of obesity, and SES were significantly associated with three body fat measures and there
were positive correlation between three outcomes at the
child and district levels. Furthermore, these indices were
more prevalent among the students living in districts 1
and 4 than other two districts. Therefore, it is suggested
to develop effective interventions to prevent the effects
of individual and environmental undesirable factors on
childhood obesity in both family and community levels,
especially in these two districts.
Abbreviations
BMI: Body mass index; ST: Skinfold thickness;; WC: Waist circumference;
TST: Triceps skinfold thickness; AST: Abdominal skinfold thickness;
SST: Subscapular skinfold thickness; PA: Physical activity; SES: Socio-economic
status; IGLS: Iterative generalized least squares
Acknowledgements
The present study was supported by a grant from the Vice-chancellor for Research, Shiraz University of Medical Sciences, Shiraz, Iran. The authors would
also like to thank Center for Development of Clinical Research of Nemazee
Hospital and Dr. Nasrin Shokrpour for editorial assistance.
Authors’ contributions
MA contributed in analyzed the data, and interpreted the results, wrote the
manuscript drafting. ST contributed in designed the study, analysis of data,
interpretation the results. SMTA> contributed in interpretation the results
and designed the study. RT and MA contributed in interpretation the results
wrote the manuscript drafting. AA contributed in analysis of data and
interpretation the results. All authors have read and approved the
manuscript.
Funding
The research grant provided by Research Deputy of Shiraz University of
Medical Sciences (No. 98–01–62-20366). Funding body of the study did not
play any role in the design of the study, collection, analysis, and
interpretation of data and in writing the manuscript.
Alamolhoda et al. BMC Pediatrics
(2020) 20:191
Availability of data and materials
The datasets used and/or analyzed during the current study available from
the corresponding author on reasonable request.
Ethics approval and consent to participate
This study was approved by the ethics committee of Shiraz University of
Medical Sciences. All Children gave oral consent and their parents gave
written informed consent before participation in the study.
Page 8 of 9
17.
18.
19.
Consent for publication
Not applicable.
20.
Competing interests
The authors declare that they have no competing interests.
Author details
1
Health Policy Research Center, Institute of Health, Shiraz University of
Medical Sciences, Shiraz, Iran. 2Department of Biostatistics, Medical School,
Shiraz University of Medical Sciences, Shiraz, Iran. 3Department of
Mathematics, Yasouj University, Yasouj, Iran.
21.
Received: 31 October 2019 Accepted: 28 April 2020
23.
References
1. Wijnhoven TM, van Raaij JM, Spinelli A, Starc G, Hassapidou M, Spiroski I, et al.
WHO European childhood obesity surveillance initiative: body mass index and
level of overweight among 6–9-year-old children from school year 2007/2008
to school year 2009/2010. BMC Public Health. 2014;14(1):806.
2. Ogden CL, Fryar CD, Hales CM, Carroll MD, Aoki Y, Freedman DS.
Differences in obesity prevalence by demographics and urbanization in US
children and adolescents, 2013-2016. Jama. 2018;319(23):2410–8.
3. Rahmani A, Sayehmiri K, Asadollahi K, Sarokhani D, Islami F, Sarokhani M.
Investigation of the prevalence of obesity in Iran: a systematic review and
meta-analysis study. Acta Medica Iranica. 2015;53(10):596–607.
4. Rashidi H, Erfanifar A, Latifi SM, Payami SP, Aleali AM. Incidence of obesity,
overweight and hypertension in children and adolescents in Ahvaz
southwest of IRAN: five-years study. Diab Metab Syndr. 2019;13(1):201–5.
5. Djalalinia S, Kelishadi R, Qorbani M, Peykari N, Kasaeian A, Nasli-Esfahani E,
et al. A systematic review on the prevalence of overweight and obesity, in
iranian children and adolescents. Iranian J Pediatr. 2016;26:3.
6. Eshraghian A, Dabbaghmanesh MH, Eshraghian H, Fattahi MR, Omrani GR.
Nonalcoholic fatty liver disease in a cluster of Iranian popula-tion: thyroid
status and metabolic risk factors. Arch Iranian Med. 2013;16(10):584.
7. Freedman DS, Ogden CL, Kit BK. Interrelationships between BMI, skinfold
thicknesses, percent body fat, and cardiovascular disease risk factors among
US children and adolescents. BMC Pediatr. 2015;15(1):188.
8. Sahoo K, Sahoo B, Choudhury AK, Sofi NY, Kumar R, Bhadoria AS. Childhood
obesity: causes and consequences. Journal of family medicine and primary
care. 2015;4(2):187.
9. Fontaine KR, Redden DT, Wang C, Westfall AO, Allison DB. Years of life lost
due to obesity. Jama. 2003;289(2):187–93.
10. Mahadevan S, Ali I. Is body mass index a good indicator of obesity?
Springer; 2016.
11. Heydari S-T, Seyed-Mohammad-Taghi Ayatollahi NZ. Diagnostic value of
bioelectrical impedance analysis versus body mass index for detection of
obesity among students. Asian J Sports Med. 2011;2(2):68.
12. Addo OY, Himes JH. Reference curves for triceps and subscapular skinfold
thicknesses in US children and adolescents. Am J Clin Nutr. 2010;91(3):635–42.
13. Ayatollahi SMT, Mostajabi F. Triceps skinfold thickness centile charts in
primary school children in shiraz, Iran. Arch Iranian Med. 2008;11(2):210–3.
14. Yeung DCS, Hui SSC. Validity and reliability of skinfold measurement in
assessing body fatness of Chinese children. Asia Pac J Clin Nutr. 2010;19(3):
350–7.
15. de Quadros TMB, Gordia AP, Andaki ACR, Mendes EL, Mota J, Silva LR. Utility
of anthropometric indicators to screen for clustered cardiometabolic risk
factors in children and adolescents. J Pediatr Endocrinol Metab. 2019;32(1):
49–55.
16. Kristiansen H, Eide GE, Brannsether B, Roelants M, Bjerknes R, Júlíusson PB.
Associations between different weight-related anthropometric traits and
22.
24.
25.
26.
27.
28.
29.
30.
31.
32.
33.
34.
35.
36.
37.
38.
39.
lifestyle factors in Norwegian children and adolescents: a case for
measuring skinfolds. Am J Hum Biol. 2018;30(6):e23187.
Nooyens AC, Koppes LL, Visscher TL, Twisk JW, Kemper HC, Schuit AJ, et al.
Adolescent skinfold thickness is a better predictor of high body fatness in
adults than is body mass index: the Amsterdam growth and health
longitudinal study. Am J Clin Nutr. 2007;85(6):1533–9.
Dehghan M, Akhtar-Danesh N, Merchant AT. Childhood obesity, prevalence
and prevention. Heart Views. 2006;7(2):74–82.
Khashayar P, Kasaeian A, Heshmat R, Motlagh ME, Gorabi AM, Noroozi M,
et al. Childhood overweight and obesity and associated factors in iranian
children and adolescents: a multilevel analysis; the CASPIAN-IV study. Front
Pediatr. 2018;6.
Kelishadi R, Heidari Z, Kazemi I, Jafari-Koshki T, Mansourian M, Motlagh M-E,
et al. A hierarchical Bayesian tri-variate analysis on factors associated with
anthropometric measures in a large sample of children and adolescents: the
CASPIAN-IV study. J Pediatr Endocrinol Metab. 2018;31(4):443–9.
Mistry SK, Puthussery S. Risk factors of overweight and obesity in childhood
and adolescence in south Asian countries: a systematic review of the
evidence. Public Health. 2015;129(3):200–9.
Zhou H, Yamauchi T, Natsuhara K, Yan Z, Lin H, Ichimaru N, et al.
Overweight in urban schoolchildren assessed by body mass index and
body fat mass in Dalian, China. J Physiol Anthropol. 2006;25(1):41–8.
Heelan KA, Bartee RT, Nihiser A, Sherry B. Healthier school environment
leads to decreases in childhood obesity: the Kearney Nebraska story. Child
Obes. 2015;11(5):600–7.
Gomes T, Katzmarzyk P, Santos F, de Chaves R, Santos D, Pereira S, et al. Are
BMI and sedentariness correlated? A multilevel study in children. Nutrients.
2015;7(7):5889–904.
Gomes T, Hedeker D, dos Santos F, Souza M, Santos D, Pereira S, et al.
Relationship between sedentariness and moderate-to-vigorous physical
activity in youth: a multivariate multilevel study. Int J Environ Res Public
Health. 2017;14(2):148.
Heshmat R, Qorbani M, Ghoreshi B, Djalalinia S, Tabatabaie OR, Safiri S, et al.
Association of socioeconomic status with psychiatric problems and violent
behaviours in a nationally representative sample of Iranian children and
adolescents: the CASPIAN-IV study. BMJ Open. 2016;6(8):e011615.
Group WMGRS. WHO Child Growth Standards based on length/height,
weight and age. Acta Paediatrica (Oslo, Norway: 1992) Supplement. 2006;
450:76.
Md O, Onyango AW, Borghi E, Siyam A, Nishida C, Siekmann J.
Development of a WHO growth reference for school-aged children and
adolescents. Bull World Health Org. 2007;85:660–7.
Ayatollahi SMT, Bagheri Z, Heydari ST. Agreement analysis among measures
of thinness and obesity assessment in Iranian school children and
adolescents. Asian J Sports Med. 2013;4(4):272–80.
Goldstein H. Multilevel statistical models: John Wiley & Sons; 2011.
Hox JJ, Moerbeek M, van de Schoot R. Multilevel analysis: techniques and
applications (quantitative methodology). New York: Taylor & Francis; 2010.
De Onis M, Borghi E, Arimond M, Webb P, Croft T, Saha K, et al. Prevalence
thresholds for wasting, overweight and stunting in children under 5 years.
Public Health Nutr. 2019;22(1):175–9.
Pulgaron ER. Childhood obesity: a review of increased risk for physical and
psychological comorbidities. Clin Ther. 2013;35(1):A18–32.
Sanders RH, Han A, Baker JS, Cobley S. Childhood obesity and its physical
and psychological co-morbidities: a systematic review of Australian children
and adolescents. Eur J Pediatr. 2015;174(6):715–46.
Rankin J, Matthews L, Cobley S, Han A, Sanders R, Wiltshire HD, et al.
Psychological consequences of childhood obesity: psychiatric comorbidity
and prevention. Adolescent Health Med Ther. 2016;7:125.
Kelishadi R, Haghdoost A-A, Sadeghirad B, Khajehkazemi R. Trend in the
prevalence of obesity and overweight among Iranian children and adolescents: a
systematic review and meta-analysis. Nutrition. 2014;30(4):393–400.
Baygi F, Dorosty AR, Kelishadi R, Qorbani M, Asayesh H, Mansourian M, et al.
Determinants of childhood obesity in representative sample of children in
North East of Iran. Cholesterol. 2012. />Selvi A, Naaraayan SA, Priyadharishini D, Begum NS. Comparison of various
body fat indices in early and mid-adolescents of South India: school-based
cross-sectional study. Indian J Child Health. 2018:124–7.
Chung AE, Skinner AC, Steiner MJ, Perrin EM. Physical activity and BMI in a
nationally representative sample of children and adolescents. Clin Pediatr.
2012;51(2):122–9.
Alamolhoda et al. BMC Pediatrics
(2020) 20:191
40. Li L, Yin J, Cheng H, Wang Y, Gao S, Li M, et al. Identification of genetic and
environmental factors predicting metabolically healthy obesity in children:
data from the BCAMS study. J Clin Endocrinology Metab. 2016;101(4):1816–25.
41. Portela DS, Vieira TO, Matos SM, de Oliveira NF, Vieira GO. Maternal obesity,
environmental factors, cesarean delivery and breastfeeding as determinants
of overweight and obesity in children: results from a cohort. BMC
Pregnancy Childbirth. 2015;15(1):94.
42. Bahreynian M, Motlagh ME, Qorbani M, Heshmat R, Ardalan G, Kelishadi R.
Prevalence of growth disorders in a nationally representative sample of
Iranian adolescents according to socioeconomic status: the CASPIAN-III
study. Pediatri Neonatology. 2015;56(4):242–7.
43. Yusefzadeh H, Rahimi B, Rashidi A. Economic burden of obesity: a
systematic review. Soc Health Behav. 2019;2:7–12.
44. Schmidt ME, Haines J, O'brien A, McDonald J, Price S, Sherry B, et al.
Systematic review of effective strategies for reducing screen time among
young children. Obesity. 2012;20(7):1338–54.
45. Leech RM, McNaughton SA, Timperio A. The clustering of diet, physical
activity and sedentary behavior in children and adolescents: a review. Int J
Behav Nutr Phys Act. 2014;11(1):4.
46. Carandente F, Roveda E, Montaruli A, Pizzini G. Nutrition, activity behavior
and body constitution in primary school children. Biol Sport. 2009;26:4.
Publisher’s Note
Springer Nature remains neutral with regard to jurisdictional claims in
published maps and institutional affiliations.
Page 9 of 9