Prognostic and predictive factors for Taiwanese patients with advanced biliary tract cancer undergoing frontline chemotherapy with gemcitabine and cisplatin: A real-world experience
Bạn đang xem bản rút gọn của tài liệu. Xem và tải ngay bản đầy đủ của tài liệu tại đây (664.54 KB, 12 trang )
Wu et al. BMC Cancer
(2020) 20:422
/>
RESEARCH ARTICLE
Open Access
Prognostic and predictive factors for
Taiwanese patients with advanced biliary
tract cancer undergoing frontline
chemotherapy with gemcitabine and
cisplatin: a real-world experience
Chiao-En Wu1, Wen-Chi Chou1, Chia-Hsun Hsieh1, John Wen-Cheng Chang1, Cheng-Yu Lin2, Chun-Nan Yeh3*† and
Jen-Shi Chen1*†
Abstract
Background: Chemotherapy with gemcitabine and cisplatin has been the standard of care in first-line
chemotherapy for advanced biliary tract cancer (BTC) since the trial ABC-02 was published in 2010. We aimed to
investigate the prognostic and predictive factors of this regimen in a cohort of Taiwanese patients with advanced
BTC.
Methods: A total of 118 patients with histologically confirmed BTC treated at Chang Gung Memorial Hospital at
Linkou from 2012 to 2017 were retrospectively reviewed.
Results: The median progression-free survival (PFS) and overall survival (OS) were 3.6 months and 8.4 months,
respectively. In the multivariate analysis, neutrophil to lymphocyte ratio (NLR) > 7.45, biliary drainage requiring both
percutaneous transhepatic cholangiography drainage (PTCD) and internal stenting, and tumor responses with
progressive diseases and not assessed were independent poor prognostic factors for PFS. Male sex, NLR > 7.45,
alkaline phosphatase> 94 U/L, biliary drainage requiring both PTCD and internal stenting, and tumor responses with
stable disease, progressive diseases and not assessed were independent poor prognostic factors for OS. Monocyte
to lymphocyte ratio (MLR) ≤ 0.28 was the only significant predictive factor for the tumor response. Patients with
complete response/partial response had significantly lower MLR than patients with other tumor responses.
(Continued on next page)
* Correspondence: ;
†
Chun-Nan Yeh and Jen-Shi Chen contributed equally to this work.
3
Department of General Surgery, Chang Gung Memorial Hospital at Linkou,
Chang Gung University College of Medicine, 5, Fu-Hsing Street, Kwei-Shan,
Taoyuan, Taiwan
1
Division of Haematology-Oncology, Department of Internal Medicine,
Chang Gung Memorial Hospital at Linkou, Chang Gung University College of
Medicine, 5, Fu-Hsing Street, Kwei-Shan, Taoyuan, Taiwan
Full list of author information is available at the end of the article
© The Author(s). 2020 Open Access This article is licensed under a Creative Commons Attribution 4.0 International License,
which permits use, sharing, adaptation, distribution and reproduction in any medium or format, as long as you give
appropriate credit to the original author(s) and the source, provide a link to the Creative Commons licence, and indicate if
changes were made. The images or other third party material in this article are included in the article's Creative Commons
licence, unless indicated otherwise in a credit line to the material. If material is not included in the article's Creative Commons
licence and your intended use is not permitted by statutory regulation or exceeds the permitted use, you will need to obtain
permission directly from the copyright holder. To view a copy of this licence, visit />The Creative Commons Public Domain Dedication waiver ( applies to the
data made available in this article, unless otherwise stated in a credit line to the data.
Wu et al. BMC Cancer
(2020) 20:422
Page 2 of 12
(Continued from previous page)
Conclusion: We identified three important prognostic factors, namely tumor response, NLR, and biliary drainage
requiring both PTCD and internal stenting for both PFS and OS. MLR was the only significant predictive factor for
the tumor response. These findings could provide physicians with more information to justify the clinical outcomes
in patients with advanced BTC in real-world practice.
Keywords: Biliary tract cancer, Chemotherapy, Gemcitabine, Cisplatin, Prognostic factor
Background
Biliary tract cancers (BTCs) are a group of relatively rare
cancers arising from the epithelium of the biliary tract.
Their incidence keeps increasing worldwide [1–3]. BTCs
including intrahepatic cholangiocarcinoma (iCCA), common bile duct cancer, gallbladder cancer, and ampullary
cancer have aggressive biological behaviour, as they are
diagnosed at an advanced stage with poor prognosis or
high recurrence rate after primary operation [4]. Chemotherapy with gemcitabine and cisplatin has been the
standard of care in first-line chemotherapy since the trial
ABC-02 was published in 2010 [5]. Some clinical trials
have evaluated molecular targeted therapies in combination with chemotherapy and some phase II trials have
shown improvement in the patients’ survival outcomes.
However, all the completed phase III trials [6–9] and
most phase II studies [10–13] did not demonstrate significant improvement in progression-free survival (PFS)
and overall survival (OS) [14]. Therefore, chemotherapy
is still the standard treatment in advanced BTC.
We previously assessed the efficacy and safety of a
chemotherapy regimen with gemcitabine and cisplatin in
30 patients with advanced BTC in a study published in
2012 and showed that this regimen was feasible with
manageable toxicity in clinical practice [15]. Currently,
this regimen is still the standard of care for advanced
BTC and has been reimbursed by Taiwan national health
insurance since 2016. Therefore, we aimed to investigate
the prognostic and predictive factors of this regimen in a
larger cohort of Taiwanese patients with advanced BTC.
Methods
Patients
All patients with histologically confirmed BTC treated at
the Chang Gung Memorial Hospital (CGMH), Linkou
from 2012 to 2017 were retrospectively reviewed. A total
of 118 patients with advanced BTC undergoing chemotherapy with gemcitabine and cisplatin were enrolled for
further analysis.
Treatment
The chemotherapy regimen consisted of gemcitabine
1000 mg/m2 and cisplatin 30 mg/m2 on day 1 and day 8
every 3 weeks according to the treatment guidelines
followed at CGMH, Linkou [15]. The dose and the
schedule might be adjusted by the physicians according
to patients’ clinical status and toxicity from the chemotherapy. The tumor response was evaluated by computed tomography (CT) scan every 3–4 months or as
needed.
Patients’ characteristics and evaluation of outcomes
All patients with advanced BTC treated from 2012 to
2017 were retrospectively reviewed and the patients
undergoing gemcitabine and cisplatin as first-line
chemotherapy were included in the current study. The
patients were followed-up until 31 October 2018. Patients’ characteristics including sex, age, Eastern Cooperative Oncology Group (ECOG) performance status,
cancer sites according to the international classification
of diseases (10th version), and tumour involvement
(primary tumours, regional lymph nodes, and distant
metastases) were recorded. The patients with biliary obstruction requiring biliary drainage before chemotherapy
were recorded and all the patients should keep drainage
lifelong unless surgical intervention could be performed.
The patients requiring biliary drainage after starting
chemotherapy were not counted in current study as
most of them occurred due to disease in progression.
Baseline haemogram and biochemistry including white
blood cells, differential counts of white blood cells, platelet count, albumin, total bilirubin, alkaline phosphatase
(ALP), alanine aminotransferase, creatinine, carbohydrate antigen 19–9 (CA19–9), and carcinoembryonic
antigen (CEA) were recorded. Neutrophil to lymphocyte
ratio (NLR), monocyte to lymphocyte ratio (MLR), and
platelet to lymphocyte ratio were calculated.
To analyze the NLR, MLR, PLR as the prognostic factors for survivals, recursive partitioning analysis, a statistical method of the survival tree developed by Hothorn,
et al. [16] was used to establish an optimal cut-off point
that predicts the survivals. However, no significant cutoff value was found for MLR and PLR so the cut-off
points of the MLR and PLR were determined by ROC
analysis using Youden’s index. The thresholds employed
for albumin, ALT, bilirubin, ALP, creatinine, CA19–9,
CEA were the limit of their respective normalcy ranges.
The best response including complete response (CR),
partial response (PR), stable disease (SD), and progressive disease (PD) were evaluated using the RECIST 1.1
Wu et al. BMC Cancer
(2020) 20:422
criteria. Patients who experienced rapid deterioration
but lacked the images documented before death were recorded as not assessed (N/A). Response rate (RR) was
the sum of CR and PR and disease control rate (DCR)
was the sum of CR, PR, and SD. The median PFS was
defined from the first day of the treatment to the first
evidence of disease progression, death, or last follow-up.
The median OS was defined from the first day of the
treatment to the day of death or last follow-up.
Statistical analysis
To identify the possible predictive factors, Pearson’s chisquared test of independence was used for categorical
variables. Kruskal-Wallis test, a nonparametric (distribution-free) test, was used for the continuous variables.
The survival was estimated using the Kaplan-Meier
method and comparison of survival was performed by
the log-rank test. Univariate and multivariate analyses
were performed to evaluate possible prognostic factors.
Only the significant prognostic factors were further analysed using the multivariate analysis. IBM SPSS Statistics
for Windows (Version 20.0, Chicago, IL, USA) was used
for statistical analyses and P < 0.05 was considered statistically significant. This study was approved by the institutional review board of Chang Gung Medical
Foundation (201901322B0).
Results
Patient characteristics
A total of 118 patients with advanced BTC undergoing
chemotherapy with gemcitabine and cisplatin as firstline treatment were enrolled in the current study. The
mean age was 61.0 years. Sixty patients (50.8%) were female and 58 patients (49.6%) were male. Most of the patients had ECOG performance status≤ 1 (n = 102, 86.4%).
The clinical features and tumour involvements are summarised in Table 1.
Efficacy of chemotherapy with gemcitabine plus cisplatin
Among the patients with evaluable response, one patient
achieved CR, 14 achieved PR, 41 achieved SD, and 48
had PD as their best response. Fourteen patients had no
response evaluation and the majority of them experienced rapid progression without radiological confirmation. The RR and DCR in the entire cohort were 12.7
and 47.5%, respectively. Among all the evaluable patients, they were 14.4 and 53.8%, respectively. The median PFS and OS were 3.6 months (95% CI: 2.8–4.4
months) and 8.4 months (95% CI: 6.5–10.2 months),
respectively.
Identification of prognostic factors for PFS (Table 2)
In the univariate analysis, primary cancer sites (p =
0.011), NLR (p = 0.020), MLR (p = 0.028), biliary drainage
Page 3 of 12
(p = 0.047), metastases to lung (p < 0.001), metastases to
liver (p = 0.034), and tumor response (p < 0.001) were
significant prognostic factors for PFS.
In the multivariate analysis, NLR > 7.45 (vs. NLR ≤ 7.45,
HR: 1.982, 95% CI: 1.040–3.777, p = 0.038) (Fig. 1a), biliary
drainage requiring both percutaneous transhepatic cholangiography drainage (PTCD) and internal stenting (vs.
internal drainage, HR: 8.710, 95% CI: 1.831–41.445, p =
0.007) (Fig. 1c), and tumor responses with PD (vs. CR/PR,
HR: 55.556, 95% CI: 19.467–158.550, p < 0.0001) and N/A
(vs. CR/PR, HR: 63.905, 95% CI: 20.396–200.232, p <
0.0001) (Fig. 1e) were independent poor prognostic factors
for PFS.
Identification of prognostic factors for OS (Table 3)
In the univariate analysis, sex (p = 0.028), NLR (p =
0.032), MLR (p = 0.005), ALP (p = 0.007), biliary drainage
(p = 0.045), metastases to lung (p = 0.009), metastases to
peritoneum (p = 0.032), and tumor response (p < 0.001)
were significant prognostic factors for OS.
In the multivariate analysis, male sex (vs. female, HR:
1.782, 95% CI: 1.151–2.759, p = 0.010), NLR > 7.45 (vs.
NLR ≤ 7.45, HR: 1.922, CI: 1.009–3.663, p = 0.047) (Fig.
1b), ALP > 94 U/L (vs. ALP ≤ 94 U/L, HR: 2.523, 95% CI:
1.470–4.331, p = 0.001), biliary drainage requiring both
PTCD and internal stenting (vs. internal drainage, HR:
6.024, 95% CI: 1.253–28.969, p = 0.025) (Fig. 1d), tumor
responses with SD (vs. CR/PR, HR: 2.430, 95% CI:
1.012–5.838, p = .047), tumor responses with PD (vs.
CR/PR, HR: 10.994, 95% CI: 4.397–27.489, p < .0001),
and tumor responses with N/A (vs. CR/PR, HR: 109.903,
95% CI: 33.541–360.113, p < .0001) (Fig. 1f) were independent poor prognostic factors for OS.
Identification of predictive factors for response
Since tumor response was the most significant prognostic factor for PFS and OS, we opted to find the possible
predictive factors for the tumor response (Table 1).
MLR ≤ 0.28 was the only significant predictive factor for
the tumor responses (p = 0.007). In addition, the patients
with CR/PR had significantly lower MLR than the patients with other tumor responses (p = 0.043).
Elevated ALP was associated with poor response to
gemcitabine and cisplatin. However, this association did
not reach statistical significance (p = 0.061). In terms of
the association between tumour involvement and tumor
response, lung metastases showed a non-significant association with tumor response (p = .069). None of the
patients with lung metastases experienced clinical
response in the current study. The RR and DCR in lungmetastatic cases were 0 and 30.4%, respectively. Among
non-lung-metastatic cases, they were 15.8 and 51.6%, respectively. All the patients who achieved clinical response, had primary tumours. In other words, the
Wu et al. BMC Cancer
(2020) 20:422
Page 4 of 12
Table 1 Patients’ Characteristics and Association with Tumor Response
Characteristics
Age, median (IQR)
Total (N =
118)
Tumor Response
CR/PR
(N = 15)
SD
(N = 41)
PD/NA
(N = 62)
61.0 (14.0)
61.0 (45.0)
60 (15.0)
61.5 (13.0)
.890
.972
≦65
74 (62.7)
9 (60.0)
26 (63.4)
39 (62.9)
> 65
44 (37.3)
6 (40.0)
15 (36.6)
23 (37.1)
Male
58 (49.2)
7 (46.7)
18 (43.9)
33 (53.2)
Female
60 (50.8)
8 (53.3)
23 (56.1)
29 (46.8)
Gender
P
value
.637
ICD-10 cancer site
.390
C22.1 - ICCA
86 (72.9)
10 (66.7)
33 (80.4)
43 (69.4)
C23/C24.9 -GB/others
18 (15.3)
2 (13.3)
4 (9.8)
12 (19.4)
C24.0 – ECCA
9 (7.6)
3 (20.0)
2 (4.9)
4 (6.5)
C24.1 – Ampullary
5 (4.2)
0
2 (4.9)
3 (4.7)
0/1
102 (86.4)
15 (100.0)
35 (85.4)
52 (83.9)
2/3
16 (13.6)
0
6 (14.6)
10 (16.1)
3.9 (3.4)
3.4 (4.6)
3.3 (3.1)
4.4 (3.2)
.202
.559
Performance status
NLR
.254
≦7.45
100 (84.7)
14 (93.3)
35 (85.4)
51 (82.3)
> 7.45
18 (15.3)
1 (6.7)
6 (14.6)
11 (17.7)
MLR
0.40 (0.32)
0.26 (0.28)
0.29 (0.32)
0.43 (0.31)
.043
≦0.28
40 (33.9)
8 (53.3)
19 (46.3)
13 (21.0)
.007
> 0.28
78 (66.1)
7 (46.7)
22 (53.7)
49 (79.0)
151.9 (121.2)
173.8 (115.5)
132.7 (114.4)
161.7 (121.7)
.364
.065
PLR
≦136.4
47 (39.8)
6 (40.0)
22 (53.7)
19 (30.6)
> 136.4
71 (60.2)
9 (60.0)
19 (46.3)
43 (69.4)
Albumin (g/dL)
3.8 (0.9)
4.0 (1.1)
3.8 (0.8)
3.7 (0.8)
.252
≦3.5
33 (31.4)
5 (33.3)
8 (22.9)
20 (36.4)
.399
> 3.5
72 (68.6)
10 (66.7)
27 (77.1)
35 (63.6)
30.0 (34.0)
30.0 (31.0)
36.0 (56.0)
27.0 (24.0)
.321
.532
ALT (U/L)
≦36
68 (58.1)
9 (60.0)
21 (51.2)
38 (62.3)
> 36
49 (41.9)
6 (40.0)
20 (48.8)
23 (37.7)
Bilirubin (mg/dL)
0.7 (0.8)
0.4 (0.9)
0.6 (0.9)
0.7 (0.9)
.221
≦1.3
89 (76.1)
12 (80.0)
31 (75.6)
46 (75.4)
.929
> 1.3
28 (23.9)
3 (20.0)
10 (24.4)
15 (24.6)
159.5 (168.0)
106.0 (124.5)
159.0 (207.0)
173.0 (147.0)
.108
.061
ALP (U/L)
≦94
30 (26.8)
7 (50.0)
11 (29.7)
12 (19.7)
> 94
82 (73.2)
7 (50.0)
26 (70.3)
49 (80.3)
Creatinine (mg/dL)
0.7 (0.4)
0.7 (0.4)
0.6 (0.3)
0.7 (0.4)
.814
≦1.27
115 (97.5)
15 (100.0)
39 (95.1)
61 (98.4)
.470
> 1.27
3 (2.5)
0
2 (4.9)
1 (1.6)
282.4 (2808.4)
221.9 (3604.4)
389.9 (1952.9)
260.7 (3096.2)
.621
.079
CA19–9 (U/mL)
≦37
35 (29.9)
5 (33.3)
7 (17.1)
23 (37.7)
> 37
82 (70.1)
10 (66.7)
34 (82.9)
38 (62.3)
4.3 (15.3)
4.7 (21.2)
3.1 (10.3)
5.6 (19.5)
CEA (ng/mL)
.259
Wu et al. BMC Cancer
(2020) 20:422
Page 5 of 12
Table 1 Patients’ Characteristics and Association with Tumor Response (Continued)
Characteristics
Total (N =
118)
Tumor Response
CR/PR
(N = 15)
SD
(N = 41)
PD/NA
(N = 62)
≦5
64 (54.2)
8 (53.3)
26 (63.4)
30 (48.4)
>5
54 (45.8)
7 (46.7)
15 (36.6)
32 (51.6)
Biliary drainage
P
value
.324
.398
None
88 (74.6)
9 (60.0)
31 (75.7)
48 (77.5)
Internal stenting
8 (6.8)
3 (20.0)
3 (7.3)
2 (3.2)
PTCD
19 (16.1)
3 (20.0)
6 (14.6)
10 (16.1)
Both
3 (2.5)
0
1 (2.4)
2 (3.2)
Tumor involvement
Primary tumor
.116
No
8 (6.8)
0
1 (2.4)
7 (11.3)
Yes
110 (93.2)
15 (100.0)
40 (97.6)
55 (88.7)
No
42 (35.6)
7 (46.7)
13 (31.7)
22 (35.5)
Yes
76 (64.4)
8 (53.3)
28 (68.3)
40 (64.5)
Regional LAP
.585
Lung
.069
No
95 (80.5)
15 (100.0)
34 (82.9)
46 (74.2)
Yes
23 (19.5)
0
7 (17.1)
16 (25.8)
No
105 (89.0)
14 (93.3)
37 (90.2)
54 (87.1)
Yes
13 (11.0)
1 (6.7)
4 (9.8)
8 (12.9)
Bone
.748
Liver
.465
No
69 (58.5)
10 (66.7)
26 (63.4)
33 (53.2)
Yes
49 (41.5)
5 (33.3)
15 (36.6)
29 (46.8)
No
96 (81.4)
14 (93.3)
33 (80.5)
49 (79.0)
Yes
22 (18.6)
1 (6.7)
8 (19.5)
13 (21.0)
Peritoneum
.436
Distant LAP
.969
No
102 (86.4)
13 (86.7)
35 (85.4)
54 (87.1)
Yes
16 (13.6)
2 (13.3)
6 (14.6)
8 (12.9)
Figures are numbers with percentages in parentheses, unless otherwise stated
The Chi-Squared test of independence: categorical variable
The Kruskal-Wallis test is a nonparametric (distribution free) test: continuous variable
IQR Interquartile, CR Complete response, PR Partial response, SD Stable disease, PD Progressive disease, NA Not assessed ALP Alkaline phosphatase, ALT Alanine
aminotransferase, NLR Neutrophil to lymphocyte ratio, MLR Monocyte to lymphocyte ratio, PLR Platelet to lymphocyte ratio, LAP Lymphadenopathy, PTCD
Percutaneous transhepatic cholangiography drainage, ICCA Intrahepatic cholangiocarcinoma, ECCA Extrahepatic cholangiocarcinoma, GB Gallbladder
patients who had recurrences after the curative operation, suffered from poor clinical response to first-line
chemotherapy with gemcitabine and cisplatin.
Discussion
In the present study, we retrospectively reviewed 118 patients with advanced BTC undergoing chemotherapy
with gemcitabine and cisplatin as first-line treatment.
The RR, DCR, median PFS, and OS were 12.7, 47.5%,
3.6 months, and 8.4 months, respectively in the entire
cohort. Tumor response, NLR, and biliary drainage requiring both PTCD and internal stenting were the common independent prognostic factors for both PFS and
OS. In addition, MLR ≤ 0.28 was the only significant predictive factor for the tumor response.
The clinical outcomes of advanced BTC patients
undergoing chemotherapy in current study were not as
good as previous clinical trials [5, 17]. Besides the difference of patients’ recruitment between clinical trials and
retrospective study, a major reason may be the
Wu et al. BMC Cancer
(2020) 20:422
Page 6 of 12
Table 2 Univariate and multivariate analysis of prognostic factors in patients with (PFS)
Parameters
Median (months)
95% CI
Age
≦65 (n = 74)
3.8
2.7–4.9
> 65 (n = 44)
3.3
2.3–4.2
Male (n = 58)
2.8
2.2–3.4
Female (n = 60)
4.0
2.8–5.3
Gender
ICD-10 cancer site
P
value
Hazard ratio
.821
–
.540
–
95% CI
P
value
.011
C22.1 – ICCA (n = 86)
3.9
2.6–5.2
0.877
0.321–2.397
.799
C23/C24.9 –GB/others (n = 18)
2.7
2.4–3.0
1.568
0.510–4.819
.433
C24.0 – ECCA (n = 9)
8.0
0.0–24.4
1
C24.1 – Ampullary (n = 5)
3.3
1.7–4.8
1.519
0.378–6.110
.556
0/1 (n = 102)
3.8
2.7–4.9
2/3 (n = 16)
2.7
1.8–3.7
1.040–3.777
.038
0.737–2.162
.396
Performance status
.260
NLR
–
.020
≦7.45 (n = 100)
3.8
2.8–4.8
1
> 7.45 (n = 18)
2.4
1.4–3.3
1.982
≦0.28 (n = 40)
5.9
4.3–7.4
> 0.28 (n = 78)
2.9
2.5–3.3
MLR
.028
PLR
≦136.4 (n = 47)
4.8
2.9–6.8
> 136.4 (n = 71)
3.1
2.7–3.5
≦3.5 (n = 33)
3.1
2.6–3.6
> 3.5 (n = 72)
3.9
2.8–4.9
Albumin (g/dL)
ALT (U/L)
≦36 (n = 68)
3.2
2.3–4.0
> 36 (n = 49)
4.3
2.8–5.7
≦1.3 (n = 89)
3.8
2.6–5.0
> 1.3 (n = 28)
3.3
2.4–4.1
Bilirubin (mg/dL)
ALP (U/L)
≦94 (n = 30)
5.9
2.5–9.2
> 94 (n = 82)
2.8
2.4–3.3
≦1.27 (n = 115)
3.6
2.6–4.6
> 1.27 (n = 3)
2.7
0.0–6.7
Creatinine (mg/dL)
CA19–9 (U/mL)
≦37 (n = 35)
2.9
2.3–3.4
> 37 (n = 82)
4.3
2.7–5.9
4.3
3.0–5.7
CEA (ng/mL)
≦5 (n = 64)
1
1.263
.396
–
.777
–
.484
–
.622
–
.060
–
.612
–
.263
–
.347
–
Wu et al. BMC Cancer
(2020) 20:422
Page 7 of 12
Table 2 Univariate and multivariate analysis of prognostic factors in patients with (PFS) (Continued)
Parameters
Median (months)
95% CI
3.2
2.7–3.6
None (n = 88)
3.2
2.4–4.0
1.396
Internal drainage(n = 8)
7.6
3.2–12.1
1
PTCD (n = 19)
3.4
2.8–4.0
Both (n = 3)
1.3
0.5–2.1
No (n = 8)
2.6
2.1–3.1
Yes (n = 110)
3.8
2.7–4.8
> 5 (n = 54)
Biliary drainage
P
value
Hazard ratio
95% CI
P
value
.047
0.497–3.921
.527
0.711
0.244–2.066
.531
8.710
1.831–41.445
.007
0.905–3.112
.101
0.759–1.998
.398
Tumor involvement
Primary tumor
Regional LAP
No (n = 42)
3.9
2.6–5.1
Yes (n = 76)
3.2
2.3–4.1
No (n = 95)
4.3
3.0–5.6
Yes (n = 23)
2.6
2.2–3.1
Lung
.081
–
.679
–
<.001
Bone
1
1.678
.181
No (n = 105)
3.8
2.7–4.8
Yes (n = 13)
3.4
2.3–4.5
No (n = 69)
4.3
2.2–6.3
Yes (n = 49)
3.2
2.1–4.2
Liver
.034
Peritoneum
No (n = 96)
3.9
2.5–5.2
Yes (n = 22)
3.1
2.5–3.7
No (n = 102)
3.4
2.3–4.5
Yes (n = 16)
3.6
2.5–4.7
Distant LAP
Tumor Response
1
1.232
.138
–
.785
–
<.0001
CR/RR (n = 15)
14.1
7.9–20.2
1
SD (n = 41)
7.6
6.4–8.8
1.819
0.824–4.015
.139
PD (n = 48)
2.5
2.4–2.7
55.556
19.467–158.550
<.0001
N/A (n = 14)
1.3
0.8–1.9
63.905
20.396–200.232
<.0001
CI Confidence interval, CR Complete response, PR Partial response, SD Stable disease, PD Progressive disease, N/A Not assessed, ALP Alkaline phosphatase, ALT
Alanine aminotransferase, NLR Neutrophil to lymphocyte ratio, MLR Monocyte to lymphocyte ratio, PLR Platelet to lymphocyte ratio, LAP Lymphadenopathy, PTCD
Percutaneous transhepatic cholangiography drainage, ICCA Intrahepatic cholangiocarcinoma, ECCA Extrahepatic cholangiocarcinoma, GB Gallbladder
proportion of the cancer sites. In current study, majority
of patients (n = 86, 72.9%) patients had iCCA which was
higher than in ABC-02 and BT-22 trials, and iCCA was
considered a poor prognostic factor in BTC [18, 19].
Previous studies have addressed the prognostic factors
in patients with advanced BTC undergoing chemotherapy.
Park et al. retrospectively analysed the prognostic factors
for OS in patients from prospective phase II or retrospective studies. They identified metastatic BTC, iCCA, liver
metastases, ECOG performance status, and ALP as independent prognostic factors [19]. The patients in the aforementioned study received TS-1, gemcitabine/capecitabine,
or capecitabine/cisplatin, which is not the standard of care
currently. However, these prognostic factors might not be
limited to such regimens, as some of the prognostic factors were validated in the subsequent studies.
Other studies have evaluated the prognostic factors for
advanced BTC treated with gemcitabine and cisplatin as
Wu et al. BMC Cancer
(2020) 20:422
Page 8 of 12
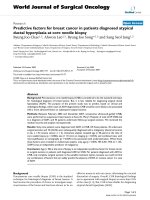
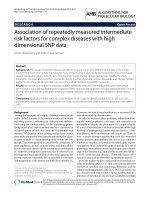
Fig. 1 The Kaplan-Meier survival curves of PFS (a, c, e) and OS (b, d, f) for patients, stratified according to independent prognostic factors, NLR (A,
B), biliary drainage (c, d) and tumor responses (e, f). PFS, progression-free survival; OS, overall survival; NLR, neutrophil to lymphocyte ratio; PTCD,
percutaneous transhepatic cholangiography drainage; CR, complete response; PD, partial response; SD, stable disease, PD progressive disease; N/
A, not assessed
first-line treatment. The results were similar to the
current study. Peixoto et al. retrospectively analysed 106
patients and found that poor ECOG performance status
was the only significant unfavourable prognostic factor
for OS. In addition, the location of the primary tumour
and the sites of advanced BTC were the suggested prognostic factors, although they did not achieve statistical
significance [20]. Ishimoto et al. reported 77 patients
with pure iCCA and observed that lactate dehydrogenase
(LDH), C-reactive protein (CRP), and CEA levels were
significantly associated with OS in the multivariate analysis [21]. Suzuki et al. analysed 307 patients and identified poor ECOG performance status, elevated serum
LDH, and elevated NLR as independent unfavourable
prognostic factors [22]. Salati et al. illustrated NLR,
ECOG performance status, CA19–9 and the prognostic nutritional index (PNI), an indicator derived from
serum albumin and peripheral lymphocyte count,
were prognostic factors for OS in patients undergoing
first-line chemotherapy of platinum/gemcitabine combination [23].
In the ABC-02 trial, patients with BTC received either
gemcitabine alone or gemcitabine and cisplatin as firstline chemotherapy. In addition to the combined gemcitabine/cisplatin regimen, metastatic disease and ECOG
performance status were prognostic factors after the univariate analysis [24]. Derived neutrophil lymphocyte ratio (dNLR) was calculated by the formula absolute
Wu et al. BMC Cancer
(2020) 20:422
Page 9 of 12
Table 3 Univariate and multivariate analysis of prognostic factors in patients with (OS)
Parameters
Median (months)
95% CI
Age
P
value
.285
≦65 (n = 74)
10.0
8.0–12.0
> 65 (n = 44)
6.9
5.4–8.3
Male (n = 58)
6.1
3.6–8.6
Female (n = 60)
11.0
9.1–12.9
Gender
Hazard ratio
P
value
–
.028
ICD-10 cancer site
1.782
8.7
6.6–10.9
C23/C24.9 –GB/others (n = 18)
6.1
4.5–7.8
C24.0 – ECCA (n = 9)
10.0
3.3–16.7
C24.1 – Ampullary (n = 5)
12.5
8.5–16.6
0/1 (n = 102)
9.0
7.2–10.8
2/3 (n = 16)
3.2
0.0–7.6
Performance status
1.151–2.759
.010
0.568–2.084
.798
1.009–3.663
.047
0.793–2.328
.264
1.470–4.331
.001
1
.143
C22.1 – ICCA (n = 86)
–
.006
NLR
1
1.089
.032
≦7.45 (n = 100)
8.9
6.8–11.1
1
> 7.45 (n = 18)
2.7
0.0–7.6
1.922
≦0.28 (n = 40)
12.5
11.1–13.9
> 0.28 (n = 78)
5.9
3.6–8.3
MLR
.005
PLR
≦136.4 (n = 47)
9.8
7.4–12.1
> 136.4 (n = 71)
7.7
6.1–9.3
≦3.5 (n = 33)
5.9
2.0–9.8
> 3.5 (n = 72)
9.7
6.8–12.6
Albumin (g/dL)
ALT (U/L)
≦36 (n = 68)
8.1
6.7–9.8
> 36 (n = 49)
9.0
5.7–12.3
≦1.3 (n = 89)
9.7
7.7–11.7
> 1.3 (n = 28)
7.5
5.6–9.3
Bilirubin (mg/dL)
ALP (U/L)
1
1.359
.839
–
.244
–
.819
–
.696
–
.007
≦94 (n = 30)
13.1
10.2–16.1
1
> 94 (n = 82)
6.3
4.2–8.3
2.523
≦1.27 (n = 115)
8.7
6.9–10.5
> 1.27 (n = 3)
3.2
0.0–8.0
Creatinine (mg/dL)
CA19–9 (U/mL)
≦37 (n = 35)
6.3
4.5–8.0
> 37 (n = 82)
9.7
7.3–12.1
9.0
6.4–11.6
CEA (ng/mL)
≦5 (n = 64)
95% CI
.244
–
.206
–
.358
–
Wu et al. BMC Cancer
(2020) 20:422
Page 10 of 12
Table 3 Univariate and multivariate analysis of prognostic factors in patients with (OS) (Continued)
Parameters
Median (months)
95% CI
7.7
5.9–9.5
None (n = 88)
8.4
6.2–10.5
2.041
Internal drainage (n = 8)
22.7
2.1–43.3
1
PTCD (n = 19)
7.5
5.2–9.7
Both (n = 3)
4.5
0.0–10.5
No (n = 8)
10.1
7.5–12.6
Yes (n = 100)
8.1
6.2–10.0
> 5 (n = 54)
Biliary drainage
P
value
Hazard ratio
95% CI
P
value
.045
0.708–5.883
.187
1.559
0.500–4.861
.444
6.024
1.253–28.969
.025
0.367–1.263
.223
0.996–2.944
.052
1.012–5.838
.047
Tumor involvement
Primary
Regional LAP
No (n = 42)
11.7
6.2–17.3
Yes (n = 76)
7.7
6.3–9.1
No (n = 95)
10.0
8.1–11.9
Yes (n = 23)
6.3
3.3–9.2
Lung
.612
–
.265
–
.009
Bone
No (n = 105)
8.9
6.8–11.1
Yes (n = 13)
5.1
3.7–6.5
No (n = 69)
9.0
7.2–10.8
Yes (n = 49)
7.7
4.6–10.7
Liver
Peritoneum
1
0.681
.330
–
.246
–
.032
No (n = 96)
8.9
6.2–11.7
1
Yes (n = 22)
5.9
0.3–11.5
1.712
No (n = 102)
8.9
6.7–11.2
Yes (n = 16)
6.3
3.0–9.6
Distant LAP
.408
Tumor Response
–
<.0001
CR/RR (n = 15)
21.9
11.6–32.2
1
SD (n = 41)
12.2
10.7–13.7
2.430
PD (n = 48)
6.1
4.3–8.0
10.994
4.397–27.489
<.0001
N/A (n = 14)
1.3
0.8–1.9
109.903
33.541–360.113
<.0001
CI Confidence interval, CR Complete response, PR Partial response, SD Stable disease, PD Progressive disease, N/A Not assessed, ALP Alkaline phosphatase, ALT
Alanine aminotransferase, NLR Neutrophil to lymphocyte ratio, MLR Monocyte to lymphocyte ratio, PLR Platelet to lymphocyte ratio, LAP Lymphadenopathy, PTCD
Percutaneous transhepatic cholangiography drainage, ICCA Intrahepatic cholangiocarcinoma, ECCA Extrahepatic cholangiocarcinoma, GB Gallbladder
neutrophil count/(white blood cell count/absolute neutrophil count). It had a prognostic value similar to NLR
[25]. High dNLR was associated with shorter PFS and
OS in the retrospective analysis in a cohort from the
ABC-02 and the BT-22 studies [26].
All of these studies merely found the possible prognostic factors for OS, but none of them reported the prognostic factors for PFS. The correlation of tumor
responses with survival has been seldom evaluated in
previous studies of advanced BTC, which were the most
important prognostic factors in the current study. Takahara et al. [27] and Neuzillet et al. [28] found that PD
for first-line chemotherapy was associated with residual
OS after first-line chemotherapy in patients undergoing
a second-line chemotherapy. It should be acknowledged
that tumor response cannot be an a priori criterium to
predict survivals, so that its usefulness is limited in the
first-line setting.
Wu et al. BMC Cancer
(2020) 20:422
Performance status was the most common independent prognostic factor in the previous studies. In the
present study, poor ECOG performance score (score > 1)
was associated with shorter OS (3.2 vs. 9.0 months, p =
0.006) in the univariate analysis but not in the multivariate analysis (p = 0.798, HR: 1.089). This finding may have
resulted probably from the interaction with other confounding variables and low proportion of patients with
ECOG performance status score > 1 (13.6%).
In contrast to the previous reports, we identified pretreatment NLR > 7.45, obstructive jaundice requiring
both PTCD and internal stenting, and no clinical response as the unfavourable factors. Chronic inflammation was reported to play an important role in the
development and progression of BTC. NLR or dNLR are
inexpensive markers reflecting the host inflammation
and were validated in the current and the previous studies [22, 26, 29].
Biliary drainage requiring both PTCD and internal
stenting was the only independent prognostic factor for
both PFS and OS. In other words, PTCD or stenting
alone did not influence the survival outcomes if adequate drainage was achieved with acceptable bilirubin
levels. Patients requiring both PTCD and internal drainage might have more complicated diseases than other
patients with BTC. Moreover, repeated biliary tract infection would compromise and influence the efficacy of
the chemotherapy [15]. This should be interpreted cautiously since only 3 patients out of 118 were subject to
both procedures, therefore, the finding appears less
meaningful in only a limited minority of patients.
We also analysed the association between disease involvement and clinical outcomes. A specific metastatic
organ involvement that is prognostic is still undemonstrated in most of the existing literature. In the univariate analysis, metastases to lung or liver were significant
prognostic factors for PFS and metastases to lung or
peritoneum were significant prognostic factors for OS.
The trends for significance were retained on multivariate
analysis by lung and peritoneum metastatic involvement
in negatively predicting PFS and OS, respectively. Other
than lung involvement was previously described as
impacting on OS (liver metastasis in first-line [19] and
peritoneal involvement in second-line [28]) but lung metastasis was firstly described in current study. The
tumour extension and involvement in advanced BTC
reflected the tumour heterogeneity, which might influence the efficacy of cytotoxic chemotherapy.
The present retrospective analysis has some limitations. The retrospective nature of a study always involves
biases. The present study was conducted not to investigate the efficacy of the chemotherapy, but to identify the
possible prognostic and predictive factors in the realworld practice and to adjust the confounding factors by
Page 11 of 12
the multivariate analysis to avoid possible biases. Not all
the data were available for all the patients in the current
study for comprehensive analysis due to the retrospective nature of the study. Of note that most of the variables evaluated in current study were present for either
all or all-but-one patients, with only albumin being
present in less than 110 patients. We did not include
some factors such as LDH and CRP reported by the
previous studies. These factors were not reliable when
patients experienced biliary tract infection, which happened commonly in the present study. Furthermore,
these patients were treated in a high-volume tertiarycare single institute, which could not fully capture realworld practice in small, peripheral clinics. However, the
homogeneity of standard treatment in such a single cancer center could attenuate the weight of confounding
factors, which might explain the lack of significance of
ECOG performance status.
Conclusion
We identified three important prognostic factors, namely
tumor response, NLR, and biliary drainage for both PFS
and OS. MLR was the only significant predictive factor
for the tumor response. These findings could provide
the physicians with more information to justify the clinical outcomes in patients with advanced BTC in realworld practice.
Abbreviations
ALP: Alanine aminotransferase, creatinine; BTCs: Biliary tract cancers; CA19–
9: Carbohydrate antigen 19–9; CEA: Carcinoembryonic antigen; CR: Complete
response; iCCA: intrahepatic cholangiocarcinoma; ECOG: Eastern Cooperative
Oncology Group; MLR: Monocyte to lymphocyte ratio; N/A: Not assessed;
NLR: Neutrophil to lymphocyte ratio; OS: Overall survival; PD: Partial response;
PFS: Progression-free survival; PTCD: Percutaneous transhepatic
cholangiography drainage; PD: Progressive disease; SD: Stable disease
Acknowledgements
Not Applicable.
Authors’ contributions
C-E W wrote the manuscript with support from W-C C, C-H H, J. W-C C, C-Y
L. C-N Y and J-S C designed the study, C-E W performed the statistical analysis. C-N Y and J-S C supervised the project. All authors collected and interpreted the data, reviewed the manuscript. All authors read and approved the
final manuscript.
Funding
This work was supported by grants from Linkou Chang-Gung Memorial Hospital (CRRPG3F0031 ~ 3, CMRPG3I023, CMRPG3I0241, CORPG3J0251,
NMRPG3F6021 ~ 2 and NMRPG3H6211 ~ 2 to C-N.Y. and CMRPG3I0451,
CMRPG3J0971, and NMRPG3J0011 to C-E.W.), the Ministry of Science and
Technology (105–2314-B-182A-041-MY2 and 107–2314-B-182A-134-MY3 to CN.Y., 108–2314-B-182A-007 to C-E.W.). The funders have no role in the study
design, data collection, analysis, interpretation, or writing of the manuscript.
Availability of data and materials
The datasets generated AND analysed during the current study are not
publicly available due to IRB regulation but are available from the
corresponding author on reasonable request.
Wu et al. BMC Cancer
(2020) 20:422
Ethics approval and consent to participate
This study was approved by the institutional review board (IRB) of Chang
Gung Medical Foundation (201901322B0). The consent to participate was
not required because of retrospective entity of this study which was
approved by IRB of Chang Gung Medical Foundation.
Consent for publication
Not applicable.
Page 12 of 12
15.
16.
17.
Competing interests
The authors declared that they have no competing interests.
18.
Author details
1
Division of Haematology-Oncology, Department of Internal Medicine,
Chang Gung Memorial Hospital at Linkou, Chang Gung University College of
Medicine, 5, Fu-Hsing Street, Kwei-Shan, Taoyuan, Taiwan. 2Department of
Gastroenterology, Chang Gung Memorial Hospital at Linkou, Chang Gung
University College of Medicine, 5, Fu-Hsing Street, Taoyuan, Kwei-Shan,
Taiwan. 3Department of General Surgery, Chang Gung Memorial Hospital at
Linkou, Chang Gung University College of Medicine, 5, Fu-Hsing Street,
Kwei-Shan, Taoyuan, Taiwan.
19.
20.
Received: 5 November 2019 Accepted: 30 April 2020
21.
References
1. Ustundag Y, Bayraktar Y. Cholangiocarcinoma: a compact review of the
literature. World J Gastroentero. 2008;14(42):6458–66.
2. Khan SA, Thomas HC, Davidson BR, Taylor-Robinson SD.
Cholangiocarcinoma. Lancet. 2005;366(9493):1303–14.
3. Patel T. Increasing incidence and mortality of primary intrahepatic
cholangiocarcinoma in the United States. Hepatology. 2001;33(6):1353–7.
4. Shaib Y, El-Serag HB. The epidemiology of cholangiocarcinoma. Semin Liver
Dis. 2004;24(2):115–25.
5. Valle J, Wasan H, Palmer DH, Cunningham D, Anthoney A, Maraveyas A,
Madhusudan S, Iveson T, Hughes S, Pereira SP, et al. Cisplatin plus
gemcitabine versus gemcitabine for biliary tract cancer. N Engl J Med. 2010;
362(14):1273–81.
6. Hezel AF, Deshpande V, Zhu AX. Genetics of biliary tract cancers and
emerging targeted therapies. J Clin Oncol. 2010;28(21):3531–40.
7. Zhu AX, Hezel AF. Development of molecularly targeted therapies in biliary
tract cancers: reassessing the challenges and opportunities. Hepatology.
2011;53(2):695–704.
8. Sahu S, Sun W. Targeted therapy in biliary tract cancers-current limitations
and potentials in the future. J Gastrointest Oncol. 2017;8(2):324–36.
9. Lee J, Park SH, Chang HM, Kim JS, Choi HJ, Lee MA, Jang JS, Jeung HC,
Kang JH, Lee HW, et al. Gemcitabine and oxaliplatin with or without
erlotinib in advanced biliary-tract cancer: a multicentre, open-label,
randomised, phase 3 study. Lancet Oncol. 2012;13(2):181–8.
10. Malka D, Cervera P, Foulon S, Trarbach T, de la Fouchardiere C, Boucher E,
Fartoux L, Faivre S, Blanc JF, Viret F, et al. Gemcitabine and oxaliplatin with
or without cetuximab in advanced biliary-tract cancer (BINGO): a
randomised, open-label, non-comparative phase 2 trial. Lancet Oncol. 2014;
15(8):819–28.
11. Valle JW, Wasan H, Lopes A, Backen AC, Palmer DH, Morris K, Duggan M,
Cunningham D, Anthoney DA, Corrie P, et al. Cediranib or placebo in
combination with cisplatin and gemcitabine chemotherapy for patients
with advanced biliary tract cancer (ABC-03): a randomised phase 2 trial.
Lancet Oncol. 2015;16(8):967–78.
12. Chen JS, Hsu C, Chiang NJ, Tsai CS, Tsou HH, Huang SF, Bai LY, Chang IC,
Shiah HS, Ho CL, et al. A KRAS mutation status-stratified randomized phase
II trial of gemcitabine and oxaliplatin alone or in combination with
cetuximab in advanced biliary tract cancer. Ann Oncol. 2015;26(5):943–9.
13. Leone F, Marino D, Cereda S, Filippi R, Belli C, Spadi R, Nasti G, Montano M,
Amatu A, Aprile G, et al. Panitumumab in combination with gemcitabine
and oxaliplatin does not prolong survival in wild-type KRAS advanced biliary
tract cancer: a randomized phase 2 trial (Vecti-BIL study). Cancer. 2016;
122(4):574–81.
14. Filippi R, Lombardi P, Quara V, Fenocchio E, Aimar G, Milanesio M, Leone F,
Aglietta M. Pharmacotherapeutic options for biliary tract cancer: current
22.
23.
24.
25.
26.
27.
28.
29.
standard of care and new perspectives. Expert Opin Pharmacother. 2019;
20(17):2121–37.
Wu CE, Hsu HC, Shen WC, Lin YC, Wang HM, Chang JW, Chen JS.
Chemotherapy with gemcitabine plus cisplatin in patients with advanced
biliary tract carcinoma at Chang gung memorial hospital: a retrospective
analysis. Chang Gung Med J. 2012;35(5):420–7.
Hothorn T, Hornik K, Zeileis A. Unbiased recursive partitioning: a conditional
inference framework. J Comput Graph Stat. 2006;15(3):651–74.
Okusaka T, Nakachi K, Fukutomi A, Mizuno N, Ohkawa S, Funakoshi A,
Nagino M, Kondo S, Nagaoka S, Funai J, et al. Gemcitabine alone or in
combination with cisplatin in patients with biliary tract cancer: a
comparative multicentre study in Japan. Br J Cancer. 2010;103(4):469–74.
Song BG, Park JK, Kim HS, Kim K, Park JK, Lee KH, Lee KT, Lee JK. Prognosis
and prognostic factors in patients with advanced biliary tract cancer
depending on its anatomical location. Scand J Gastroenterol. 2019;54(6):
740–5.
Park I, Lee JL, Ryu MH, Kim TW, Sook Lee S, Hyun Park D, Soo Lee S, Wan
Seo D, Koo Lee S, Kim MH. Prognostic factors and predictive model in
patients with advanced biliary tract adenocarcinoma receiving first-line
palliative chemotherapy. Cancer. 2009;115(18):4148–55.
Peixoto RD, Renouf D, Lim H. A population based analysis of prognostic
factors in advanced biliary tract cancer. J Gastrointest Oncol. 2014;5(6):428–
32.
Ishimoto U, Kondo S, Ohba A, Sasaki M, Sakamoto Y, Morizane C, Ueno H,
Okusaka T. Prognostic factors for survival in patients with advanced
intrahepatic Cholangiocarcinoma treated with gemcitabine plus Cisplatin as
first-line treatment. Oncology. 2018;94(2):72–8.
Suzuki Y, Kan M, Kimura G, Umemoto K, Watanabe K, Sasaki M, Takahashi H,
Hashimoto Y, Imaoka H, Ohno I, et al. Predictive factors of the treatment
outcome in patients with advanced biliary tract cancer receiving
gemcitabine plus cisplatin as first-line chemotherapy. J Gastroenterol. 2019;
54(3):281–90.
Salati M, Filippi R, Vivaldi C, Caputo F, Leone F, Salani F, Cerma K, Aglietta M,
Fornaro L, Sperti E, et al. The prognostic nutritional index predicts survival
and response to first-line chemotherapy in advanced biliary cancer. Liver
Int. 2019;40(3):704–11.
Bridgewater J, Lopes A, Palmer D, Cunningham D, Anthoney A, Maraveyas
A, Madhusudan S, Iveson T, Valle J, Wasan H. Quality of life, long-term
survivors and long-term outcome from the ABC-02 study. Br J Cancer. 2016;
114(9):965–71.
Proctor MJ, McMillan DC, Morrison DS, Fletcher CD, Horgan PG, Clarke SJ. A
derived neutrophil to lymphocyte ratio predicts survival in patients with
cancer. Br J Cancer. 2012;107(4):695–9.
Grenader T, Nash S, Plotkin Y, Furuse J, Mizuno N, Okusaka T, Wasan H, Valle
J, Bridgewater J. Derived neutrophil lymphocyte ratio may predict benefit
from cisplatin in the advanced biliary cancer: the ABC-02 and BT-22 studies.
Ann Oncol. 2015;26(9):1910–6.
Takahara N, Nakai Y, Isayama H, Sasaki T, Saito K, Oyama H, Kanai S, Suzuki T,
Sato T, Hakuta R, et al. Second-line chemotherapy in patients with
advanced or recurrent biliary tract cancer: a single center, retrospective
analysis of 294 cases. Investig New Drugs. 2018;36(6):1093–102.
Neuzillet C, Casadei Gardini A, Brieau B, Vivaldi C, Smolenschi C, Brandi G,
Tougeron D, Filippi R, Vienot A, Silvestris N, et al. Prediction of survival with
second-line therapy in biliary tract cancer: actualisation of the AGEO CT2BIL
cohort and European multicentre validations. Eur J Cancer. 2019;111:94–106.
McNamara MG, Templeton AJ, Maganti M, Walter T, Horgan AM, McKeever
L, Min T, Amir E, Knox JJ. Neutrophil/lymphocyte ratio as a prognostic factor
in biliary tract cancer. Eur J Cancer. 2014;50(9):1581–9.
Publisher’s Note
Springer Nature remains neutral with regard to jurisdictional claims in
published maps and institutional affiliations.