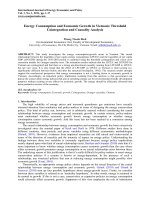
Electricity consumption and GDP nexus in Bangladesh: A time series investigation
Bạn đang xem bản rút gọn của tài liệu. Xem và tải ngay bản đầy đủ của tài liệu tại đây (330.96 KB, 14 trang )
The current issue and full text archive of this journal is available on Emerald Insight at:
www.emeraldinsight.com/2515-964X.htm
Electricity consumption and GDP
nexus in Bangladesh: a time
series investigation
Sima Rani Dey and Mohammed Tareque
Electricity
consumption
and GDP nexus
in Bangladesh
35
Bangladesh Institute of Governance and Management, Dhaka, Bangladesh
Abstract
Purpose – The purpose of this paper is to assess the empirical cointegration, long-run and short-run
dynamics as well as causal relationship between electricity consumption and real GDP in Bangladesh for the
period of 1971‒2014.
Design/methodology/approach – Autoregressive Distributed lag (ARDL) “Bound Test” approach is
employed for the investigation in this study.
Findings – Both short-run and long-run coefficients are providing strong evidence of having positive
significant association between electricity consumption and GDP. Our long-run results remain robust to
different measurements and estimators as well. The study reveals the unidirectional causal flow running from
per capita electricity consumption to per capita real GDP in the short run. The study result also yields strong
evidence of bidirectional causal relationship between per capita electricity consumption and per capita real
GDP in the long run with feedback. It is suggested that both electricity generation and conservation policy
will be effective for Bangladesh economy.
Originality/value – In prior studies, lack of causality between electricity consumption and GDP is due to the
omitted variables. Combined effects of public spending and trade openness on GDP and electricity
consumption are also considerable.
Keywords Electricity consumption, GDP, ARDL bounds test, Causality test
Paper type Research paper
Received 7 April 2019
Revised 28 April 2019
29 April 2019
Accepted 8 July 2019
1. Introduction
Bangladesh has ensured its stable economic growth in the last decade, and it also has an
aspiration to become a high-income country by 2,041. So, the development of energy and
power infrastructure is inevitable to realize the long-term economic development. In the
context of Bangladesh, the power sector is one of the largest sectors that consume primary
energy. The relationship of GDP and electricity consumption has been immensely debated
in the studied literature, yet their causal relationship directions are still unsolved. In the last
decades, numerous researchers have attempted to address this issue and tried to investigate
the association between electricity consumption and economic growth using both singlecountry and cross-country data. Plenty of literature exists on the causal relationship
between electricity consumption and economic growth across the developing economies.
Different countries, methodologies, time periods, even different proxy variables for energy
consumption and income have been employed in different studies.
Causality bearing between power utilization and economic development has huge
ramifications on political and economical strategy perspectives. The heading of causality
can be abridged into four classes: growth hypothesis; conservation hypothesis; feedback
hypothesis; and neutrality hypothesis. Single-direction causality from electricity
© Sima Rani Dey and Mohammed Tareque. Published in Journal of Asian Business and Economic
Studies. Published by Emerald Publishing Limited. This article is published under the Creative
Commons Attribution (CC BY 4.0) licence. Anyone may reproduce, distribute, translate and create
derivative works of this article ( for both commercial and non-commercial purposes), subject to full
attribution to the original publication and authors. The full terms of this licence may be seen at http://
creativecommons.org/licences/by/4.0/legalcode
Journal of Asian Business and
Economic Studies
Vol. 27 No. 1, 2020
pp. 35-48
Emerald Publishing Limited
2515-964X
DOI 10.1108/JABES-04-2019-0029
JABES
27,1
36
consumption to financial development is a typical experimental finding for some Asian
economies (Ho and Siu, 2007).
Studies those attempt to evaluate the connection between power utilization and GDP in
setting of Bangladesh are sparse. Mozumder and Marathe (2007) led short-run Granger
causality test for the time period of 1971‒1999, whereas the examination by Ahamad and
Islam (2011) assessed their short-run, long-run and joint causal relationship for the time
period of 1971‒2008 and Alam et al. (2012) examined the dynamic causality for the time
period of 1972‒2006. Most likely, above investigations are huge on their grounds, yet hardly
any study, to date, has been led to survey the long-run relationship between power
utilization and GDP with any control variable (considering the combined effects of public
spending and trade openness on GDP and electricity consumption) along with their
short-run, long- run and joint causal relationship. The sensitivity of our long-run estimates
is verified by employing three alternative estimators.
Consequently, the paper examines the long-run association between electricity
consumption and GDP in Bangladesh using ARDL bounds test approach. Again, the
study investigates the presence and direction of causal relationship to take effective policy
decision regarding electricity consumption. A vector error-correction model (VECM) based
Granger causality test was employed to analyze the relationship; the F- and t-tests are
carried out to gauge the joint significance levels of causality between the electricity
consumption and GDP.
The rest of this paper is structured as follows: beginning with the introduction, Section 2
examines about the recent electricity scenario of Bangladesh and Section 3 depicts an
outline of the literature review. Section 4 focuses on data and estimation procedures of the
investigation. Section 5 examines the experimental outcomes; Section 6 reaches the inference
of the study.
2. Recent electricity scenario of Bangladesh
Economic growth of a demand-driven economy like Bangladesh has always been linked
with energy (mainly electricity) consumption. Unfortunately, the infrastructure of power
sector is not sufficient to meet growing demands and is managed inefficiently. Moreover, the
power demand of Bangladesh is increasing rapidly along with the increase of the per capita
GDP over the last decades (Table II). Installed power generation capacity was 16046 MW
(including captive power) as on December 2017 and 77 percent population had access to the
electricity in Bangladesh (Table I).
To sustain the further economic growth, heavy dependence on labor-intensive industrial
sector like readymade garment (RMG) is not sufficient and it is expected that it will shift to
energy-intensive industries. Subsequently, energy utilization in the industrial sector is
required to increment quickly. To manage the future fast development of vitality utilization
in Bangladesh, government has detailed couple of compelling strategies. Without a doubt,
for the seventh Five Year Plan (Power System Master Plan (PSMP) 2016), the objective by
Time periods
Table I.
Electric power
utilization and GDP
per capita, 1971–2014
Electric power utilization (kWh per capita)
GDP per capita (constant 2010 US$)
1971–1980
16.67961
342.8396
1981–1990
35.45743
380.0094
1991–2000
76.0367
453.2003
2001–2010
173.8429
625.8588
2011–2014
283.9119
859.6671
Note: Average growth rate is a 10-year average except the last row, which is a four-year average
2020 is set as “power inclusion to be expanded to 96 percent with continuous supply to
ventures” (Table II).
The installed capacity and maximum generation of electricity are increasing over the last
few years, but the state is struggling to meet the demanded electricity. Currently, many of
power plants in Bangladesh cannot generate electricity as specified in terms of power for
each unit. So, hydro power generation studies have become an urgent issue through the
government’s renewable energy promotion policy. Hopefully, the new Power System Master
Plan study will cover previous challenges and will provide feasible proposal and action
plans for implementation as well (Figure 1).
So, the development of energy and power infrastructure, therefore, pursues not only
the quantity but also the quality to realize the long-term economic development. Therefore,
power proficiency may end up being the most essential alternative to deal with the
tremendous neglected power request in the future relying upon the causality directions.
Hence, the direction of relationship should be examined cautiously to determine right policy
for accelerating economic growth and development.
Electricity
consumption
and GDP nexus
in Bangladesh
37
3. Literature review
The association of energy consumption with economic growth is a special matter of interest
and a series of literature on energy consumption and economic growth is available. The
relationship between energy consumption and economic growth was first studied by Kraft
and Kraft (1978), then the research works had been extended from energy consumption to
electricity consumption. A short synopsis of those particular written works on electricity
consumption and economic development point of view has been introduced in Table III.
The causal linkages’ nature and directions of the above-mentioned literature vary
across countries due to econometric techniques and variables used on different time series
in their studies. Causality tests give us the insights about whether the information of past
electricity movements improves conjectures of developments in economic growth and the
other way around.
Year
Installed capacity (MW)
Maximum demand (MW)
Maximum peak generation (MW)
1995–1999
3,084
2,439
2,151
2000–2004
4,262
3,682
3,187
2005–2009
5,293
5,207
3,903
2010–2014
8,274
7,671
5,870
2015–2017
12,485
11,444
8,777
Note: Average growth rate is a five-year average except the last row, which is a three-year average
Table II.
Electric power
consumption
scenario, 1995–2017
60,000
Power Demand (MW)
50,000
40,000
30,000
20,000
10,000
0
2015
2020
Source: JICA Survey Team
2025
2030
2035
2040
Figure 1.
Forecasted power
demand up to 2041
JABES
27,1
38
No. Authors
1 Altinay and
Karagol (2005)
2 Aqeel and Butt
(2001)
3 Shiu and Lam
(2004)
4 Narayan and
Singh (2007)
5 Yuan et al. (2007)
6 Chandran et al.
(2010)
7 Odhiambo (2009)
Countries
Turkey
Pakistan
China
Study
period
Used variables
1950–2000 Logarithm of electricity consumption and
real GDP
1955–1996 Logarithm of per capita real GDP, energy
consumption and employment
1971–2000 Electricity consumption and real GDP
EC→Y
EC→Y
EC→Y
Fiji Islands 1971–2002 Logarithm of GDP, electricity consumption EC→Y
and labor force
China
1978–2004 Electricity consumption and real GDP
EC→Y
Malaysia
1971–2003 Electricity consumption, price and real GDP EC→Y
1971–2006 Logarithm of per capita electricity
consumption, energy consumption and real
GDP
8 Ho and Siu (2007) Hong Kong 1966–2002 Electricity consumption and real GDP
9 Acaravci (2010)
Turkey
1968–2005 Per capita electricity consumption and real
GDP
10 Iyke (2015)
Nigeria
1971–2011 Per capita electricity consumption, inflation
and real GDP
11 Morimoto and
Sri Lanka 1960–1998 Electricity consumption and real GDP
Hope (2004)
12 Ghosh (2002)
India
1951–1997 Logarithm of per capita electricity
consumption and real GDP
13 Jamil and Ahmad Pakistan
1960–2008 Electricity consumption, electricity price
(2010)
and real GDP
14 Ciarreta and
Spain
1971–2005 Logarithm of electricity consumption and
Zarraga (2010)
real GDP
15 Mozumder and
Bangladesh 1971–1999 Per capita electricity consumption and real
Marathe (2007)
GDP
16 Narayan and
Australia
1966–1999 Real income, electricity consumption and
Smyth (2005)
employment
17 Tang (2008)
Malaysia
1972:Q1– Logarithm of per capita Electricity
2003:Q4
consumption and real GNP
18 Oh and Lee (2004) Korea
1970–1999 Logarithm of Real GDP, capital, labor and
divisia energy
19 Alam et al. (2012) Bangladesh 1972–2006 Per capita electricity consumption, energy
consumption, CO2 emissions and real GNP
19 Polemis and
Greece
1970–2011 Residential electricity consumption,
Dagoumas (2013)
electricity price, GDP, employment, light
fuel price, heating and cooling degree days
20 Tang et al. (2013) Portugal
1974–2009 Electricity consumption per capita, real GDP
per capita, relative price, trade openness,
foreign direct investment and financial
development
21 Hamdi et al. (2014) Bahrain
1980:Q1– Logarithm of per capita electricity
2010;Q4
consumption and real GDP, foreign direct
investment and capital
22 Yoo (2005)
Korea
1970–2002 Logarithm of electricity consumption and
real GDP
24 Ahamad and
Bangladesh 1971–2008 Per capita electricity consumption and real
Islam (2011)
GDP
25 Belloumi (2009)
Tunisia
1971–2004 Per capita energy consumption and real GDP
Table III.
Summary of selected
observational studies
Causality
directions
Tanzania
EC→Y
EC→Y
EC→Y
EC→Y
EC→Y
Y→EC
Y→EC
Y→EC
Y→EC
Y→EC
EC↔Y
EC↔Y(LR);
EC→Y(SR)
EC↔Y(LR);
EC↮Y(SR)
EC↔Y
EC↔Y
EC↔Y
EC↔Y
EC↔Y
EC↔YLR);
EC→Y(SR)
26 Stern (1993)
USA
1947–1990 Logarithm of GDP, capital, labor and energy EC↮Y
Notes: EC and Y represent electricity (energy) consumption and GDP, respectively. →,↔ and ↮ represent
unidirectional, bi-directional and neutral causality, respectively
Source: Author compilation
We can categorize our selected research works into four gatherings. First, an extensive
number of studies found unidirectional causality running from electricity (or energy)
consumption to GDP. These include Altinay and Karagol (2005) and Acaravci (2010) for
Turkey, Aqeel and Butt (2001) for Pakistan, Shiu and Lam (2004) and Yuan et al. (2007) for
China, Narayan and Singh (2007) for Fiji Islands, Chandran et al. (2010) for Malaysia,
Odhiambo (2009) for Tanzania, Ho and Siu (2007) for Hong Kong, Iyke (2015) for Nigeria and
Morimoto and Hope (2004) for Sri Lanka.
The investigations that found unidirectional causality running from GDP to electricity
(or energy) consumption comprise the second group. These include Ghosh (2002) for India,
Jamil and Ahmad (2010) for Pakistan, Ciarreta and Zarraga (2010) for Spain, Mozumder and
Marathe (2007) for Bangladesh and Narayan and Smyth (2005) for Australia.
The studies that found bidirectional causality comprise the third group. These include
Tang (2008) for Malaysia, Oh and Lee (2004) and Yoo (2005) for Korea, Polemis and
Dagoumas (2013) for Greece, Tang et al. (2013) for Portugal, Hamdi et al. (2014) for Bahrain,
Jumbe (2004) for Malawi, Ahamad and Islam (2011) for Bangladesh and Belloumi (2009) for
Tunisia. The fourth group comprises studies that found no causal linkages between
electricity consumption and GDP, such as Stern (1993) for USA.
The summary of above writing audit reflects on the causal relationship between electricity
(or energy) consumption and GDP, but the existing research works fail to provide clear
evidence on the direction of causality between them. The inconsistency of the causality
findings may attribute to the different data span and source, alternative econometric
techniques, different countries’ characteristics and omitted relevant variables (Chen et al.,
2007). The causal relationship between energy consumption and economic growth has strong
implications from theoretical, practical and policy points of view (Fuinhas and Marques, 2012).
Electricity
consumption
and GDP nexus
in Bangladesh
39
4. Data and estimation techniques
Following Mazumder and Marthe (2007) and Ahamad and Islam (2011), we used both
electricity consumption and GDP data for Bangladesh in per capita form. Clearly, besides
per capita electricity consumption, different factors could have extraordinary effect on
economic growth. Thus, exclusion of those factors could lead to inclination of the estimation
results and causality direction of the factors. In this point of view, we included government
spending (GE) but in per capita form and trade openness as controlled variable to avoid
omitted variable bias and simultaneity bias in our regression following Akinlo (2008) and
Tang et al. (2013). Table IV provides the descriptive statistics of the studied variables.
Annual data on PCEC and PCGDP are covering the time period of 1971‒2014 and
collected from the World Bank[1]. All data are in real form. The historical data of per capita
GDP and per capita electricity consumption for Bangladesh are portrayed in Figure 2.
The functional form of the model to satisfy the prime objective of the study is as follows:
PCGDP ¼ f ðPCEC; PCGE; TOÞ:
Variable
Definition
PCEC
PCGDP
PCGE
Per capita electricity consumption (in kWh)
Per capita GDP (in constant 2010 US$)
Per capita general government final consumption
expenditure (in constant 2010 US$)
Trade openness
TO
Observations
Mean
94.45
487.67
22.66
0.2135
SD
87.28
164.77
10.22
0.1378
44
Min.
10.50
317.70
3.999
0.0844
Max.
310.39
922.16
46.09
0.4797
Table IV.
Descriptive statistics
of studied variables
JABES
27,1
1,000
GDP per capita (constant 2010 US$)
Electric power consumption (kWh per capita)
800
600
40
400
Figure 2.
Trend of per capita
electricity
consumption and per
capita GNI in
Bangladesh
200
0
1971
1976
1981
1986
1991
1996
2001
2006
2011
The econometric form of the above model relating to electricity consumption and GDP, once
stationarity or cointegration is verified:
PCGDP t ¼ aþb1 PCEC t þb2 PCGE t þb3 TOt þet ;
(1)
where all the variables are discussed above, α is the intercept, β1−β3 are the coefficients of
exogenous variables and ε is the error term.
A multivariate framework is used in this paper to examine the linkage between
electricity consumption and GDP. To analyze the long-run relationship between the studied
variables, the study employed autoregressive distributed lag (ARDL) “Bound Test”
approach introduced by Pesaran and Shin (1999) and Pesaran et al. (2001)[2]. To correct
residual serial correlation and problem of endogenous variables, appropriate modification of
the orders of ARDL model is sufficient (Pesaran and Shin, 1999).
Although pre-testing of unit root is not necessary to proceed with ARDL bounds testing
approach as it can test the cointegration existence between a set of variables of I(0) or I(1) or
blender of both, there is a risk of invalid estimation if any variable comes out as integrated of
order two or I(2). It is, therefore, essential to test the stationarity properties of each variable before
proceeding to the econometric analyses. The augmented Dickey‒Fuller (ADF) and the Phillip‒
Perron unit root testing methods will be used for test unit root of the variables under study.
In ARDL conintegration technique, the existence of cointegration or possession of
long-run relationship among the variables is primarily determined. At that point, the
short- and long-run parameters extraction is done in the second step. The bound test
approach is mainly based on an estimate of unrestricted error-correction model (UECM) by
using ordinary least squares (OLS) estimation procedure. ARDL is easy to clarify, gives
unprejudiced estimation of the long-run relationship and dynamics as well as the issues of
serial correlation and endogeneity are taken care of.
The presence of causality and its direction will be assured by the existence of
cointegration of the variables. The bound testing approach to cointegration involves
investigating the presence of a long-run equilibrium relationship using the error-correction
model (UECM) frameworks:
DPCGDP ¼ a10 þ
k
X
i¼1
a1i DPCGDP þ
l
X
i¼0
a2i DPCEC þ
m
X
a3i DPCGE þ
i¼0
þa5 PCGDP tÀ1 þa5 PCEC tÀ1 þ a5 PCGE tÀ1 þa5 TOtÀ1 þe1t
n
X
a4i DTO;
i¼0
(2)
DPCEC ¼ a20 þ
k
X
a1i DPCGDP þ
i¼0
l
X
a2i DPCEC þ
i¼1
m
X
a3i DPCGE þ
i¼0
n
X
a4i DTO;
i¼0
þa5 PCGDP tÀ1 þ a5 PCEC tÀ1 þa5 PCGE tÀ1 þa5 TOtÀ1 þe2t
DPCGE ¼ a30 þ
k
X
a1i DPCGDP þ
i¼0
l
X
a2i DPCEC þ
i¼0
m
X
a3i DPCGE þ
i¼1
(3)
n
X
DTO ¼ a40 þ
k
X
a1i DPCGDP þ
i¼0
l
X
a2i DPCEC þ
i¼0
m
X
a3i DPCGE þ
i¼0
þa5 PCGDP tÀ1 þa5 PCEC tÀ1 þa5 PCGE tÀ1 þa5 TOtÀ1 þe4t
41
a4i DTO;
i¼0
þa5 PCGDP tÀ1 þa5 PCEC tÀ1 þa5 PCGE tÀ1 þa5 TOtÀ1 þe3t
n
X
(4)
a4i DTO;
i¼1
(5)
where Δ is the difference operator; the existence of long-run equilibrium relationship is
tested by limiting the lagged level variables PCGDPt−1, PCECt−1, PCGEt−1 and TOt−1 in
Equations (2)–(5). Decisions of bound test are made on the basis of F-statistic value that
helps to draw conclusion about the long-run relationship of the variables.
The causal relationship among the studied series exists if the presence of cointegration is
confirmed, but it does not demonstrate the direction of the causal relationship. The VECM
model derived from the long-run cointegrating relationship can be utilized to catch the
dynamic Granger causality (Granger, 1988). Engle and Granger (1987) demonstrated that if
the series are cointegrated, the VECM model for the series can be written as follows:
k
X
DPCGDP ¼ a10 þ
a1i DPCGDP þ
i¼1
þ
m
X
a3i DPCGE þ
n
X
k
X
m
X
a1i DPCGDP þ
a3i DPCGE þ
i¼0
DPCGE ¼ a30 þ
i¼1
l
X
a2i DPCEC;
n
X
a4i DTOþd21 ECT tÀ1 þe6t
(7)
i¼0
k
X
m
X
(6)
i¼1
a1i DPCGDP þ
i¼0
þ
a4i DTOþd11 ECT tÀ1 þe5t
i¼0
i¼0
þ
a2i DPCEC;
i¼0
i¼0
DPCEC ¼ a20 þ
l
X
a3i DPCGE þ
l
X
a2i DPCEC;
i¼0
n
X
i¼0
a4i DTOþd31 ECT tÀ1 þe7t
Electricity
consumption
and GDP nexus
in Bangladesh
(8)
JABES
27,1
DTO ¼ a40 þ
k
X
a1i DPCGDP þ
i¼0
þ
m
X
a3i DPCGE þ
i¼0
42
l
X
a2i DPCEC;
i¼0
n
X
a4i DTOþd41 ECT tÀ1 þe8t
(9)
i¼1
where ECTt−1 represents the error-correction term (ECT) derived from the long-run cointegrating
relationship to capture long-run effects, and ε1t, ε2t are the serially uncorrelated error terms.
In Equations (6)–(9), changes in the dependent variable are caused not only by their
lags, but also by the previous period’s disequilibrium in level, ECTt−1. Given such a
specification, the presence of short- and long-run causality can be tested. The
error-correction model results indicate the speed of adjustment back to the long-run
equilibrium after short-run shocks.
The ECM coordinates the short-run coefficient with the long-run coefficient without losing
long-run data. Under ECM technique, the long-run causality is delineated by the negative and
significant value of the ECT coefficient δ and the short-run causality appears by the
noteworthy estimation of coefficients of other informative factors (Rahman and Mamun, 2016;
Shahbaz et al., 2013). Equation (6) can be considered. If the estimated coefficients on lagged
values of per capita electricity consumption (α2s) are factually noteworthy, then the implication
is that electricity consumption Granger causes per capita real GDP in the short run. However,
long-run causality can be found by testing the criticality of the assessed coefficient of ECTt−1.
5. Empirical results
In this section, we present the empirical results from various approaches. Table IV
demonstrates that all variables are non-stationary in their dimensions, yet they turned out to
be stationary after first differencing and the results are outlined underneath.
From the above estimates, it can be inferred that both ADF and PP (Table V ) test
results reveal that the variables are non-stationary at 5 percent level of significance, but
they became stationary at the first difference level. Thus, all the variables are integrated of
order one, that is I(1), and both possibilities with intercept as well as with intercept and
trend are considered.
Since our variables are integrated, so it needs to be found whether the variables are
cointegrated or not. To explore the long-run relationship between electricity consumption
and GDP, ARDL model to cointegration and error correction is employed.
The ARDL bound tests affirms the existence of long-run association between the factors
in Equations (2)–(5) and the outcomes are presented in Table VI. The computed F-statistic of
above equations exceeded the upper bounds at 1 percent level of significance except the
Variables
Table V.
Unit root tests
PCEC
PCGDP
PCGE
TO
ΔPCEC
ΔPCGDP
Δ PCGE
ΔTO
Augmented Dickey‒Fuller test
Intercept
Intercept and trend
6.7943 (1.000)
6.8645 (1.000)
3.5628 (1.000)
−0.9994 (0.745)
−1.8714 (0.342)
−1.9286 (0.316)
−5.6785 (0.000)
−5.4138 (0.000)
1.5231 (0.999)
1.0661 (0.999)
0.2469 (0.997)
−2.6061 (0.279)
−6.3111 (0.000)
−8.5691 (0.000)
−5.6688 (0.000)
−6.2424 (0.000)
Phillips‒Perron test
Intercept
Intercept and trend Order of integration
8.8005
7.5856
0.4495
−1.1302
−3.6226
−5.0928
−5.6785
−5.4900
(1.000)
(1.000)
(0.983)
(0.695)
(0.009)
(0.000)
(0.000)
(0.000)
2.4461
1.4502
−1.0411
−2.7575
−6.3111
−7.8121
−5.6688
−6.2429
(1.000)
(1.000)
(0.927)
(0.220)
(0.000)
(0.000)
(0.000)
(0.000)
I(1)
I(1)
I(1)
I(1)
second equation when per capita electricity consumption is the dependent variable. As per
the rule, the higher F-statistic value supports the non-acceptance of null hypothesis that
confirms the long-run relationship between the factors, which implies that the variables will
move together. So the cointegration results lead us to contend that electricity consumption
and GDP have a long-run affiliation.
The AIC lag length criterion statistic indicates that ARDL (3,1,3,1) model is the best lag
orders combination and the estimation results are reported in Table VII. The result showed
that a statistically significant association exists between electricity consumption and
economic growth. Intercept term also becomes significant at 5 percent level of significance
(Table VIII and Figures 3 and 4).
Both short-run and long-run coefficients are providing strong evidence of having
positive significant association between electricity consumption and GDP at 5 percent level
of significance. The value of ECT coefficient in GDP equation is –0.12 which indicates that
the alteration coefficient (speed of convergence) to reestablish the equilibrium in the long
run by around nine years.
To check the robustness of our long-run results, we employed three alternative estimators:
the Phillips and Hansen’s (1990) fully modified OLS (FMOLS) procedure, the Stock and
Watson’s (1993) dynamic OLS (DOLS) and the Park’s (1992) canonical cointegration
regression (CCR). Although the electricity consumption coefficients in three alternatives are
smaller than the ARDL coefficient estimate, but our findings of positive electricity
consumption‒economic growth nexus remain robust to all these three estimators (Table IX).
ARDL models
Dependent variable
Equation (6)
FPCGDP(PCGDP\PCEC, PCGC,TO)
Equation (7)
FPCEC(PCEC\PCGDP, PCGE,TO)
Equation (8)
FPCGE(PCGE\PCGDP, PCEC,TO)
Equation (9)
FT0(TO\PCGDP, PCGE, PCEC)
Lower bound critical value at 1 percent
Upper bound critical value at 1 percent
Variable
F-statistic
43
Decision
32.64
3.35
10.35
8.90
Dependent variable: D(PCGDP)
ARDL(3, 1, 3, 1) selected based on AIC
Coefficient
Electricity
consumption
and GDP nexus
in Bangladesh
Cointegration
No cointegration
Cointegration
Cointegration
Table VI.
Bound test results
3.65
4.66
Prob.
Constant
24.31690
0.2030
PCGDP(−1)
−0.120875*
0.0481
PCEC(−1)
0.367475***
0.0026
PCGE(−1)
0.770739***
0.0093
TO(−1)
22.76833
0.1267
D(PCGDP(−1))
−0.350540***
0.0087
D(PCGDP(−2))
−0.373907***
0.0000
D(PCEC)
0.029607
0.8231
D(PCGE)
1.131274*
0.0494
D(PCGE(−1))
−1.319006***
0.0009
D(PCGE(−2))
1.473489***
0.0003
D(TO)
−18.17714
0.4241
0.999576
Adjusted R2
F-statistic
8571.084 (0.0000)
DW-statistic
1.499099
Notes: Figures in ( ) represent probability values. *, ***Represent significance at 5 and 1 percent level, respectively
Table VII.
ARDL Regression
outputs
JABES
27,1
44
Table VIII.
Estimated ARDL
long-run and shortrun coefficients
Long-run coefficient estimates
Constant
201.1741 (0.0033)
Short-run coefficient estimates
Lag order
0
ΔPCEC
0.029607 (0.7716)
ΔPCGE
1.131274 (0.0010)
ΔTO
−18.17714 (0.2353)
−0.120875 (0.0000)
ECTt−1
PCEC
3.040130 (0.0002)
PCGE
6.376337 (0.0962)
1
2
−1.319006 (0.0002)
TO
188.3628 (0.2890)
1.473489 (0.0000)
Short-run diagnostic tests
Jarque‒Bera
Breusch‒Godfrey Serial
Heteroskedasticity
Ramsey RESET
Adjusted
normality test
Correlation LM
Test: ARCH
test
R2
0.958779
1.64901 (0.4384)
1.51090 (0.1075)
2.46798 (0.1183)
0.45095 (0.5074)
Notes: Diagnostic tests results are based on F-statistic and figures in ( ) represent probability values
16
12
8
4
0
–4
–8
–12
–16
Figure 3.
Plot of CUSUM test
86
88
90
92
94
96
98
CUSUM
00
02
04
06
08
10
12
14
08
10
12
14
5% Significance
1.4
1.2
1.0
0.8
0.6
0.4
0.2
0.0
–0.2
Figure 4.
Plot of CUSUM
of Sq. test
–0.4
86
88
90
92
94
96
98
00
CUSUM of Squares
02
04
06
5% Significance
Granger causality test is used to identify the causal relationship between the variables.
Existence of long-run relationship leads to expect either unidirectional or bidirectional
causal relationship between the series. The dynamic Granger causality test results (Table X)
indicate that there is a unidirectional short-run causal relationship running from per capita
electricity consumption to per capita GDP at 1 percent level of significance. The reverse
causality, that is PCGDP Granger causes PCEC, is not significant even at 10 percent level.
This result is similar to those obtained by Oh and Lee (2004) and Ahamad and Islam (2011),
but it is converse of Mazumder and Marthe (2007).
Turning to the long-run causality, the ECT coefficients were rejected in all equations
except trade openness, though per capita spending coefficient was not significant. The result
implies that electricity consumption, GDP and trade openness have bidirectional causality in
the long run. In addition, PCGDP and PCEC variables are not weakly exogenous, proposing
bidirectional long-run causality ( feedback relationship) between PCGDP and PCEC. Our
outcome is additionally in accordance with findings by Oh and Lee (2004), Ahamad and Islam
(2011) and Alam et al. (2012); they likewise uncovered feedback hypothesis in the long run
between per capita electricity consumption and per capita GDP (Figure 5).
Moreover, a joint F-test confirms the bi-directional long-run causality between electricity
consumption and GDP because we reject the null hypothesis at the 1 percent level (the null
Variable
ARDL
Coefficient
Prob.
PCEC
3.04013***
0.0002
PCGE
6.37633*
0.0962
TO
188.3628
0.2890
Constant
201.1741
0.0033
Notes: *,***Significant at 10 and 1
FMOLS
Coefficient
Prob.
1.83555***
0.0000
1.84628***
0.968885
0.3588
2.16904*
−22.47856
0.6051
−51.74164
296.6130
0.0000
281.4285
percent level, respectively
Short run
ΔPCEC
Dept.
variable
ΔPCEC
ΔPCGDP
ΔPCGE
ΔPCGDP 6.7740***
(0.0011)
ΔPCGE
0.45460
(0.7158)
ΔTO
3.0890**
(0.0404)
1.2772
(0.2981)
–
9.088***
(0.0002)
1.1267
(0.3524)
0.3071
(0.8201)
10.055***
(7.E-05)
–
0.7416
(0.5349)
0.0000
0.0747
0.2537
0.0000
t-statistic
Prob.
1.85862***
0.735028
−14.40794
299.0104
0.0000
0.4858
0.7326
0.0000
Table IX.
Estimated long-run
coefficients
0.5304
(0.6645)
2.4106*
(0.0845)
4.0212**
(0.0152)
–
−8.472***
(0.0000)
−3.382***
(0.0017)
−0.7636
(0.4501)
3.0146***
(0.0047)
F-statistic
–
58.060***
(0.0000)
0.9394
(0.4002)
4.7341**
(0.0150)
7.360***
(0.0021)
–
0.5119
(0.6037)
7.807***
(0.0015)
Notes: *,**,***Significant at 10, 5 and 1 percent level, respectively
PCGDP
5.7321***
(0.0069)
37.874***
(0.0000)
–
4.5771**
(0.0169)
5.8525***
(0.0063)
36.209***
(0.0000)
0.3017
(0.7414)
–
Table X.
Causality test results
based on the error
correction model
PCGDP
Directions of
causality
PCEC
Short-run
CCR
Coefficient
45
Source of causation
Long run
Joint (short run and long run)
ΔPCEC, ΔPCGDP, ΔPCGE,
ΔTO,
etÀ1
etÀ1
etÀ1
etÀ1
ΔTO
etÀ1
F-statistic
–
DOLS
Coefficient
Prob.
Electricity
consumption
and GDP nexus
in Bangladesh
PCEC
Long-run
Figure 5.
Causal channels
JABES
27,1
46
hypothesis that the coefficients on the ECTs and the interaction terms are jointly 0 in both
the PCGDP and the PCEC equation).
In this way, overall study findings imply that feedback hypothesis (which states that
bidirectional causality runs from electricity consumption to GDP) exists both in the
short-run and long-run, indicating that when economy grows, electricity demand increases
and the reverse is true as well in Bangladesh.
A series of diagnostic tests were conducted on the ARDL model and the model is found to
be robust against residual correlation, and the ARCH test confirms the homoskedasticity of
the residuals. At the same time, Jarque‒Bera normality test ensured that estimated residuals
are normal, and the CUSUM and CUSUM of Sq. test also confirmed the correct functional
form of the model.
6. Conclusion and policy implications
This study examines the causal linkage between electricity consumption and gross domestic
product (GDP) in Bangladesh. In this regard, along with two control variables (per capita
government spending and trade openness), the study used essential econometric techniques to
comprehend the source and direction of conceivable causal connection between them.
Cointegration test result establishes the presence of long-run equilibrium relation between
PCEC and PCGDP series. Moreover, the robustness of the long-run result is verified by other
alternative estimators. For the validation of the causal relationship, VECM-based Granger
causality test is led and the results reveal unidirectional short-run causal relationship running
between per capita electricity consumption and per capita GDP, whereas bidirectional longrun and joint causal relationship also exists between per capita electricity consumption and
per capita GDP, which demonstrates that electricity consumption can animate economic
growth and the reverse is also true. Our study findings might have a considerable impact on
the making of essential short-run and long-run policy insights.
The study findings clearly exhibit that electricity consumption can be considered as a
important factor for achieving higher growth of GDP in the short run. So, policy regarding
electricity generation, distribution, management and conservation should be given priority to
ensure higher economic growth in the short run for Bangladesh economy. On the contrary,
long-run bidirectional causal relationship (greater access to electricity and high per capita
GDP influence each other) indicates that adequate investment is required for strengthening
the electricity supply and also for those factors that will influence the GDP growth.
Notes
1. According to World Bank collection of development indicators (2017).
2. ARDL approach has several advantages over other previous and traditional methods. The first is
that it is flexible, as it allows the analysis with I(0), I(1) or a combination of both data. The second is
that ARDL test is relatively more proficient in case of small and finite sample data.
References
Acaravci, A. (2010), “Structural breaks, electricity consumption and economic growth: evidence from
Turkey”, Romanian Journal of Economic Forecasting, Vol. 13 No. 2, pp. 140-154.
Ahamad, M.G. and Islam, A.K.M.N. (2011), “Electricity consumption and economic growth nexus in
Bangladesh: revisited evidences”, Energy Policy, Vol. 39 No. 10, pp. 6145-6150.
Akinlo, A. (2008), “Energy consumption and economic growth: evidence from 11 Sub-Sahara African
countries”, Energy Economics, Vol. 30 No. 5, pp. 2391-2400.
Alam, M.J., Begum, I.A., Buysse, J. and Huylenbroeck, G.V. (2012), “Energy consumption, CO2
emissions and the economic growth nexus in Bangladesh: cointegration and dynamic causality
analysis”, Energy Policy, Vol. 45 No. C, pp. 217-225.
Altinay, G. and Karagol, E. (2005), “Electricity consumption and economic growth: evidence from
Turkey”, Energy Economics, Vol. 27 No. 6, pp. 849-856.
Aqeel, A. and Butt, M.S. (2001), “The relationship between energy consumption and economic growth
in Pakistan”, Asia Pacific Development Journal, Vol. 8 No. 2, pp. 101-110.
Belloumi, M. (2009), “Energy consumption and GNI in Tunisia: cointegration and causality analysis”,
Energy Policy, Vol. 37 No. 7, pp. 2745-2753.
Chandran, V.G.R., Sharma, S. and Madhavan, K. (2010), “Electricity consumption-growth nexus: the
case of Malaysia”, Energy Policy, Vol. 38 No. 1, pp. 606-612.
Chen, S.T., Kou, H.I. and Chen, C.C. (2007), “The relationship between GNI and electricity consumption
in 10 Asian countries”, Energy Policy, Vol. 35 No. 4, pp. 2611-2621.
Ciarreta, A. and Zarraga, A. (2010), “Electricity consumption and economic growth in Spain”, Applied
Economics Letters, Vol. 17 No. 14, pp. 1417-1421.
Engle, R.F. and Granger, C.W.J. (1987), “Co-integration and error correction: representation, estimation,
and testing”, Econometrica, Vol. 55 No. 2, pp. 251-276.
Fuinhas, J.A. and Marques, A.C. (2012), “Energy consumption and economic growth nexus in Portugal,
Italy, Greece, Spain and Turkey: an ARDL bounds test approach (1965–2009)”, Energy
Economics, Vol. 34 No. 2, pp. 511-517.
Ghosh, S. (2002), “Electricity consumption and economic growth in India”, Energy Policy, Vol. 30 No. 2,
pp. 125-129.
Granger, C.W.J. (1988), “Some recent developments in concept of causality”, Journal of Econometrics,
Vol. 39 Nos 1-2, pp. 199-211.
Hamdi, H., Sbia, R. and Shahbaz, M. (2014), “The nexus between electricity consumption and economic
growth in Bahrain”, Economic Modelling, Vol. 38 No. C, pp. 227-237.
Ho, C.-Y. and Siu, K.W. (2007), “A dynamic equilibrium of electricity consumption and GDP in Hong
Kong: an empirical investigation”, Energy Policy, Vol. 35 No. 4, pp. 2507-2513.
Iyke, B.N. (2015), “Electricity consumption and economic growth in Nigeria: a revisit of the energygrowth debate”, Energy Economics, Vol. 51 No. C, pp. 166-176.
Jamil, F. and Ahmad, E. (2010), “The relationship between electricity consumption, electricity prices
and GDP in Pakistan”, Energy Policy, Vol. 38 No. 10, pp. 6016-6025.
Jumbe, C.B.L. (2004), “Cointegration and causality between electricity consumption and GDP: empirical
evidence from Malawi”, Energy Economics, Vol. 26 No. 1, pp. 61-68.
Kraft, J. and Kraft, A. (1978), “On the relationship between energy and GNP”, Journal of Energy and
Development, Vol. 3 No. 2, pp. 401-403.
Morimoto, K. and Hope, C. (2004), “Impact of electricity supply on economic growth in Sri Lanka”,
Energy Economics, Vol. 26 No. 1, pp. 77-85.
Mozumder, P. and Marathe, A. (2007), “Causality relationship between electricity consumption and
GDP in Bangladesh”, Energy Policy, Vol. 35, pp. 395-402.
Narayan, P.K. and Singh, B. (2007), “The electricity consumption and GDP nexus for the Fiji Islands”,
Energy Economics, Vol. 29 No. 6, pp. 1141-1150.
Narayan, P.K. and Smyth, R. (2005), “Electricity consumption, employment and real income in Australia:
evidence from multivariate Granger causality tests”, Energy Policy, Vol. 33 No. 9, pp. 1109-1116.
Odhiambo, N.M. (2009), “Energy consumption and economic growth nexus in Tanzania: an ARDL
bounds testing approach”, Energy Policy, Vol. 37 No. 2, pp. 617-622.
Oh, W. and Lee, K. (2004), “Energy consumption and economic growth in Korea: testing the causality
relation”, Journal of Policy Modeling, Vol. 26 Nos 8-9, pp. 973-981.
Park, J.Y. (1992), “Canonical cointegrating regressions”, Econometrica, Vol. 60 No. 1, pp. 119-143.
Pesaran, M. and Shin, Y. (1999), “An autoregressive distributed lag modeling approach to cointegration
analysis”, in Strom, S. (Ed.), Econometrics and Economic Theory in the 20th Century: The
Ragnar Frisch Centennial Symposium, Cambridge University Press, Cambridge, pp. 371-413.
Electricity
consumption
and GDP nexus
in Bangladesh
47
JABES
27,1
48
Pesaran, M.H., Smith, R.J. and Shin, Y. (2001), “Bounds testing approaches to the analysis of level
relationships”, Journal of Applied Econometrics, Vol. 16 No. 3, pp. 289-326.
Phillips, P.C.B. and Hansen, B.E. (1990), “Statistical inference in instrumental variables regression with
I(1) processes”, Review of Economic Studies, Vol. 57 No. 1, pp. 99-125.
Polemis, M.L. and Dagoumas, A.S. (2013), “The electricity consumption and economic growth nexus:
evidence from Greece”, Energy Policy, Vol. 62 No. C, pp. 798-808.
Rahman, M.M. and Mamun, S.A.K. (2016), “Energy use, international trade and economic growth nexus
in Australia: new evidence from an extended growth model”, Renewable and Sustainable Energy
Reviews, Vol. 64 No. C, pp. 806-816.
Shahbaz, M., Hye, Q.M.A., Tiwari, A.K. and Leitão, N.C. (2013), “Economic growth, energy
consumption, financial development, international trade and CO2 emissions in Indonesia”,
Renewable and Sustainable Energy Reviews, Vol. 25 No. C, pp. 109-121.
Shiu, A. and Lam, L.P. (2004), “Electricity consumption and economic growth in China”, Energy Policy,
Vol. 32 No. 1, pp. 47-54.
Stern, D.I. (1993), “Energy use and economic growth in USA, a multivariate approach”, Energy
Economics, Vol. 15 No. 2, pp. 137-150.
Stock, J.H. and Watson, M.W. (1993), “A simple estimator of cointegrating vectors in higher order
integrated systems”, Econometrica, Vol. 61 No. 4, pp. 783-820.
Tang, C.F. (2008), “A re-examination of the relationship between electricity consumption and economic
growth in Malaysia”, Energy Policy, Vol. 36 No. 8, pp. 3077-3085.
Tang, C.F., Shahbaz, M. and Arouri, M. (2013), “Re-investigating the electricity consumption and
economic growth nexus in Portugal”, Energy Policy, Vol. 62 No. C, pp. 1515-1524.
Yoo, S.H. (2005), “Electricity consumption and economic growth: evidence from Korea”, Energy Policy,
Vol. 33 No. 12, pp. 1627-1632.
Yuan, J., Zhao, C., Yu, S. and Hu, Z. (2007), “Electricity consumption and economic growth in China:
cointegration and co-feature analysis”, Energy Economics, Vol. 29 No. 6, pp. 1179-1191.
Further reading
Dickey, D.A. and Fuller, W.A. (1979), “Distribution of the estimators for autoregressive time series with
a unit root”, Journal of the American Statistical Association, Vol. 74 No. 366, pp. 427-431.
Phillips, P.C.B. and Perron, P. (1988), “Testing for a unit root in time series regression”, Biometrika,
Vol. 75 No. 2, pp. 335-346.
About the authors
Sima Rani Dey is currently working as Assistant Professor in Bangladesh Institute of Governance and
Management (BIGM) located in Dhaka. She has completed her graduation and post-graduation in Statistics;
she did another masters in macroeconomic policy as well later on. Her research interests are mainly the
macroeconomic issues including consumption expenditure, energy, external debt, trade and financial
development. Carbon emission, urbanization and migrants are the recent contents of her research. She also
has an interest to work on human capital development and poverty in order to examine their impact on the
economic growth of Bangladesh. Sima Rani Dey is the corresponding author and can be contacted at:
Mohammed Tareque is Director of Bangladesh Institute of Governance and Management (BIGM)
located in Dhaka, capital of Bangladesh. He is a postgraduate of economics and has completed his PhD
from Boston University. He has served the Government of Bangladesh as Senior Secretary of Finance
Division and possesses a vibrant career for his great contribution in Finance ministry. His research
interests are the macroeconomic issues of Bangladesh.
For instructions on how to order reprints of this article, please visit our website:
www.emeraldgrouppublishing.com/licensing/reprints.htm
Or contact us for further details: