Enrolment by academic discipline in higher education: Differential and determinants
Bạn đang xem bản rút gọn của tài liệu. Xem và tải ngay bản đầy đủ của tài liệu tại đây (280.4 KB, 21 trang )
The current issue and full text archive of this journal is available on Emerald Insight at:
www.emeraldinsight.com/2515-964X.htm
Enrolment by academic
discipline in higher education:
differential and determinants
Geetha Rani Prakasam
Academic
discipline
in higher
education
265
National Institute of Educational Planning and Administration, New Delhi, India
Mukesh
Ministry of Statistics and Programme Implementation, New Delhi, India, and
Gopinathan R.
Received 5 December 2018
Revised 7 March 2019
11 March 2019
15 April 2019
Accepted 18 June 2019
Shri Mata Vaishno Devi University, Jammu, India
Abstract
Purpose – Enrolling in an academic discipline or selecting the college major choice is a dynamic process.
Very few studies examine this aspect in India. This paper makes a humble attempt to fill this gap using
NSSO 71st round data on social consumption on education. The purpose of this paper is to use multinomial
regression model to study the different factors that influence course choice in higher education.
The different factors (given the availability of information) considered relate to ability, gender, cost of
higher education, socio-economic and geographical location. The results indicate that gender polarization is
apparent between humanities and engineering. The predicated probabilities bring out the dichotomy
between the choice of courses and levels of living expressed through consumption expenditures in terms of
professional and non-professional courses. Predicted probabilities of course choices bring in a clear
distinction between south and west regions preferring engineering and other professional courses, whereas
north, east and NES prefer humanities.
Design/methodology/approach – The present paper follows the same approach as P
that of Turner and
Bowen (1999). The Multinomial regression is specified as P ðM i ¼ jÞ ¼ ðexpðbj  X i Þ= 5jÀ1 expðbj  X i ÞÞ,
where P (Mi ¼ j) denotes the probability of choosing outcome j, the particular course/major choice that
categorizes different disciplines. This response variable is specified with five categories: such as medicine,
engineering, other professional courses, science and humanities. The authors’ primary interest is to determine
the factors governing an individual’s decision to choose a particular subject field as compared to humanities.
In other words, to make the system identifiable in the MLR, humanities is treated as a reference category.
The vector Xi includes the set of explanatory variables and bj refers to the corresponding coefficients for each of
the outcome j. From an aggregate perspective, the distribution of course choices is an important input to the skill
(technical skills) composition of future workforce. In that sense, except humanities, the rest of the courses are
technical-intensive courses; hence, humanities is treated as a reference category.
Findings – The results indicate that gender polarization is apparent between humanities and engineering.
The predicated probabilities bring out the dichotomy between the choice of courses and levels of living
expressed through consumption expenditures in terms of professional and non-professional courses.
Predicted probabilities of course choices bring in a clear distinction between south and west regions
preferring engineering and other professional courses, whereas north, east and NES prefer humanities.
Research limitations/implications – Predicted probabilities of course choices bring in a clear distinction
between south and west regions preferring engineering and other professional courses, whereas north, east
and NES prefer humanities. This course and regional imbalance need to be worked with multi-pronged
strategies of providing both access to education and employment opportunities in other states. But the
© Geetha Rani Prakasam, Mukesh and Gopinathan R. Published in Journal of Asian Business and
Economic Studies. Published by Emerald Publishing Limited. This article is published under the
Creative Commons Attribution (CC BY 4.0) licence. Anyone may reproduce, distribute, translate and
create derivative works of this article (for both commercial and non-commercial purposes), subject to
full attribution to the original publication and authors. The full terms of this licence may be seen at
/>The authors would like to thank two anonymous referees of the journal for their valuable comments
and suggestions which helped in improving the quality paper substantially. Remaining errors if any
are liable to the authors.
Journal of Asian Business and
Economic Studies
Vol. 26 No. 2, 2019
pp. 265-285
Emerald Publishing Limited
2515-964X
DOI 10.1108/JABES-12-2018-0104
JABES
26,2
266
predicted probabilities of medicine and science remain similar across the board. Very few research studies on
the determinants of field choice in higher education prevail in India. Research studies on returns to education
by field or course choices hardly exist in India. These evidences are particularly important to know which
course choices can support student loans, which can be the future area of work.
Practical implications – The research evidence is particularly important to know which course choices can
support student loans, which can be the future area of work, as well as how to address the gender bias in the
course choices.
Social implications – The paper has social implications in terms of giving insights into the course choices of
students. These findings bring in implications for practice in their ability to predict the demand for course
choices and their share of demand, not only in the labor market but also across regions. India has 36 states/UTs
and each state/UT has a huge population size and large geographical areas. The choice of course has
state-specific influence because of nature of state economy, society, culture and inherent education systems.
Further, within the states, rural and urban variation has also a serious influence on the choice of courses.
Originality/value – The present study is a value addition on three counts. First, the choice of courses
includes the recent trends in the preference over market-oriented/technical courses such as medicine,
engineering and other professional courses (chartered accountancy and similar courses, courses from
Industrial Training Institute, recognized vocational training institute, etc.). The choice of market-oriented
courses has been examined in relation to the choice of conventional subjects. Second, the socio-economic
background of students plays a significant role in the choice of courses. Third, the present paper uses the
latest data on Social Consumption on Education.
Keywords Higher education, Gender, Region, Enrolment choice, Multinomial regression,
Technical and non-technical stream
Paper type Research paper
1. Introduction
Selecting the best possible course, given the individual endowments, is a challenging key
decision in a youth’s life, because students have imperfect information and beliefs about
probability of success, match or mismatch between ability and effort, enjoyability of a
course, knowledge requirements of jobs, peer and family pressure, expected earnings,
employment rates, etc. Choice of major is a critical decision that determines many future
outcomes. Understanding these factors involves a series of processes that impinges
on the private and social returns to human capital investment (Turner and Bowen, 1999).
Studying the relationship between major choice and labor market outcomes is equally
important from a societal perspective. The present paper makes an effort to understand the
various factors that influence the choice of course using the available data sources.
In India, 27.29m students were enrolled in various undergraduate courses in 2015‒2016.
This number constitutes 80 percent of total enrollment in higher educational institutions
(AIHES, 2017). This statistic depicts a gross enrollment ratio (GER) of 25 percent, which is
considerably low in comparison to developed nations. The young India combined with low
GER clearly indicates the prospects of students’ enrollment growth. Nonetheless, students’
decisions about whether to enroll in college, where to enroll in college, what to study in
college, how long and how to finance college are the sequential complex questions on which
the students have very limited information. The choice of major or course is one of the
important determinants of the labor market outcomes of students. It is also the other way
round that the choice of a major plays a critical role in determining the future earnings.
These two decisions reinforce each other[1]. When students and families make their choice,
very little is known about various factors that influence the choice.
Students may make their major choice decisions partly due to the expected (lifetime)
earnings, information on earnings and its lagged response, employment rates, and
probability of success, either constant or perceived association with different majors. There
are many other elements entering the choice of concentration of college students, namely,
students’ tastes and preferences[2], high school curriculum/preparedness, cognitive and
non-cognitive ability, expected benefits of alternative courses of study, exposure to different
fields of study, knowledge content required in job market, and business cycle-related
choices, besides the heterogeneous personal and family background characteristics
including social and parental expectations and attitudes and interests stimulated by faculty
and peer groups. Major/choice selection further reflects a variety of underlying factors, such
as affordability, social status, etc.
In this backdrop, the objective of the present paper is to identify the determinants on the
probability of students’ enrollment of courses in higher education. In this endeavor, we
examine the most popular choice of subjects among students, namely, medicine, engineering,
other professional courses, science and humanities. It can be noted from the review of earlier
studies in the next section that there hardly exist studies that examine the course choices[3] in
India. This paper makes an effort to fill this gap. It is expected that the estimated probability
of course choices can inform the policy on the initiatives toward science, technology,
engineering and mathematics (STEM), job-oriented and skill development courses, the balance
between market and non-market-oriented courses, etc.
2. Review of select earlier studies
There exists a huge literature dealing with different aspects on the study of major
choice[4]. The present review restricts itself to studies that deal with factors that
determine the major choice. In the economic literature, estimates on the returns to
education prevail since 1960s (Becker, 1975; Mincer, 1974; Schultz, 1961). One of the
earliest studies examined how mathematical ability influences subject choice in explaining
the differences in earnings across disciplines. This differential return is found to be on
account of the quantitative abilities in the production of human capital (Paglin and Rufolo,
1990). On these lines, many papers examined linking the choice of courses and their
earning differentials. For instance, in analyzing the demand for and return to education,
Altonji (1993) developed a model in which higher education involves a chain of sequential
decisions about whether to attend college and then what subject to major, based on
expected economic returns. In this framework, he explored the effects of ability, high
school preparation, preferences for schooling and the borrowing rate in two periods[5].
He further estimated the effects of gender, aptitude, high school curriculum and family
background on the expected returns.
Using data from the National Longitudinal Survey of Young Men, Berger (1988)
examined the relationship between predicted future earnings for five broad fields and choice
of major. Following Heckman selection framework, he estimated the short-term expected
future earnings from each degree. The predicted future earnings for each major are
subsequently included in a conditional logit model of college choice, which is found to be a
significant factor in students’ decisions. Controlling for family background characteristics,
he found that individuals are likely to choose those majors that offer better future earning
flow and not based on the entry level salary. Later, Montmarquette et al. (2002) examined
that the choice of a major depends on students’ perceived probability of success and the
predicted earnings of graduates and a counterfactual if students fail to complete the degree.
Using a mixed multinomial logit model, they found that expected earnings are the most
significant variable. However, they reported significant differences in the impact of expected
earnings by gender and race.
Adopting experimental approach, Arcidiacono et al. (2010) collected information from
students about their expected earnings in the current chosen majors and in counterfactual
majors, and subjective assessments of their abilities in chosen and counterfactual majors.
Using this panel of beliefs, they estimated a model of college major choice that incorporates
these subjective expectations and assessments. They found that both expected earnings and
students’ abilities in different majors are important determinants of student’s choice of a
major. They further estimated that 7.5 percent of students would switch majors if they did
not make any forecast errors. They also found if expected earnings were equal across
Academic
discipline
in higher
education
267
JABES
26,2
268
majors, students would switch over for humanities and social sciences to the tune of
17 percent and choosing economics would fall by 16 percent.
Taking further, Long et al. (2015) tried to find out the time lag or lagged response of
completed major response in a field in year t+y and its relation to wages in the associated
occupations in year t. This is explored by estimating the causality and correlation between
majors produced in year t and associated occupational wages in year t–y. Further, they
assessed whether choice of majors responds to national and local labor market wages, how
responsive are the tightly connected majors and occupation to wages, and existence of
heterogeneity in response by student characteristics. They found that college majors are
most strongly related to wages observed three years earlier, when students were college
freshmen. The responses to wages vary depending on the extent to which there is a strong
mapping of majors into particular occupations. Yet, another important finding is that majors
respond more strongly in disciplines wherein information is more salient and applicable.
Differences in student ability and aptitudes have been found to influence choice of college
majors. For example, Turner and Brown (1999) provided evidence of ability sorting across
majors by SAT scores. Cognitive and non-cognitive abilities play a large role in the choice of
college major (Heckman and Mosso, 2014).
As can be noted, very few studies examine the choice of course (major)[6] in India. One
such study is Chakrabarti (2009), which estimated the factors that explain choice of different
stream of studies such as Arts, Commerce, Science and Technical Education as compared to
not enrolling in higher education using the 52nd round NSSO data. She first estimated the
demand for higher education by considering its social composition, gender-related aspects,
economic background and cost of education. Since then, the deepening of globalization
brought about many changes across the higher education system in countries, such as
reduction in the size of the government, government-funded systems including education,
more specifically higher education. Paralleled is the attraction of the skilled individuals,
which led to the increase in the social demand for professional higher education.
3. The present study
In this light, the present paper attempts to explore the determinants on the probability of
students’ enrollment of courses in higher education. One major difficulty in the estimation
of choice of course is the selection issue, as we do not get information on choice of subjects
for students, who drop out from higher education. Even among those who continue to
pursue higher education, what is available is the realized choices of major and not the initial
choices. It is quite possible that there could be a difference between the initial and realized
choices, due to many reasons. Such information on the initial or ex ante choice of courses is
not available. Hence, many choice path determinants could not be measured also due to the
uncertainty involved in each stage of decision making. The paper notes the major data gap
in directly studying the course choice in India, given the available data. This has been
further discussed in the agenda for future research. Hence, the paper attempts to examine
the enrollment by academic discipline in a multinomial logistic regression (MLR) and
thereby examines the causal relationship between the set of select explanatory variables.
We are motivated to examine the choice (enrollment) of selected subjects that are most
popular among students. Accordingly, the paper focuses on the subject choices of medicine,
engineering, other professional courses, science and humanities. Given the categorical
nature of course choice, MLR is estimated. The present study is a value addition on three
counts. First, the choice of courses includes the recent trends in the preference over
market-oriented/technical courses such as medicine, engineering and other professional
courses (chartered accountancy and similar courses, courses from Industrial Training
Institute (ITI), recognized vocational training institute, etc.). The choice of market-oriented
courses has been examined in relation to the choice of conventional subjects. Second, the
socio-economic background of students plays a significant role in the choice of courses.
Third, the present paper uses the recent 71st round NSSO data on Social Consumption on
Education. It is pertinent to note that no earnings data are available from this survey and
the same is supplemented with the earning data from IHDS-II.
Much of the literature on choice of major utilizes individual survey data; multinomial
logit (MLR) is used to estimate choices among a limited number of broad fields of study. The
present paper follows the same approach as that of Turner and Bowen (1999). It is specified
as follows:
À
Á
exp bj nX i
(1)
P ðM i ¼ jÞ ¼ P5
À
Á;
jÀ1 exp bj nX i
where P (Mi ¼ j) denotes the probability of choosing outcome j, the particular course/major
choice that categorizes different disciplines. This response variable is specified with five
categories: such as medicine, engineering, other professional courses, science and
humanities. Our primary interest is to determine the factors governing an individual’s
decision to choose a particular subject field as compared to humanities. In other words, to
make the system identifiable in the MLR, humanities is treated as a reference category.
The vector Xi includes the set of explanatory variables and βj refers to the corresponding
coefficients for each of the outcome j. From an aggregate perspective, the distribution of
course choices is an important input to the skill (technical skills) composition of future
workforce. In that sense, except humanities, the rest of the courses are technical-intensive
courses; hence, humanities is treated as a reference category.
4. Data and variables
The present paper uses the 71st Round data of NSSO on “Participation and Expenditure on
Education”. The survey covered the whole of India, and the period of survey was of 6-month
duration, starting on January 1, 2014 and ending on June 30, 2014. A stratified multi-stage
design was adopted for the survey. A total of 4,577 villages were surveyed in rural India and
the number of urban blocks surveyed was 3,720 as first-stage units in urban areas. The total
number of households surveyed was 36,479 and 29,447 in rural and urban India,
respectively. The total number of individuals covered were 178,331 in rural and 132,496 in
urban India (Government of India, 2015). The present paper uses extensively the
information from Block 5 of the schedule 25.2 in understanding the central question of
the paper, namely, factors that influence the enrollment choice of course in higher education.
There were 93,513 individuals in 5‒29 age group in the survey who were then attending
any educational institution. Among these individuals, our variable of interest was students
who were enrolled in graduate and above courses. Considering the dependent response
variable, our analysis was based on the 17,235 students in this age group who were then
attending any higher educational institution in the major courses such as medicine,
engineering (includes IT and computer courses), other professional courses (chartered
accountancy and similar courses and courses from ITIs), science (including agriculture) and
humanities. Table I report the variables included in the multinomial logistic regression.
They are grouped as follows: expected income, ability, cost of education, personal,
socio-economic and location factors.
Expected Earnings are proxied by the wage rate of individuals by discipline and states.
Since earnings (wage rate) of individuals are not available in the NSSO 71st round, the same
is taken from the India Human Development Survey- II, 2012. It is jointly conducted by the
University of Maryland and the National Council of Applied Economic Research, New Delhi.
It covers all states and union territories of India, with the exception of Andaman/Nicobar
and Lakshadweep. The survey covers 42,152 households in 384 districts, 1,420 villages
Academic
discipline
in higher
education
269
JABES
26,2
270
Broad group
Determinants
Expected
earnings
Earning by discipline (Proxy Earning
for expected earnings)
Ability
enhancers
Language spoken at home
and school: dummy
Able to operate computer:
dummy
Private coaching: dummy
HH. Expenditure on
education: continuous
Free education: dummy
Type of institution: dummy
Gender: dummy
Social group: categorical
Cost of
education
Personal
factors
Religion: categorical
Socioeconomic
factors
Veritable notation
LANG_INSTU_HOME
PRIVATE_COACHING
HHX_education
Yes ¼ 1; No ¼ 0
Cluster by States and course
Free_education
Govt_Institution
GENDER_STUDENTS
OBC, Others
Yes ¼ 1; No ¼ 0
Govt ¼ 1; Non-Govt ¼ 0
Male ¼ 1; Female ¼ 0
Scheduled Tribes/Scheduled
Castes ¼ 1; Other Backward
Castes (OBC) ¼ 2; Other Castes ¼ 3
Islam ¼ 1; Christianity ¼ 2; Other
Religions ¼ 3; Hinduism ¼ 4
From Poorest to Richest HH
expenditure quintiles Q1; Q2; Q3;
Q4; Q5
Self-employed ¼ 1; Salary
earning ¼ 2; Casual labor ¼ 3;
Other Labor ¼ 4
Elementary and Below ¼ 0 and
secondary and above ¼ 1
Marginal ¼ 1; Small ¼ 2;
Medium ¼ 3; Large ¼ 4
Rural ¼ 1; Urban ¼ 2
South ¼ 1; West ¼ 2; East ¼ 3:
North-East ¼ 4; North ¼ 5
Level of living: categorical
Christianity, Other
Religion, Hinduism,
Q2, Q3, Q4, Q5
Occupation of family:
categorical
Salary earning, casual
labor, other labor
Geographical Sector: categorical
location
Regions: categorical
Cluster by States and disciplinary
choices derived from IHDS-II
survey
Different ¼ 1; Same ¼ 0
ABLE_OPERATE_COMP Yes ¼ 1; No ¼ 0
Education of head of family: Edn_hoh
Dummy
Family size: categorical
Small, Medium, Large
Table I.
Determinants of
college course/major
choice
Categories
Urban
West, East, NES, North
Note: Reference category in italic letters
and 1,042 urban blocks located in 276 towns and cities across India. The villages and urban
blocks are the primary sampling unit from which the rural sample was drawn using
stratified random sampling and the urban sample from a stratified sample of towns and
cities within states (or groups of states) selected by probability proportional to population
(Desai et al., 2015).
Education variable collected in IHDS-II survey comprises of various degrees and majors
in higher education. The various degrees consist of graduate degree in general/
nonprofessional education (BA, BSc, BCom, etc.); graduate degree in engineering (BE,
BTech.); graduate degree in medicine (MBBS/BAMS); post-graduate and above degree in
general/nonprofessional education (Masters, PhD); post-graduate degree in professional
education (MD, Law, MBA, CA, etc.); and diploma in vocational education (Diploma o
3 years; Diploma 3+years). Another category is incomplete, that is non-graduates
(a completed higher secondary level). Using this available information, we create a new
variable, the subject choice consisting of the subjects humanities (including science),
engineering, medicine and other professional courses. This categorization is followed
so as to align with course choices that we categorized using the NSSO 71st round data.
The column 2 in Table II exhibits the categorization.
Within humanities, we extracted science graduates using the information in the variable
on the subject studied after high school. The data are inflated to 2014 using the per captia
Highest degree
(1)
Subject choice
(2)
Mean earning
(3)
BA, BSc, BCom, etc.
Humanities
BE, BTech.
Engineering
MBBS/BAMS
Medicine
NA
Masters, PhDb
MD, Law, MBA, CA, etc.
Other Professional
Diploma o3 years
-doDiploma 3+ years
-doNA
Othersb
Total
Notes: a15–65 age group (Based on IHDS-II); bExcluded as
Freq.
(4)
% Distribution
(5)
150,833
7,654
63.95
273,827
383
3.20
306,088
109
0.91
190,082
2,260
18.88
226,354
486
4.06
158,353
705
5.89
209,523
189
1.58
107,518
182
1.52
169,450
11,968
100.00
there are no subject details available
income growth across states. The mean earnings of the working age population 15‒65
across states and subject groups are used as a proxy for expected earnings. This
information is triangulated to NSSO 71st survey data using a cluster variable of states and
subjects choices. To get an idea of the earnings differential, Table II reports the mean
earnings of individuals with highest degree among the working age population. It can
be noted the highest earning is among the MBBS/BAMS and least earning is among the
BA/BSc/BCom categories, besides others.
4.1 Ability
The acquired ability[7] variables seek to determine whether different types of cognitive
capabilities affect the probability of success and expected earnings of graduates in different
major choices. The unobservable characteristics of ability measures enter into the choice
models as SAT scores, mathematical ability, high school academic preparation, cognitive
and non-cognitive abilities, etc. In the absence of such information, the present paper
attempts to include three proxy ability dummy measures, namely, language spoken at home
and school is the same or different, ability to operate computer and the private coaching
opted by the student. The language spoken at home and college is used as indicators of
unobserved ability. Introducing language ability into the analysis is important, since it is
essential for explaining college selection and also has a significant impact on college choice
and earnings after college graduation. If language spoken at home is the same as studied in
school, it indicates a higher acquired ability to speak, read and write another language
(English). Most of the college/university courses use textbooks written in English and the
medium of instruction is likely to be English. However, language spoken at home is likely to
be the regional language. When medium of instruction is other than the one spoken at home
(English), it brings in an additional acquired ability for the student to the selection of choice
of courses. It can reflect the economic conditions of the family, which is a well-known
positive relationship between education and income. Studying the influence language
spoken at home and school over the course choice brings out some interesting findings. The
connection between language and cognitive ability and earnings is analyzed by a number of
studies. For instance, Azam et al. (2011) estimated the effects of English language skills on
wages. They found that hourly wages are on average 34 percent higher for men who speak
fluent English and 13 percent higher for men who speak a little English compared to men
who do not speak English. The return to fluent English is as large as the return to complete
secondary school and half as large as the return to complete a Bachelor’s degree.
Similar argument can be made for ability to operate computer. The digital technologies
have spread rapidly across the world. Adapting workers’ skills to the demands of the new
Academic
discipline
in higher
education
271
Table II.
Mean earning by
highest degree of the
working age
populationa in India
JABES
26,2
272
economy is a challenge and responding to the fast-changing information and communication
technology (ICT) and their adoption requires multiplicity of skills. Hence, this acquired ability
to operate computer is used as yet another proxy for ability in the paper.
4.2 Descriptive statistics
Table III reports descriptive statistics of the variables used in the paper. The mean earnings for
graduates with humanities are Rs.190,466, whereas they are Rs.249,919 for medical graduates.
Medicine Engineering
Table III.
Summary statistics of
attending students by
major choice (in %)
Expected Earnings (in Rs)
249,919
Lang_Same
0.97
Different
7.23
ABLE_OPERATE_COMP
5.76
NO
2.65
PRIVATE_COACHING
6.13
NO
1.66
HH Exp. Higher Education (in Rs.) 112,891
Free_education
5.46
No
3.97
Govt
6.80
Non_Govt
4.48
Male
3.75
Female
7.57
SC/ST
6.14
OBC
5.13
Others
5.12
Islam
5.98
Christianity
10.64
All Other Religions
7.38
Hinduism
4.73
Q1
2.72
Q2
3.63
Q3
4.27
Q4
5.31
Q5
8.63
Self-employed
4.72
Salary earning
6.77
Casual labor
2.99
Other labor
5.42
Illiterate
3.64
Primary/UPry
4.36
Sec/Hr Sec
4.81
Grad&above
8.16
Marginal
4.56
Small
5.88
Medium
5.14
Large
4.78
Rural
5.42
Urban
5.30
South
6.01
West
5.44
East
3.24
NES
10.20
North
4.13
Total
5.35
272,890
4.96
40.72
34.18
2.17
31.19
24.27
75,598
31.33
13.24
44.84
21.08
37.60
19.42
23.53
32.15
31.51
25.40
23.08
29.53
31.16
15.75
20.22
26.00
34.21
42.67
28.60
33.19
22.03
32.27
21.69
25.38
32.16
36.77
34.80
36.19
27.27
21.07
26.89
32.46
44.67
25.33
29.21
23.24
25.89
29.98
Other Prof.
courses
241,555
29.34
27.18
28.88
20.86
27.14
31.08
41,617
28.02
25.39
27.90
27.79
27.70
28.00
26.51
25.27
30.96
27.71
24.80
30.22
27.96
23.61
26.10
29.56
27.72
29.96
27.78
27.42
30.53
27.36
27.65
28.05
27.63
27.93
31.76
28.84
27.08
26.40
24.86
30.21
28.50
33.93
26.23
20.50
27.28
27.83
Science Humanities
190,466
10.87
12.23
11.30
15.25
10.87
16.29
25,862
11.50
15.73
9.12
13.43
10.92
13.07
11.50
13.83
10.11
11.51
11.72
9.33
12.00
13.72
13.69
12.89
12.08
8.61
11.78
11.45
11.64
13.79
12.32
12.13
11.43
11.71
9.46
10.85
13.02
11.98
12.24
11.48
13.81
9.11
7.58
13.25
12.72
11.82
164,282
53.86
12.64
19.88
59.08
24.67
26.70
11,675
23.69
41.67
11.34
33.22
20.04
31.94
32.31
23.63
22.30
29.40
29.76
23.54
24.15
44.20
36.36
27.28
20.68
10.13
27.11
21.18
32.81
21.16
34.70
30.07
23.97
15.43
19.43
18.24
27.50
35.77
30.60
20.54
7.01
26.19
33.75
32.82
29.99
25.02
Total
226,021
5,178
12,057
14,972
2,263
14,227
3,008
46,263
15,951
1,284
6,456
10,779
10,011
7,224
2,129
6,495
6,915
1,772
1,109
317
13,636
2,317
2,973
3,281
4,124
4,540
8,682
5,897
1,271
1,385
2,199
5,019
5,799
4,218
592
7,011
6,367
3,265
7,680
9,555
3,779
2,997
1,914
1,932
6,613
17,235
In the total sample of students, 30 percent of them speak the same language both at home
and in their colleges. Among them, the humanities major constitutes 50 percent, followed
by 30 percent enrolled in other professional courses. On the contrary, majority of the
students, 70 percent, speak different languages than the ones they speak at home. Different
language share is the highest among engineering course, followed by other professional
courses. Another proxy for ability considered here is the dummy variable ability to operate
computers. In the overall sample, more than 80 percent of the students are able to
operate computers. As expected, the highest share of students in this category chooses
engineering courses, followed by other professional courses. However, 60 percent of the
students enroll in humanities, followed by other professional courses among the 20 percent
who are not able to operate computer. Another effort promoting activity to enhance ability is
private coaching. In the overall sample, more than 80 percent students take private tuition.
Unlike other two ability proxies, here, it can be noted that private tuition is common across
all course groups except medicine.
4.2.1 Cost of education. Invariably almost all earlier studies indicate the direct link
between the choice of majors and the expected earnings. It may be noted this is the direct
benefit of selecting a particular major, though realizable in the future. In other words, the
returns to education have been implicitly the underlying factor in the choice of major.
However, studies rarely examined the influence of cost of education on the choice of major.
Cost of education is a significant predictor of the course enrollment. The proxy for cost of
education available in the NSSO data is the household expenditure on higher education by
the broad disciplinary choices. It ranges from Rs. 11,675 for humanities to Rs. 112,891 for
medical courses (Table III). Yet, another cost of education proximate variable used here is
whether education is free or not. Almost 90 percent of the total sample report education
is free. Among them, the highest share of free education is availed by engineering, other
professional and humanities students. On the contrary, no free education is available to
humanities, followed by other professional courses. It is important to note that engineering
students get the highest share of free education. Another cost-related factor is whether the
students study in government or non-government institutions. It is well known that cost of
higher education in government institutions is much lower than in non- government or
private institutions. More than 60 percent of the total sample students are enrolled in
government institutions. Among this, the highest share is in engineering, followed by other
professionals, whereas in non-government institutions, the highest share is among
humanities, followed by other professional and engineering courses.
4.2.2 Personal characteristics. The personal variables included in the model are
gender, caste and religion. The gender variable, for example, seeks to determine whether
women are (as is generally believed) less likely than men to choose science or engineering
subjects. Similarly, the caste and religious affiliation influence the choice of course in
college. With regard to the gender composition, around 60 percent of the sample
constitutes male students enrolled in higher education. Among this, the highest preference
is for engineering, followed by other professional and humanities courses. Among female
students, highest preference is humanities, followed by other professional and engineering
courses. The same pattern is found across Christian students. With regard to social
category, in the total sample, 40 percent belong to general or forward category, another
40 percent OBC, and the rest 20 percent belong to SC/ST category. Among the privileged
and OBC groups, the most preferred course is engineering, other professional courses,
followed by humanities. A similar pattern is found across Hindus, which constitute
80 percent of the sample, whereas among SC/ST students, the first preferred courses is
humanities, followed by other professional courses. This pattern is similar to the
preferences of Islamic students.
Academic
discipline
in higher
education
273
JABES
26,2
274
4.2.3 Socio-economic variables. Family expenditures, the education and occupational
levels of parents, as well as elements of family structure such as the size of the family enter
the model as socio-economic variables. Historically, education and income are positively
related. With rising cost of professional as well as general higher education, the economic
condition of family is one of the decisive factors for the course choices. The present paper
uses two economic indicators, occupation and the level of living of family (proxied by
quintiles of monthly per capita consumption expenditures), as predictors to investigate the
quantitative impact of different categories on selection of courses. It is argued that a more
privileged background would enable a student to take risk by entering a more demanding
course in science. Similarly, the parental education variables measure potential educational
advantages or disadvantage due to a student’s educational background of family, which
may influence him or her to choose a major with a higher risk.
In case of economic factors, among the lowest level of living quintile, 44.20 percent are
enrolled in humanities, followed by other professional and engineering courses (Table III).
Similar is the pattern across the low or Q2 quintile. In the middle quintile Q3, the highest
share of students prefer other professional courses, followed by humanities and
engineering courses. In the upper middle quintile Q4, students first prefer engineering,
followed by other professional courses and humanities courses. In the top quintile Q5,
engineering, other professional courses and humanities occupy the major shares.
Interestingly, medicine and sciences occupy the same shares across quintiles. A clear
division is apparent between the least Q1 and the top Q5 in terms of course choices. With
regard to occupation, 50 percent of the students’ families are engaged in self-employment,
followed by another 34 percent in salaried earnings. Among the self-employed, most
preferred course is engineering, and equal preference is between other professional and
humanities, whereas among the salaried, the first preferred course is engineering, followed
by other professional and humanities courses.
Educational attainment of the head of the household is classified as no literate, primary,
secondary and graduate and above levels of education. In the total sample, 34 percent of the
students’ head of the family attains secondary education, ranging from 9 to 12 years
of schooling. Another 30 percent are with 5‒8 years of schooling. Another 24 percent of
students’ head of the family has graduate and above educational attainment. When
education of the head of household is secondary and above, the most preferred course is
engineering, followed by other professional and humanities courses. When education of the
head of the household is below elementary levels, the most preferred course is humanities,
followed by other professional courses and engineering.
In the case of family size, majority, almost 70 percent, of the sample students belong to
either small or medium family size, including marginal families, the highest preferences are
towards engineering, followed by other professional and humanities as in the case of rich
quintile Q5, male and Hindu students. Among the large family size, most preferred course is
humanities, followed by other professional and engineering courses as found in poorest
quintile Q1 and in below elementary levels of education of the head of the households.
4.2.4 Geographical. The choice of major depends not only on the costs, expected earnings,
and household characteristics but also on differences in regions. The regional variables
considered in the analysis are location and regions. Locations measure college education
received in urban areas as rural areas is treated as the reference category. Regions measure
the students belonging to different regions of the country, namely, south, north, east, west
and NES. In the analysis, the region south is treated as reference category (see Table I).
India has 36 states/UTs and each state/UT has a huge population size and large geographical
areas. The choice of course has region and state-specific influence because of the vast
variation in the nature of state economy, society, culture and inherent education systems.
In this direction, the variable regions as one of predictor is included in the model. South is a
reference category, as it depicts faster educational development compared to the rest of the
regions, more so among the market-oriented professional courses. It is in this context, one
needs to think south versus the rest of the regions in India. This is one of the few papers that
examine the regional variations in India in this fashion.
With regard to location, among the rural students, the most preferred course is
humanities, followed by engineering and other professional courses. Urban areas mirror
the preferences of rich quintile Q5 and marginal, small and medium family sizes. With
regard to regions, in the total sample, 40 percent belong to northern regions, followed by
22 percent from south. Among the North, the highest preferred course is humanities,
followed by other professional and engineering courses. In the NES and Eastern regions,
the first preferred course is humanities, followed by engineering and other professional
courses. In the West, the first preferred course is other professional courses, followed by
humanities and engineering. Whereas in the South, the top most preferred course is
engineering, followed by other professional and science courses. Including the variable
“Regions” becomes significant, as it depicts contrasting pattern in the enrollment
preferences. All factors considered here relate to demand side. Equally important are the
supply side factors, namely, access to and availability of seats in higher educational
institutions. The present paper does not focus on the supply side factors, as there is no
information directly available from the survey[8]. Nonetheless, the role of supply side
factors does play a role on subject choice.
5. Discussion
Table IV reports the marginal effects from estimating the MLR on the enrollment by
disciplinary choices relative to the base category, humanities. How these different factors
determine the probability of selecting different courses is examined by estimating the MLR.
The preliminary analysis such as correlation coefficient matrix indicates that there is no
multicollinearity among the selected variables (Table AI). The overall test of model in LR χ2
and its probability values are found to be satisfactory. As Cameron & Trivedi (p. 333) noted,
“a marginal effect, or partial effect, most often measures the effect on the conditional mean
of y of a change in one of the regressors, say Xk. In the linear regression model, the marginal
effect equals the relevant slope coefficient, greatly simplifying analysis. For nonlinear
models, this is no longer the case, leading to remarkably many different methods for
calculating marginal effects.” The marginal effect for categorical variables shows how
P(Y ¼ 1) changes as the categorical variable change from 0 to 1, after controlling in some
way for the other variables in the model[9]. The marginal effects are preferred in the present
paper, as they are the same as the slope coefficients and hence easy to interpret.
The proxy for expected earning is dropped from the model, as it did not report expected
results, It could be probably due to limitations in the data. The ability to speak another
language than the one spoken at home is more likely of choosing engineering with
humanities as the base category. This predictor is highly significant across all course
choices, albeit a declining probability of choosing other professional courses and science[10].
But this finding is contradictory to Jain (2016), who examined the impact of official language
policies using historical data. He found that linguistically mismatched districts have
18 percent lower literacy rates and 20 percent lower college graduation rates, driven by
difficulty in acquiring education due to a different mediums of instruction in schools.
It could be because in Jain’s study, literacy rates are analyzed with languages, whereas
the present study focusses on course choices in higher education. The ability to operate
computer increases with 13 percentage points, and the students are more likely to choose
the sciences courses, followed by 11 percentage points for other professional courses,
Academic
discipline
in higher
education
275
Table IV.
Results of the
determinants of
college major choice:
multinomial
regression
LANG_INSTU_HOME
ABLE_OPERATE_COMP ¼ 2
PRIVATE_COACHING
Lhhxed
Dummy
FREE_EDUCATION
-dotype_instn_2cate
-doGENDER_STUDENTS
ST/SC Base
OBC
Others
Islam Base
Christianity
Other Religions
Hinduism
Q1 Base
Q2
Q3
Q4
Q5
Dummy
Edn_hoh
Self-Employed
Salary earning
Base
Casual labor
Other labor
Marginal Base
Small
Medium
Large
Rural Base
Urban
South Base
West
East
NES
North
Constant
Pseudo R2
LR χ2 (124)
N
Notes: dy/dx for factor levels is the discrete change from the
Engineering
Other Prof
Science
0.0660*** (0.007)
2.9537*** (0.169)
−0.3195*** (0.013)
−0.0222* (0.011)
0.0029 (0.007)
−0.3496* (0.165)
0.1045*** (0.018)
0.1330*** (0.017)
0.0655*** (0.007)
0.9467*** (0.171)
−0.0574*** (0.012)
−0.0927*** (0.010)
0.0107*** (0.002)
3.4302*** (0.079)
0.2201*** (0.008)
−0.1098*** (0.007)
−0.0034 (0.008)
−0.2453 (0.180)
0.0285 (0.020)
0.0425** (0.015)
0.0169*** (0.004)
1.4241*** (0.105)
−0.0067 (0.010)
−0.0970*** (0.009)
−0.0400*** (0.004)
−0.1994* (0.094)
−0.0423*** (0.010)
−0.0557*** (0.008)
−0.0001 (0.006)
0.1651 (0.134)
−0.0383** (0.014)
0.0391*** (0.012)
−0.0069 (0.005)
−0.2044 (0.136)
0.0295* (0.014)
−0.0042 (0.012)
−0.0214* (0.010)
−1.1077*** (0.225)
−0.0043 (0.028)
0.0248 (0.023)
−0.0202* (0.010)
−1.3741*** (0.253)
−0.0686* (0.027)
−0.0010 (0.023)
−0.0206** (0.007)
−0.2559 (0.149)
−0.0584*** (0.016)
0.0326* (0.013)
0.0070 (0.006)
−0.0055 (0.191)
−0.0079 (0.019)
−0.0011 (0.017)
0.0068 (0.006)
0.1291 (0.188)
0.0118 (0.018)
−0.0218 (0.017)
0.0159** (0.006)
0.5176** (0.185)
−0.0234 (0.018)
−0.0457** (0.016)
0.0458*** (0.008)
1.3420*** (0.196)
0.0034 (0.019)
−0.1006*** (0.017)
0.0079 (0.004)
0.5149*** (0.105)
−0.0342** (0.011)
−0.0053 (0.009)
0.0059 (0.004)
0.0402 (0.107)
−0.0231* (0.011)
0.0077 (0.010)
−1.1946*** (0.214)
0.0237 (0.020)
−0.0060 (0.016)
−0.0154* (0.007)
−0.0017 (0.007)
0.1035 (0.185)
−0.0358 (0.019)
0.0652*** (0.018)
0.0121 (0.008)
0.6188* (0.285)
−0.0348 (0.028)
0.0279 (0.023)
0.0097 (0.009)
0.5105 (0.291)
−0.0494 (0.028)
0.0522* (0.023)
0.0243* (0.010)
0.8979** (0.305)
−0.0356 (0.030)
0.0282 (0.025)
−0.0252*** (0.004)
−0.3397*** (0.099)
0.0717*** (0.010)
−0.0033 (0.009)
0.0217*** (0.006)
−1.5936*** (0.166)
0.0313* (0.016)
−0.0498*** (0.013)
−0.0009 (0.007)
−2.4489*** (0.213)
0.0026 (0.019)
−0.0601*** (0.015)
0.0373*** (0.009)
−2.2271*** (0.181)
−0.0988*** (0.019)
0.0043 (0.017)
0.0016 (0.005)
−1.6760*** (0.154)
−0.0063 (0.014)
0.0313* (0.013)
−38.447*** (0.900)
−36.238*** (0.714)
−36.238*** (0.714)
−26.973*** (0.693)
0.3302
0.3302
0.3302
0.3302
16,763.35
16,763.35
16,763.35
16,763.35
17,235
17,235
17,235
17,235
base level. Estimates on standard error are in parentheses. *p o0.05; **p o0.01; ***p o0.001
Medicine
276
Dummy
-do-do-
Explanatory variables
JABES
26,2
whereas the same variable surprisingly shows that students are significantly less likely to
choose engineering course. The students attending any private coaching are more likely of
enrolling in engineering with a 95 percentage higher points, whereas the same tend to less
likely enroll in other professional and science courses[11]. Ability factors considered here
could probably capture the unobservable such as hard work or any other innate abilities.
The results indicate that the higher the ability (proxies[12]), more apparent will be the
preference for engineering. In other words, the more able students are crowded in
engineering courses.
The cost of education is proxied by the reported household expenditure on education for all
enrolled children by discipline. The log of this expenditure has more likelihood for engineering
courses, followed by other professional and medical courses. But the likelihood is significantly
less likely in science course by 11 percentage points. The results indicate that increasing the
cost of higher education by charging higher fees, as a method of generating resources, can
have serious welfare implication, especially for science courses, reporting 0.042 percentage
points, with students more likely choosing science courses than others. One main reason could
be that fees and other payments in any courses are higher in non-government institutions.
This is further shown that provision of free education improves the likelihood of enrolling
in science courses. Studying in government institutions increases the likelihood of enrolling in
engineering and medicine courses as well. This might be the case for students for high
preference to enroll in government intuitions for engineering and medical courses.
The likelihood of enrolling in engineering courses of female students (compared to male
and humanities) declines by 19 percentage points among engineering, declines by
5 percentage points among science courses and 4 percentage points in medicine and other
professional courses each. This is a serious concern, as the expected earnings or, in other
words, the economic returns to such courses are higher. This can have a bearing on the
economic freedom that would have accrued to women in future. Such gender disparity
begins at the higher secondary level. Sahoo and Klasen (2018) found that there is substantial
intra-household gender disparity in the choice of study stream at the higher secondary level
of education. They reported that girls are 20 percentage points less likely than boys to study
in technical streams as compared to arts or humanities.
Among the caste groups, keeping SC/ST and humanities as the base category, the
likelihood of OBC students is less likely by 4 percentage points of enrolling in other
professional courses, whereas the likelihood improves by 5 percentage points in science
courses. In the case of general category, the likelihood increases by 3 percentage points in
other professional courses. The non SC/ST students’ preference for other professional course
is lesser than the preference of SC/ST students. This indicates the preference over other skill
orientations, apart from the conventional professional courses of engineering, medicine and
sciences, is more among SC/ST students. This could be on account of the cost and time
duration (opportunity cost) of other professional courses that are lesser than the conventional
professional courses that normally range from a minimum four to six years in India.
With regard to religious group, keeping Islam and humanities as the base category, the
likelihood of enrolling is less likely by the Christian students in engineering and medicine
by 2 and 11 percentage points, respectively. With Hindu students, the likelihood declines by
2 percentage points in medicine and by 5 percentage points in other professional courses
(Table IV ). Hindu students, the majority student population, prefer engineering courses.
Expenditure groups or the level of living quintiles with the poorest quintile as the base
category is statistically insignificant at Q2 and Q3 across courses. Among Q4 quintiles, the
likelihood of enrolling in engineering and medicine courses is increased by 5 percentage points
and 1 percentage point, respectively. With regard to Q5 quintile, the same pattern continues;
however, the percentage point augments over quintiles. In other words, an incremental effect
is visible: the gap between Q4 and Q5 quintiles in medicine and engineering courses widens at
Academic
discipline
in higher
education
277
JABES
26,2
278
an increasing level. On the contrary, the likelihood declines by 5 percentage points in Q4 and
10 percentage points less likely in Q5 quintiles among science courses. Income inequity
widens in the case of medicine, engineering and science courses.
Similar to family economic status, parental education plays a crucial role in children’s
choice of subjects. Education of the head of the household with the base category of
elementary and below levels, the likelihood of enrolling in other professional courses
declines by 3 percentage points and improves by 5 percentage points in engineering. It is
noticed that as education level of head of family goes up, shift from non-technical to
technical courses is observed. This shows a considerable positive externality or spillover
effect by promoting greater educational achievements of the successive generations when
parents are better educated.
For occupation category with self-employed as the base category, the probability of
enrolling in other professional courses declines by 2 percentage points for the children of
salaried parents. For the children of casual labor families as compared to the self-employed
families, the increase in probabilities is 6 percentage points for choosing science courses
against humanities. Family size plays an important role in quantity quality trade off,
particularly at the school education, the choice between schooling and work, that is the higher
the family size, the lesser will be the chances for the children to continue schooling than
participating in work. For family size with marginal as the base category, the likelihood
increases by 6 percentage points among small, increases by 5 percentage points among
medium family size in science, and 3 percentage points more likely among large families
enrolling in medicine and 9 percentage points more likely among large families in engineering.
Location advantages or disadvantages of students for deciding the courses are mainly
because of better infrastructure, teacher quality, cost of education and the quality of peer
groups. The social and economic difference that we have in terms of rural/urban and
different regions of the country has inherent influence on the choice of courses. Rural as the
base category indicates probability by 2 percentage points less likely in enrolling in
medicine; and 3 percentage points less likely in engineering among urban students.
For other location characteristic regions, with South as reference category, the West
indicates that there is a likelihood of 2 percentage points that students will be more likely
enrolled in medicine and 3 percentage points that students will be more likely enrolled in
other professional courses, whereas the students are less likely to be enrolled in engineering
and science courses, whereas in Eastern region, the same less likely in engineering and
science courses continues. In the NES, the pattern is less likely found in engineering and
other professional courses but more likely in medicine courses. In the North, the probability
of enrolling in engineering is less likely. But the likelihood of enrolling in science courses
is 3 percentage points more likely in north.
The logit regressions reveal that for India, ceteris paribus, an individual residing in
South India has a significantly higher probability of attending engineering courses than an
individual from other regions of India. In order to understand the south and preference for
engineering phenomenon, an attempt is made to estimate the predicted average probabilities
of subject choice by regions[13]. The same has been pursued for knowing about the wealth
effect across course choices in the subsequent section.
5.1 Predicated probabilities
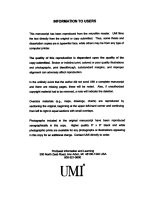
Figure 1 plots the predicted probabilities of subject choice by levels of living quintiles. The
probability of selecting humanities and medicine remain around the same till quintile Q4;
the choice of medicine surpasses humanities at quintile Q5. But the pattern between the
choice of humanities and medicines varies. The pattern is similar across medicine and
engineering; a clear shift can be seen as levels of living quintiles move from Q4 and Q5.
Parallel to this, the predicted probabilities of humanities and science depict the same
Academic
discipline
in higher
education
Adjusted Predictions of Subject Choice by Levels of Living with 95% CIs
0.5
Probability
0.4
0.3
279
0.2
0.1
0
Q1
Q2
Q3
Q4
Q5
LEVEL_LIVING
Medicine
Other Professional
Humanities
Engineering
Science
Source: Estimated based on the MNL regression
patterns but on the reverse (decline) as levels of living quintiles move from Q4 and Q5.
On the contrary, predicted probability of selecting other professional courses is highest
across quintiles. On similar lines, Geetha Rani (2015) lamented that professional courses,
namely medical and engineering not only have a long duration and high cost courses but
also they are also high paying degrees. This tilted allocation of talent indeed perpetuates the
inequality across life time earnings. This would result in imbalance in the course structure,
as able and talented students would opt for market-oriented courses than the conventional
courses, creating an imbalance. Further, these potential inefficiencies in the allocation of
talent could impede innovation at the top of the socio-economic pyramid. The analysis here
brings out the hierarchical preferences of courses across assorted expenditure levels of
families, which intend to generate earning inequality in the future.
A similar analysis is attempted to estimate the predicated probabilities of subject choices
across regions (Figure 2). In this figure, we try to answer the question as to what extent the
place of studying matters from where a student graduates. In other words, are students with
a degree from one of the institutions in the south are more likely to be choosing engineering
than any other subject choice as compared to other regions of India, north, east, west and
north east.
The predicted probabilities for medicine remain almost the same across regions. The
predicated probabilities of engineering are the highest in the South, followed by East, West,
North and the least in the NES regions. The average predicted probability of enrolling in
other professional courses is the highest across all regions, except NES. This pattern is
similar to the predicted probabilities of engineering courses, that is the predicated
probabilities are the highest in the south and least in the NES. Followed by South, the
highest probabilities of enrolling in other professional courses are found to be in West,
North and Eastern regions. Yet another interesting trend predicted is the probability of
enrolling in science almost remains the same across regions, except a lesser probability in
the Eastern region. The likelihood of enrolling in humanities is the highest in the NES,
followed by East, North, West and least predicted probability in the Southern regions.
This clearly brings out the preferences of technical and non-technical courses between
different regions. Why is it so? One of the reasons could be the growth of private
Figure 1.
Predicted average
probability of subject
choice by levels of
living quintiles
JABES
26,2
Adjusted Predictions of Subject Choice by Regions with 95% CIs
0.5
280
Probability
0.4
0.3
0.2
0.1
0
South
West
East
NES
North
REGION_INDIA
Figure 2.
Predicted average
probability of subject
choice by regions
Medicine
Other Professional
Humanities
Engineering
Science
Source: Estimated based on the MNL regression
institutions in few states accentuated after the adoption of the neo-liberal policies.
This period coincides with macro economic reforms in major policy changes at both macro
and sub-sectoral levels. These reform packages imposed decline on the public budgets on
education, more specifically on higher and technical education. These economic reforms
resulted in several policy directions, paved way for several alternatives, including rapid
expansion of the private sector in higher and technical education. Some states managed to
face these challenges and opportunities. It would be appropriate to quote the Perroux
(1950)[14]; he was one of the first who asserted that growth does not appear everywhere at
the same time and manifests itself in points or poles of growth. The enrolment patterns
across regions would further widen the regional disparity in terms of employment and
income generation. Policy implication is that initiatives are to be in place to promote
education, and employment in other regions is equally important, so that regional balance
is maintained and movement of labor, capital and trade is avoided from backward to
developed regions as development takes place.
6. Concluding remarks
In this section, we summarize the major findings, suggestions and policy implications.
The paper brings out interesting results, albeit there are few concerns. It can be said that
course choices are influenced by knowing another language that is different from the one
spoken at home, private coaching, cost of higher education, type of institution, gender,
better-off economic status, urban locations and regions. The consumption expenditure
quintiles reinforce the relationship between earnings and course of choices. The
dichotomy is clear between the choice of courses and expenditure or levels of living
quintiles in terms of technical and non-technical streams. This would further widen the
existing inequalities by adding yet another dimension of inequality. Although the choicebased credit system[15] makes an effort to reduce this divergence, it is not yet permeated
in the higher education system.
Gender polarization is very clear between humanities and engineering. The analysis of
choice of individual discipline reveals that female youths have significantly higher
likelihood of attending humanities courses as compared to their male counterpart. However,
for every other stream, that is, science, medicine, engineering and other professional courses,
there is a strong gender bias against female even after controlling for social and economic
background of the household. The same holds good with SC/ST, Islam, students belonging
to the poorest to middle expenditure quintiles Q1 through Q3, large family size and
education of the head of household with below elementary levels, whereas male, OBC, other
caste groups, Hindus, rich quintiles Q4 and Q5, marginal, small and medium family size and
education of head of the household with secondary and above levels prefer engineering
and other professional courses.
Predicted probabilities of course choices bring in a clear distinction between south and west
regions preferring engineering and other professional courses, whereas north, east and NES
prefer humanities. The findings of the paper suggest that course and regional imbalance needs
to be worked with multi-pronged strategies of providing both access to education and
employment opportunities in other states to maintain regional balance. However, the predicted
probabilities of medicine and science remain similar across the board. These findings bring in
implications for practice in their ability to predict the demand for course choices and their share
of demand, not only in the labor market but also across regions. Further, within the states, rural
and urban variation can have serious influence on choice of courses. In this direction, analysis at
state levels related to choice of courses can be further examined.
6.1 Agenda for future research
As noted earlier, very few studies on the determinants of field choice in higher education
prevail in India. It is primarily because of lack of such data. More in-depth surveys are
required to study the course choice problem in India, as the existing NSSO data inform only
the realized choice of courses but not the actual choice and whether actual choice is the same
as realized choice. Yet, another significant data gap in this area is the information on expected
earnings from taking up this course, the preparedness of students at the senior secondary
level, the institution type, quality of education at the school level, marks obtained at school
leaving board examination, etc. Hence, there is a need for sample surveys to include such
information in the collection of data. Equally important are the cost studies on higher
education, more specifically what is the relationship between cost of higher education across
courses and demand for student loans? This evidence is particularly important to know which
course choices can support student loans. Is demand for student loans higher as cost of
higher education is increasing? Does it vary between public and private institutions of higher
education and its relationship with course choices? What is the relationship between course
choices and the demand for skills and skill content in the labor market? What is the match or
mismatch between skill content of courses and their choices with regard to the demand for
skills in the labor market? On the distributional aspect, a number of research questions arise:
how course choices either maintain the status quo or how they have helped in the
redistribution and social mobility among students? How do they widen the earning inequality,
is there any inter-generational mobility across course choices? How similar professions are
flocked or sorted together in terms of marital relationship?
Notes
1. Separating the effects of wages on career choices versus career choices on wages is a challenging
task, owing to basic identification issues with regard to not only quantity and price but also the
ex ante and ex post realization of both quantity and price (Freeman and Hirsch, 2008).
2. These individual characteristics determine how much students enjoy their coursework and how
much time and effort they invest towards their degree.
Academic
discipline
in higher
education
281
JABES
26,2
3. Course choice here refers to the realized course choice of the students.
4. Not relating to India.
5. Borrowing rate or interest rate compared between ex post or realized returns to college on the
probability of various post-secondary college outcomes and the ex ante or expected return to
starting college.
282
6. The Indian way of saying a major is course. Hereafter, major is referred as course.
7. Studies generally use SAT scores or grade points, but there is hardly any information available
on the innate or acquired ability of students like marks obtained, etc., in these survey data.
8. One way may be to calculate a ratio of capacity/college going population in each district/state and
controlling the same. This can be further examined with district and or state fixed effects, which
will be the future area of work for the authors.
9. In other words, with a dichotomous independent variable, the marginal effect is the difference in
the adjusted predictions for the two groups.
10. Only the statistically significant parameters are discussed.
11. It can be argued that one of the determinants, not taking private coaching, which may perhaps
mean that the child has more help at home, may be because parents are able to help or the child
has better ability, for which there is no information available. However, it may also mean that the
child has less ability, so parents do not want to invest on him/her, or parents have less ability to
offer extra support or the child not interested in studies. It can be argued that although taking
private tuition is an indicator of economic conditions, the rationale to include it under ability is
because taking private tuition is expected to enhance the quality of learning of the students. But,
the purpose of taking private tuition is unknown, as this information is unavailable. Hence, the
channels could not be explored further. Since this information is not available, there could be
reverse causality when one looks at the relationship between subject choice and spending on
private tuition, because choosing science subject perhaps mean students need to spend more on
private tuition as compared to humanities. However, the underlying reasons are unobservable.
12. Ability to operate computers.
13. The prediction of outcomes on the basis of current characteristics is possible without regard to
the causal relationships among variables (Constantine, 2012). Although it can be argued
that these interpretations are merely association, one cannot ignore that potential power and
added complexity of regression analysis are best reserved for either predicting outcomes or
explaining relationships.
14. One of his main contribution was the concept of poles de croissance or “growth poles.” It implied
that Government policies aimed at the regeneration of a specific local region were critically
dependent upon the input‒output linkages associated with the industry. It uncovers regional
inequalities and focuses the direction on propulsive and propelled units. Further, it offers a
dynamic image of the regions, which is invariably based on a general tendency to spatial focus of
manufacturing facilities; and it presents a basis for an alternative for centralization by supporting
the creation of new development poles, namely, the decentralized focus.
15. The most important recommendation of the Yashpal Committee (Government of India, 2009).
References
AIHSE (2017), All India Higher Education Survey, Ministry of Human Resource Development,
New Delhi.
Altonji, J.G. (1993), “The demand for and return to education when education outcomes are uncertain”,
Journal of Labor Economic, Vol. 11 No. 1, pp. 48-83.
Arcidiacono, P.V., Hotz, J. and Kang, S. (2010), “Modeling college major choices using elicited measures
of expectations and counterfactuals”, NBER Working Paper No. 15729, MA.
Azam, M., Chin, A. and Prakash, N. (2011), “The returns to English language skills in India”, available at:
www.uh.edu/~achin/research/azam_chin_prakash.pdf (accessed August 25, 2013).
Becker, S.G. (1975), Human Capital: A Theoretical and Empirical Analysis, The University of Chicago
Press, Chicago, IL.
Berger, M.C. (1988), “Predicted future earnings and choice of college major”, Industrial and Labor
Relations Review, Vol. 41 No. 3, pp. 418-429.
Chakrabarti, A. (2009), “Determinants of participation in higher education and choice of disciplines:
evidence from Urban and Rural Indian Youth”, South Asia Economic Journal, Vol. 10 No. 2,
pp. 371-402.
Constantine, N.A. (2012), “Regression analysis and causal inference: cause for concern?”, Perspectives
on Sexual and Reproductive Health, Vol. 44 No. 2, pp. 134-137.
Desai, S., Dubey, A. and Vanneman, R. (2015), India Human Development Survey-II (IHDS-II),
University of Maryland and National Council of Applied Economic Research, New Delhi.
Freeman, J.A. and Hirsch, B.T. (2008), “College majors and the knowledge content of jobs”, Economics
of Education Review, Vol. 27 No. 2008, pp. 517-535.
Geetha Rani, P. (2015), “Interstate disparities in interest subsidies on education loans in India; why and
how does it persist?”, University News, Vol. 53 No. 48, pp. 74-85.
Government of India (2009), “Report of ‘the committee to advise on renovation and rejuvenation of
higher education”, Ministry of Human Resource Development, New Delhi.
Government of India (2015), “Key indicator of social consumption in India: education”, National Sample
Survey Office, Ministry of Statistics and Programme Implementation, January-June 2014.
Heckman, J. and Mosso, S. (2014), “The economics of human development and social mobility”,
Working Paper No. 19925, National Bureau of Economic Research.
Jain, T. (2016), “Common tongue: the impact of language on educational outcomes”, Indian School of
Business WP ISB-WP/103/2011, November 30, available at: />or (accessed April 14, 2017).
Long, M.C., Goldhaber, D. and Huntington-Klein, N. (2015), “Do completed college majors respond to
changes in wages?”, Economics of Education Review, Vol. 49 No. C, pp. 1-14.
Mincer, J. (1974), Schooling, Experience and Earnings, National Bureau of Economic Research,
New York, NY.
Montmarquette, C., Cannings, K. and Mahseredjian, S. (2002), “How do young people choose college
majors?”, Economics of Education Review, Vol. 21 No. 6, pp. 543-556.
Paglin, M. and Rufolo, A.M. (1990), “Heterogeneous human capital, occupational choice, and male-female
earnings differences”, Journal of Labor Economics, Vol. 8 No. 1, pp. 123-144.
Perroux, F. (1950), “Economic space: theory and applications”, Quarterly Journal of Economics, Vol. 64,
pp. 90-97.
Sahoo, S. and Klasen, S. (2018), “Gender segregation in education and its implications for labour market
outcomes: evidence from India”, IZA Discussion Paper No. 11660, Institute for the Study of
Labor (IZA), Bonn.
Schultz, T.W. (1961), “Investment in human capital”, American Economic Review, Vol. LI No. 1, pp. 1-17.
Turner, S. E. and Bowen, W.G. (1999), “Choice of major: the changing (unchanging) gender gap”,
Industrial and Labor Relations Review, Vol. 52 No. 2, pp. 289-313.
Further reading
Cameron, A.C. and Trivedi, P.K. (2010), Revised Edition, STATA Press, College Station.
Academic
discipline
in higher
education
283
Table AI.
Correlation matrix of
dependent variable
and selected
predictors
Choice
1
Earning
−0.377* 1
Language −0.471* 0.260*
1
computer
0.323* −0.181* −0.2871*
1
Pvt_Coac −0.076* 0.013
0.0431* −0.0018
hhxedn
−0.585* 0.421*
0.3626* −0.2403*
Free_Edn
0.128* −0.058* −0.0425*
0.1030*
type_instn −0.294* 0.008
0.1738* −0.1149*
Gender
−0.143* 0.059*
0.0740* −0.1116*
social_gp −0.064* 0.073*
0.0437* −0.1053*
Religion4 −0.032* −0.011 −0.1318* −0.0171*
level_livi −0.306* 0.176*
0.2807* −0.3009*
Occupatio −0.023* 0.016*
0.0558* −0.0398*
family_si
0.158* −0.070* −0.1569*
0.1409*
Edn_hoh −0.144* 0.107*
0.1271* −0.1317*
Sector
−0.103* 0.095*
0.1356* −0.1772*
Regions
0.177* −0.043* −0.2015*
0.1488*
Note: *Statistically significant at 95 percent level
hhxedn
1
0.0540*
1
−0.0279* −0.075*
0.1124*
0.1696*
−0.0303*
0.0860*
−0.0909*
0.0572*
−0.0291*
0.0131
−0.0204*
0.2027*
0.0114
0.0406*
0.0065 −0.111*
−0.0303*
0.0718*
−0.0496*
0.0664*
−0.0796* −0.109*
Earning Language Compute Pvt_Co~h
1
−0.1831*
1
−0.0245*
0.0535*
−0.0773*
0.0123
−0.0475*
0.0383*
−0.0975*
0.1394*
0.0184* −0.0035
0.0228* −0.050*
−0.0825*
0.029*
−0.0497*
0.009
0.0186* −0.128*
social~p
1
−0.0004 1
0.0112 0.0216*
0.0003 0.2045*
−0.0091 −0.047*
−0.064* −0.084*
−0.0113 0.191*
−0.062* 0.151*
0.021* 0.097*
Free_Edn type_i~e Gender
1
0.0398* 1
−0.0354* 0.1067*
1
−0.1100* −0.3707* −0.2062*
1
0.0386* 0.3294*
0.0735* −0.1328*
−0.0297* 0.3424*
0.1389* −0.1330*
−0.0450* −0.0651* −0.0359*
0.2137*
1
0.2370*
0.1327*
Religi~4 level_~g occupa~n family~e Edn_hoh
Sector
1
−0.0161*
284
Choice
1
Regions
JABES
26,2
Appendix
About the authors
Dr Geetha Rani Prakasam is Professor at National Institute of Educational Planning and
Administration (NIEPA), New Delhi. She was the Professor and Head, Department of Economics,
Central University of Tamil Nadu on Deputation from NIEPA. She has contributed to the financial
memorandum for Right to Education Bill under Central Advisory Board on Education (CABE), the
highest advisory body to advise the Central and State Governments in the field of education,
constituted by the Ministry of Human Resources Development (MHRD) and the financial implications
of national and state wise estimates of Right to Education (RTE) Act, submitted to the 13th Finance
Commission. Her core competencies include research, teaching, training and consultancy in the area of
Economics and financing of education. She has been organizing the training programs on school
finances and higher education finances for more than a decade at NIEPA. She co-edited a volume on
Right to Education in India published by Routledge, UK. She has published more than 60 research
papers in the area of Development Economics and Economics and Financing of Education. She teaches
courses such as Educational Planning and Economics and Financing of Education at the University.
Dr Geetha Rani Prakasam is the corresponding author and can be contacted at:
Mukesh is Joint Director, Department of Fisheries, Ministry of Fisheries, Animal Husbandry &
Dairying, Government of India and belongs to the Indian Statistical Service 2007 batch. As a statistician
with nearly 12 years of experience, he specializes in handling large scale data, analysis and application of
econometric methods for policy formulation. He completed his MSc (Statistics) from the University of Delhi
and BSc in Statistics from Banaras Hindu University. He is a notable research scholar who has published
40 papers in diverse areas of Agriculture, Poverty, Consumer Expenditure, Health, Inequality, Price,
Income, Women and Gender, Education, Employment-Unemployment, Rural development, Food Security,
Water and Sanitation in renowned journals.
Gopinathan R. received a Doctoral Degree from the Department of Economics, Pondicherry
University. His area of specialization is Financial Economics, Development Economics and Applied
Econometrics. He has worked as Faculty Member in the Department of Economics at Central
University of Rajasthan and Central University of Tamil Nadu. Gopinathan has also worked in S&P
Global GRA CRISIL India. He has presented research papers at various National and International
Conferences and has published research papers in academic journals. He is currently Assistant
Professor in School of Economics, Shri Mata Vaishno Devi University, Jammu & Kashmir, India.
For instructions on how to order reprints of this article, please visit our website:
www.emeraldgrouppublishing.com/licensing/reprints.htm
Or contact us for further details:
Academic
discipline
in higher
education
285