Employee performance motivation and performance management system-exploring the pertinence
Bạn đang xem bản rút gọn của tài liệu. Xem và tải ngay bản đầy đủ của tài liệu tại đây (441.08 KB, 8 trang )
International Journal of Management (IJM)
Volume 11, Issue 3, March 2020, pp. 8–15, Article ID: IJM_11_03_002
Available online at />Journal Impact Factor (2020): 10.1471 (Calculated by GISI) www.jifactor.com
ISSN Print: 0976-6502 and ISSN Online: 0976-6510
© IAEME Publication
Scopus Indexed
EMPLOYEE PERFORMANCE MOTIVATION
AND PERFORMANCE MANAGEMENT
SYSTEM-EXPLORING THE PERTINENCE
Prof. Anant Deogaonkar*
Assistant Professor, Shri Ramdeobaba College of Engineering & Management,
PhD Scholar, Parul University, Vadodara, India
Dr. Bijal Zaveri
Dean, Faculty of Management Studies, Parul University, Vadodara, India
Dr. Chandan Vichoray
Head, Department of Management Technology,
Shri Ramdeobaba College of Engineering and Management, India
*Corresponding Author Email:
ABSTRACT
People are intellectual assets and the success of any organization depends
largely on how the people are valued. Performance management system is the very
manifestation of the effective intellectual asset management in the organization .The
purpose of this article is to understand the performance management system and its
relationship with employee performance motivation. This study is based on research
data of 416 working professionals from telecommunication companies in India. We
propose a new three step model indicating the interrelationships of the two
components of the performance management system viz. Design and Execution
identified as latent classes responsible for the employee motivation to perform
because of performance management system. The relationship is tested with the
research hypotheses on these classes using multinomial logistics regression.
Keywords: Performance management system; employee; motivation.
Cite this Article: Anant Deogaonkar, Dr. Bijal Zaveri and Dr. Chandan Vichoray,
Employee Performance Motivation and Performance Management System-Exploring
the Pertinence, International Journal of Management (IJM), 11 (3), 2020,pp. 8–15.
/>
1. INTRODUCTION AND BACKGROUND
As per the research report of Indian brand equity foundation (Ministry of commerce &
Industry, Government of India 2018 December), India is currently the world’s second-largest
/>
8
Anant Deogaonkar, Dr. Bijal Zaveri and Dr. Chandan Vichoray
telecommunications market with a subscriber base of 1.17 billion and has registered
strong growth in the past decade and half. The liberal and reformist policies of the
Government of India have been instrumental along with strong consumer demand in the
rapid growth in the Indian telecom sector. The deregulation of Foreign Direct Investment
(FDI) norms has made the sector one of the fastest growing and a top five employment
opportunity generator in the country. This is an imperative to device a robust mechanism of
employee performance measurement and management mechanism to ensure motivating
reward, award and recognition system in place. Periodic reviews by the immediate
supervisor are not just enough. Informal interactions between the employee and supervisor
related to performance excellence indicate more positive outcomes as compared to formal
appraisal process (Koen & Hans 2013). The organizational compensation survey by KPMG
focused on innovative performance management systems to be the key area being worked by
the corporate.(KPMG 2017-18).There is a need to exactly understand how the employee
perceives the performance management mechanism and what are the expected inclusions to
be incorporated in the performance management system to make it a motivating force for
employee performance excellence. The institutes for corporate productivity researches also
have negative findings about the performance management system. A lot many survey have
been conducted to understand the effectiveness of performance management system in
corporate but there is always a possibility of some indications underlying the responses
given by the employees towards the performance management system to be considered as
motivating force for performance. To identify such latent factors this research data is
collected using survey method with the help of a structured undisguised questionnaire.
2. RESEARCH DESIGN
This study is based on research data of 416 working professionals from telecommunication
companies in India. We propose a three step model indicating the interrelationships between
design of PMS, execution of PMS and employee motivation to perform. The responses
obtained on five-point Likert scale for design, execution and motivation related questions
were summarized in terms of numbers and percentage.
In order to classify respondents based on their responses to questions in each category,
Latent class analysis was performed. This analysis was carried out independently for design,
execution and motivation related questions to group respondents based on their responses.
Latent Class Analysis i s a technique for the analysis of clustering of observations in
multiway tables of categorical variables. The central idea it to fit the model in which any
confounding between the manifest variable can be explained by a single unobserved “latent”
categorical variable. The analysis was performed using R-library poLCA, which uses the
assumption of local independence to estimate a mixed model of latent multi-way tables
and the number of nclass. A sequence of models with 1 group to 6 groups were generated
and the parameters like BIC, AIC and likelihood were obtained. The group with minimum
BIC value was considered to provide the best classification of respondents. After deciding the
number of clusters, the membership for each respondent was obtained, thereby classifying
each respondent to one of the clusters. Such analysis was performed for all the three
categories viz.,design, execution and motivation.
The main objective of study was to develop a model specifying the relationship of
motivation of employees and the design and execution of performance management
system. In other words, how the design of Performance Management System and its
execution by supervisors influence the motivation level of employees. By using Latent Class
Analysis, from design perspective, the respondents were grouped into three classes viz.,
Rational, Somewhat rational and Weak design. Similarly, based on execution related
/>
9
Employee Performance Motivation and Performance Management System-Exploring the Pertinence
responses, they were grouped into Good execution, Fair execution and Poor execution.
Also, the motivation related questions were used to classify them into highly motivated,
moderately motivated and non-motivated. The motivation variable was treated as
dependent, while design and execution were referred as independents. Since, the motivation is
an ordered variable, to determine its relatedness with the independents, ordinal logistic
regression was used. However, due to violation of assumption of proportional odds, the
dependent variable was treated as nominal and accordingly, multinomial logistic
regression analysis was performed. The independent variables were coded with dummy
variables and thus the coefficients were obtained with reference to their respective lowest
level. The analysis was performed using SPSS ver 20.0 (IBM Corp Armonk, USA). The
statistical significance was evaluated at 5% level.
3. DATA ANALYSIS AND INTERPRETATION
The questionnaire quality, reliability is supported by the statistical measure –Cronbach’s
alpha value of more than 0.8 .Table 1 provides the reliability statistics of the questionnaire
administered during pilot study on 40 respondents.
Table 02 provides the latent class analysis for question related to design of PMS. Baysian
Information Content (BIC) criterion was referred, which indicated a minimum value of
5997.57 corresponding to model 3. Thus, the respondents were classified into three clusters.
Table 03 provides the latent class analysis for question related to execution of PMS.
Baysian Information Content (BIC) criterion was referred, which indicated a minimum value
of 3966.45 corresponding to model 3. Thus, the respondents were classified into three
clusters.
Table 04 provides the latent class analysis for question related to motivation. Again
referring to BIC criterion, the minimum was observed for model 3 (3.447.62) suggesting
three clusters of respondents. Accordingly, they were partitioned into three groups based
on motivation related questions.
In order to determine the effect of design and execution of PMS on the motivation levels
of the employees, multivariate modeling approach was followed. Each employee was
assigned a cluster membership with reference to design, execution and motivation. Thus, the
analysis data set consisted of design variable at three levels (clusters), execution at three
levels and motivation also at three levels. The first two variables were treated as independent
and motivation was regarded as dependent. Further, years of experience were included in the
analysis as independent covariate and designation as dichotomous variable.
Since, the dependent variable (motivation) has three levels in the ordered manner, ordinal
logistic regression was the right choice to determine the relationship between motivation and
independent predictors. However, the assumption of proportional odds was violated using
the data set, hence, the dependent was treated as multinomial and accordingly the
multinomial logistic regression was performed. The result obtained following this analysis is
shown in Table 05.
During analysis, low motivation was regarded as reference level and the effect of
changing the design and execution levels on high and moderate motivation was
determined. Further, for design variable, weak design was treated as reference, while for
execution; poor execution was treated as reference.
The three classes obtained in case of the PMS design and the PMS execution forms the
basis for understanding how the employee motivation to perform varies as per the design and
execution of the PMS. The overall performance management system though has an impact on
employee motivation, it is imperative to study the independent impact of the design and
/>
10
Anant Deogaonkar, Dr. Bijal Zaveri and Dr. Chandan Vichoray
execution respectively. With this, we will be able to derive action plan for enhancement in
employee performance motivation related to performance management system. Hence the
hypotheses to explore this relationship based on the latent classes obtained is as below:
3.1. Hypotheses
H0:- PMS Design level and PMS execution level has no impact on employee motivation level
HA:- PMS Design level and PMS execution level has impact on employee motivation level
Table 05 shows that for highly motivated level, the coefficient for design-1 (Rational
design) was 3.756 (SE: 1.111) and corresponding p-value of 0.001, while for design-2
(Somewhat rational design), the coefficient was 1.631 (SE: 1.179) and p-value was 0.166. In
other words, this indicates that the odds of getting highly motivated if the design changes
from weak structure to a rational structure are 42.77 [95% CI: 4.846 – 377.58] as compared to
low level of motivation. This effect was statistically significant (p=0.001). Further, the odds
of getting highly motivated if the design changes from weak structure to somewhat rational
structure are 5.11 [95% CI: 0.507 – 51.507], as compared to low level of motivation, although
the effect was statistically insignificant (p=0.166). The effects were obtained after adjusting
with experience, treated as covariate in the model.
The coefficient for execution-1 (Good execution) was 5.145 (SE: 1.387) and p-value <
0.0001, while for execution-2 (moderate execution), the coefficient was 2.723 (SE: 1.132)
and p-value of 0.016. This revealed that the odds of employee getting highly motivated when
the execution changes from poor to good are 171.63 [95% CI: 11.332 – 2599.612] times
higher as compared to low motivation level. Further, the odds of employee getting highly
motivated when the execution changes from poor to moderate are 15.229 [95% CI: 1.655 –
140.101] times higher with reference to low motivation level. Both these effects were
statistically significant (p < 0.05).
On similar lines, for moderately motivated level, the coefficient for design and execution
levels were obtained as shown in Table. For design-1 (Rational design), the coefficient
obtained was 4.661 (SE: 1.221) and p-value < 0.0001, while for design-2 (Somewhat rational
design), the coefficient was 3.344 (SE: 1.26) and p-value of 0.008. In terms of odds, the
likelihood of employee getting moderately motivated when the design changes from weak
level to rational level is 105.71 [95% CI: 9.652 – 1157.87] times as compared to low
motivation level. The odds of getting moderately motivated when the design changes from
weak level to somewhat rational level are 28.34 [95% CI: 2.398 – 335.089] times as
compared to low motivation level. Similarly, the effect of execution was studied on the
change in motivation level. The change from poor execution to good execution of PMS
increases the likelihood of moderate motivation by 283.68 [95% CI: 11.981 – 6717.07] times
as compared low motivation. This effect was statistically significant with p-value < 0.0001.
While, change from poor execution to fair execution of PMS increases the likelihood of
moderate motivation by 46.6 [95% CI: 3.351 –
648.061] times as compared to low motivation level. This effect was also statistically
significant with p-value of 0.004.It is evident from the table that likelihood of achieving
moderate motivation as compared to high motivation is more when the design changes from
weak level to either rational or somewhat rational level. This is indicated by the magnitude of
ORs corresponding to high and moderate m o t i v a t i o n l e v e l s f o r d e s i g n . Similarly,
the likelihood of achieving moderate motivation as compared to high motivation is more
when the execution changes from poor level to either good to fair level. Again this is
indicated by the magnitude of ORs corresponding to high and moderate motivation levels
for execution.
/>
11
Employee Performance Motivation and Performance Management System-Exploring the Pertinence
4. DISCUSSION
The data analysis revealed that the performance management system has important role in
contributing towards employee motivation to perform. The study specifically indicates that if
the companies target to enhance motivation of employees with the performance management
system then it is the execution of the PMS that catches immediate attention. The execution of
the PMS if improved from poor to good or even from fair to good the employee motivation
drastically improves from moderate to high. The way of execution of PMS points towards the
interactions between the employee and the supervisors. Employee motivation is adversely
impacted by pragmatic communication of numbers and measured performance on forced
scale. The study implies reinventing the performance management system to be a real time
feedback system to support employee for growth and development. The design of
performance management system is mostly referred as the means to capture the quantified
performances which is routine activity and hence has less impact on employee motivation.
But the improvement in execution in turn may demand the design also to change, questioning
that “do the companies continue with the existing PMS system? “The research here answers
as “NO”. The companies will need to consider contemporary issues related to employee
satisfaction, stress levels, employee psychological factors as well to come up with totally new
model of performance management system.
5. CONCLUSION
The study indicates that the proposed model based on design, execution and employee
motivation is validated by the statistical analysis. The three step model here assists the
companies to extract the exact pain area to be addressed with respect to PMS to enhance
employee motivation to perform. The PMS design and the way it is executed need to be
reframed with the inputs from the employees. Employee wants a simple, easy to understand
and execute and real-time feedback mechanism of PMS. People are intellectual assets and are
more concerned with the execution of performance management system i.e. the design of the
performance management seems to be fair. This is because the design of performance
management system aims at providing a tool for measuring and documenting the performance
against the targets which is inevitable. Employees are aware about the design of PMS being
done at strategic level and their immediate supervisors have hardly any role to play in
designing the system.
The employee performance is impacted by the way of execution of the performance
management system .This is because the execution process involves manual interaction with
the supervisors, discussion with supervisor about the performance demonstrated by the
employee. It also involves inclusion of the facts and figures and ground reality to be captured
in the system.
Table 1 Reliability Statistics
Cronbach's Alpha
.823
/>
Cronbach's Alpha
Based on
Standardized Items
.812
12
N of Items
40
Anant Deogaonkar, Dr. Bijal Zaveri and Dr. Chandan Vichoray
Table 2 Latent Class Analysis for questions related to design of PMS
1
2
3
4
5
6
Model
Model 1
Model 2
Model 3
Model 4
Model 5
Model 6
Log-likelihood
-3374.417181
-2632.050992
-2413.812944
-2329.213185
-2280.525306
-2230.693666
Residual DF
352
287
222
157
92
27
BIC
7134.798219
6042.060382
5997.578829
6220.373851
6514.992636
6807.323898
aBIC
6931.709729
5632.710145
5381.966844
5398.500118
5486.857155
5572.926669
cAIC
7198.798219
6171.060382
6191.578829
6479.373851
6838.992636
7196.323898
Likelihood-ratio
3623.585656
2157.289512
1719.814234
1566.075744
1463.30843
1371.229835
Table 3 Latent Class Analysis for questions related to execution of PMS
1
2
3
4
5
6
Model
Modell 1
Modell 2
Modell 3
Modell 4
Modell 5
Modell 6
Log-likelihood
-2036.86148
-1806.816192
-1687.721966
-1623.705928
-1599.753309
-1578.600034
Residual DF
384
351
318
285
252
219
BIC
4266.704887
4005.626927
3966.451088
4037.431626
4188.539002
4345.245064
aBIC
4165.160642
3799.365179
3655.471837
3621.734873
3668.124746
3720.113306
cAIC
4298.704887
4070.626927
4064.451088
4168.431626
4352.539002
4542.245064
Likelihood-Ratio
1277.686194
818.4896499
581.3381218
453.3814771
405.5104565
362.1717127
Table 4 Latent Class Analysis for questions related to motivation due to PMS
1
2
3
4
5
6
Model
Model 1
Model 2
Model 3
Model 4
Model 5
Model 6
Log-likelihood
-1771.809539
-1607.954408
-1536.86118
-1512.469186
-1496.578569
-1485.804169
Residual DF
396
375
354
333
312
291
BIC
3664.232784
3463.166913
3447.624846
3525.485249
3620.348405
3725.443995
aBIC
3600.767631
3333.063349
3250.882871
3262.104863
3290.329608
3328.786788
cAIC
3684.232784
3504.166913
3509.624846
3608.485249
3724.348405
3850.443995
Likelihood-ratio
702.3885624
374.6783003
232.4918434
183.7078556
151.9266211
130.3778209
Table 5 Effect of PMS design and execution on motivation of employee using multinomial logistic
regression.
Parameter Estimates
Motivated
Highly
Motivated
Moderately
Motivated
Intercept
Experience
[Design=1]
[Design=2]
[Design=3]
[Execution=1]
[Execution=2]
[Execution=3]
[Designation=1]
[Designation=2]
Intercept
Experience
[Design=1]
[Design=2]
[Design=3]
[Execution=1]
[Execution=2]
[Execution=3]
[Designation=1]
[Designation=2]
95% CI OR
Lower
Upper
Bound
Bound
B
SE
Wald
DF
P-value
OR
-1.521
-0.152
3.756
1.631
Ref
5.145
2.723
Ref
0.117
Ref
-4.112
-0.052
4.661
3.344
Ref
5.648
3.842
Ref
-0.717
Ref
1.455
0.091
1.111
1.179
1.092
2.799
11.426
1.916
1
1
1
1
0.296
0.094
0.001
0.166
.859
42.774
5.111
0.719
4.846
0.507
1.026
377.580
51.507
1.387
1.132
13.769
5.785
1
1
<0.0001
0.016
171.634
15.229
11.332
1.655
2599.612
140.101
1.093
0.011
0.915
1.124
0.132
9.574
1.778
0.090
1.221
1.260
5.345
0.336
14.565
7.043
1
0
1
1
1
1
0.021
0.562
<0.0001
0.008
.949
105.715
28.345
0.796
9.652
2.398
1.132
1157.869
335.089
1.615
1.343
12.236
8.181
1
1
<0.0001
0.004
283.689
46.600
11.981
3.351
6717.072
648.061
1.101
.424
1
0.515
.488
0.056
4.222
Ref: Reference level; B: Estimated coefficient; SE: Standard error; Wald: Wald’s test statistics; DF: Degrees of
freedom; OR: Odds ratio
/>
13
Employee Performance Motivation and Performance Management System-Exploring the Pertinence
REFERENCES
[1]
”Performance management effectiveness: lessons from world-leading firms”, The
International Journal of Human Resource Management, Vol. 22, No. 6, March 2011,
1294–1311, Routledge Taylor & Francis
[2]
“Linking Belgian employee performance management system characteristics with
performance management system effectiveness: exploring the mediating role of fairness”,
The International Journal of Human Resource Management, Vol. 24, No. 4, February
2013, 806–825, Routledge Taylor & Francis
[3]
“Human resource management and performance: a review and research agenda,” The
International Journal of Human Resource Management, Vol. 8, No.3, February 2011,
263–276, Routledge Taylor & Francis
[4]
“Performance Management –Laudable Objectives, Limited Usage, Lowered Expectations”
Public Performance and Management Review, Vol. 35, No.2, December 2014, 370–389,
Routledge Taylor & Francis
[5]
“Better Performance Management- Some Single-and Double Loop Strategies” Public
Performance and Management Review, Vol. 34, No.2, December 2014, 420–433,
Routledge Taylor & Francis, Wouter Van Dooren
[6]
“Organizational Culture and the Paradox of Performance Management,” Public
Performance and Management Review, Vol. 38, No.1, December 2014, 07–22, Routledge
Taylor & Francis, Jeannette Taylor
[7]
“Performance Management Effectiveness, Practices or Context”, The International
Journal of Human Resource Management, Vol. 23, No. 6, July 2011, 1158–1175,
Routledge Taylor & Francis ,Victor Y Haines III
[8]
Measuring employee perception of performance management system effectiveness:
Conceptualization and scale development”, Employee Relations, Volume 38, Issue 2, 224247. Emrald Publishing, Neha Paliwal
[9]
Adams, J.S. “Inequity in social exchange”, in Berkowitz, L. (Ed.), Advances in
Experimental Social Psychology , Vol. 2, Academic Press, New York, NY, 1965, pp. 267299. [Google Scholar]
[10]
Aiken, L. and Marnat, G.G., Psychological Testing and Assessment, Pearson Education,
New Delhi. 2009 [Google Scholar]
[11]
Dr. Nirzar Kulkarni. A Study on Relationship between Employee Performance with High
Performance HR System in Automobile Industry of Nagpur. Journal of Management,
4(2), 2017, pp. 74–80
[12]
P. Bhuwaneshwari and Dr. M.B. Roopa, The Relationship between Job Resources and
Employee Performance -The Mediating Role of Employee Engagement in Private Health
Insurance Company. Journal of Management, 5(4), 2018, pp. 18–26
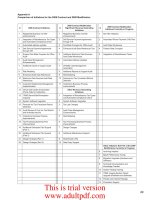
QUESTIONS
Sr.No
1
2
3
4
5
6
7
QUESTION
Managers are held accountable for doing effective appraisals.
I know how. my performance impacts the organization
High levels of performance are recognized and rewarded.
PMS system is designed for input from all levels in the organization.
The system measures the overall performance correctly.
The system measures the results against the expected results
The system measures both, the results and how they are achieved.
/>
14
Response(1-5)
Anant Deogaonkar, Dr. Bijal Zaveri and Dr. Chandan Vichoray
8
9
10
11
12
13
14
15
16
17
18
19
20
21
22
23
24
25
26
27
28
29
30
31
32
33
34
A
B
C
D
E
F
G
The PMS system is fair.
The system is legally defensible.
The appraisal process is simple and quick to do.
Managers view the appraisal as a valuable management tool.
The system supports developmental opportunities.
Ratings are accurate and reflect actual performance.
Managers are timely in doing appraisals.
Performers who need improvement are given developmental
opportunities.
Performance problems are dealt with quickly and consistently.
Managers treat the process as on-going versus once a year.
Employees know what is expected of them at all times.
Managers are rated on how well they do appraisals.
Performance Standards are consistent across the organization.
Training in conducting effective evaluations is provided to appraisers
Training in the performance appraisal process is provided to
employees.
Performance Appraisal meetings are meaningful and productive.
There is an appeals process in place if the employee has disagreement
with the appraisal ratings.
Ratings are based on actual performance and not on personal feelings.
The performance Evaluation states what the employee “should be”
doing versus “not” doing.
My Performance rating in previous year gives me high motivation to
perform this year also
The performance Management system motivates me for better
performance and growth opportunities.
I feel that my performance rating has direct impact on my present
performance level
I am aware of the recent trends in performance management system in
telecom sector
I feel that performance appraisal should be conducted more
frequently.
The PMS implementation is aligned with the latest trends in Indian
Telecom Sector
The appraisal process helps me to identify the area of improvement
My Performance is improving because of the following factors to a
large extent : (rate each factor on scale of 1 to 5)
Technology up gradations in Telecommunication sector
Promotion Policy ,Salary Rise and other financial benefits offered by
the company
Performance Management System in the company
Peer Pressure
Non-financial benefits such as rewards/awards/recognition in the
company
Working Conditions/Environment
Good Leadership
/>
15