Neoadjuvant chemotherapy-induced decrease of prognostic nutrition index predicts poor prognosis in patients with breast cancer
Bạn đang xem bản rút gọn của tài liệu. Xem và tải ngay bản đầy đủ của tài liệu tại đây (928.92 KB, 10 trang )
Oba et al. BMC Cancer
(2020) 20:160
/>
RESEARCH ARTICLE
Open Access
Neoadjuvant chemotherapy-induced
decrease of prognostic nutrition index
predicts poor prognosis in patients with
breast cancer
Takaaki Oba, Kazuma Maeno* , Daiya Takekoshi, Mayu Ono, Tokiko Ito, Toshiharu Kanai and Ken-ichi Ito
Abstract
Background: The prognostic nutritional index (PNI), which is an easily calculated nutritional index, is significantly
associated with patient outcomes in various solid malignancies. This study aimed to evaluate the prognostic impact
of PNI changes in patients with breast cancer undergoing neoadjuvant chemotherapy (NAC).
Methods: We reviewed patients with breast cancer who underwent NAC and a subsequent surgery for breast
cancer between 2005 and 2016. PNI before and after NAC were calculated using the following formula: 10 × serum
albumin (g/dl) + 0.005 × total lymphocyte count/mm3. The relationship between PNI and prognosis was
retrospectively analyzed.
Results: In total, 191 patients were evaluated. There was no significant difference in disease-free survival (DFS)
between the pre-NAC PNI high group and the pre-NAC PNI low group (cutoff: 53.1). However, PNI decreased in 181
patients (94.7%) after NAC and the mean PNI also significantly decreased after NAC from 52.6 ± 3.8 pre-NAC to
46.5 ± 4.4 post-NAC (p < 0.01). The mean ΔPNI, which was calculated as pre-NAC PNI minus post-NAC PNI, was 5.4.
The high ΔPNI group showed significantly poorer DFS than the low ΔPNI group (cut off: 5.26) (p = 0.015). Moreover,
high ΔPNI was an independent risk factor of DFS on multivariate analysis (p = 0.042).
Conclusions: High decrease of PNI during NAC predicts poor prognosis. Thus, maintaining the nutritional status
during NAC may result in better treatment outcomes in patients with breast cancer.
Keywords: Prognostic nutritional index, Disease-free survival, Neoadjuvant chemotherapy, Breast cancer
Background
Despite recent improvements in early detection and progress in surgical techniques, chemotherapy, molecular
targeting therapy, and endocrine therapy, breast cancer
remains the leading cause of cancer death for women
[1]. That is why some patients with breast cancer still
develop recurrence even after curative resection and
neoadjuvant/adjuvant therapy. Therefore, prevention of
recurrence and accurate prediction of prognosis are
needed to improve patient survival and fully inform
patients.
* Correspondence:
Division of Breast and Endocrine Surgery, Department of Surgery, Shinshu
University School of Medicine, 3-1-1 Asahi, Matsumoto, Nagano, Japan
Accumulating evidence suggests that nutritional status
has a strong impact on the outcome of cancer treatment
[2]. The prognostic nutritional index (PNI), which is calculated via a simple formula using only serum albumin
level and lymphocyte cell count in the peripheral blood, is
among the most commonly used parameters to evaluate
nutritional status [3]. It has been demonstrated that a preoperative low PNI status is both a risk factor for postoperative complications and a predictive factor for poor
prognosis among patients with various malignant tumors
including gastric, colorectal, lung, pancreatic, and renal
cell cancer undergoing surgery [4–10]. However, only few
nutritional studies in the treatment for breast cancer have
been conducted [11, 12]. Therefore, the significance of
PNI in breast cancer still remains unclear.
© The Author(s). 2020 Open Access This article is distributed under the terms of the Creative Commons Attribution 4.0
International License ( which permits unrestricted use, distribution, and
reproduction in any medium, provided you give appropriate credit to the original author(s) and the source, provide a link to
the Creative Commons license, and indicate if changes were made. The Creative Commons Public Domain Dedication waiver
( applies to the data made available in this article, unless otherwise stated.
Oba et al. BMC Cancer
(2020) 20:160
Neoadjuvant chemotherapy (NAC) has become widely
used for patients with locally advanced breast cancer because it has been shown to significantly elevate the rate
of breast-conserving surgery by reducing the tumor volume. Further, the prognosis of the patients who underwent NAC is not inferior to those treated with
postoperative chemotherapy [13]. In addition to these
clinical benefits, NAC also provides important prognostic information such as pathological complete response
(pCR) rate, which has been demonstrated to be a prognostic marker in human epidermal growth factor receptor type 2 (HER2)-positive or triple-negative breast
cancer (TNBC) [14]. In this regard, NAC could have potential to present other various prognostic markers as
well as pCR and we focused on PNI.
It has been reported that chemotherapy leads to malnutrition due to its gastrointestinal adverse effects including anorexia, nausea, vomiting, stomatitis, and
diarrhea [15]. Migita et al. reported that a decrease of
PNI during NAC in patients with gastric cancer is associated with a worse long-term outcome [16]. However,
to date, there has been no study on the impact of
changes in PNI on postoperative prognosis in patients
with breast cancer who underwent NAC.
As such, the present study aimed to evaluate the prognostic impact of PNI and other nutritional indices in patients with breast cancer. Towards this goal, we
evaluated the changes in PNI and other nutritional factors (e.g., serum albumin level and neutrophil/lymphocyte ratio (NLR)) and body mass index (BMI) during
NAC and investigated the association between them and
patient outcomes.
Methods
Patients and study design
This retrospective, single-center study evaluated patients
with breast cancer who underwent NAC and subsequent
surgery in Shinshu University Hospital between 2005
and 2016. Patients who could not provide detailed laboratory data and those who could not complete NAC
or required a treatment delay of ≥2 weeks due to chemotoxicity were excluded.
Data collection
Data on clinicopathological characteristics, including
age, sex, clinical stage at diagnosis, histological type,
histological grade (HG), estrogen receptor (ER), progesterone receptor (PgR), HER2 status, NAC regimens, operation procedure, pathological responses to NAC, and
presence of recurrence, were collected from the patients’
medical records. Disease-free survival was defined as the
time from surgery to the date of locoregional relapse or
distant metastases, whichever occurred first.
Page 2 of 10
PNI, the serum albumin level (Alb) (g/dl), NLR, and
BMI were used as nutritional parameters in this study.
Pre- and post-NAC blood examination data were also
obtained. In addition, both body weight and height were
obtained at the same day when blood samples were collected. Pre-NAC nutritional values were collected more
than 1 week before the beginning of NAC, while postNAC values were collected at more than 4 weeks after
the last administration of NAC. PNI values were calculated using the following formula: 10 × serum albumin
value (g/dl) + 0.005 × total lymphocyte counts in the peripheral blood/mm3 [3]. NLR values were as the total
neutrophil count divided by the total lymphocyte counts,
while BMI as patient’s weight (in kilograms) divided by
the square of height (meters) [17, 18]. ΔPNI, ΔAlb,
ΔNLR, and ΔBMI were calculated as each value on preNAC minus that on post-NAC. The receiver operating
characteristic (ROC) curve of each prognostic parameter
was analyzed to determine the best cut-off value for
disease-free survival.
NAC regimens and surgical methods
Two different NAC regimens were mainly used: (1)
anthracycline-based regimens (AC) including EC (60–75
mg/m2 epirubicin and 600 mg/m2 cyclophosphamide) or
FEC (500 mg/m2 fluorouracil, 75–100 mg/m2 epirubicin,
and 500 mg/m2 cyclophosphamide) administered every
3 weeks and (2) taxane regimens including triweekly administered docetaxel (DOC) 75 mg/m2 or weekly administered paclitaxel (PTX) 80 mg/m2. Most of the patients
who underwent four cycles of AC were then administered a further four cycles of DOC or PTX. In HER2positive patients who received taxane regimens, 6 mg/kg
(triweekly) or 2 mg/kg (weekly) trastuzumab was simultaneously administered. Surgery was performed within
4–7 weeks after NAC completion. All patients underwent axillary lymph node dissection. The efficacy of
NAC was pathologically examined in the surgical specimens. pCR was defined as no evidence of residual invasive carcinoma in the breast tissue regardless of the
axillary lymph node status.
Adjuvant trastuzumab, endocrine, and radiation therapy
after surgery
Following surgery, extensional adjuvant trastuzumab (initially 8 mg/kg, followed by 6 mg/kg) was administered every
3 weeks for 12 months to patients with HER2-positive
breast cancer. Whole breast irradiation of 50–60 Gy was
performed for the patients who underwent breastconserving surgery, while chest wall and regional lymph
node irradiation of 50–60 Gy was performed for the patients with more than three nodal metastases on the postoperative pathological examinations or preoperative
imaging examinations including ultrasonography, magnetic
Oba et al. BMC Cancer
(2020) 20:160
resonance imaging, and 18 F-fluorodeoxyglucose positron
emission tomography. In addition, postmenopausal patients
with positive ER or PgR status were treated with aromatase
inhibitors for more than 5 years, whereas premenopausal
patients were treated with tamoxifen or tamoxifen with
luteinizing hormone-releasing hormone agonist.
Statistical analysis
Categorical and continuous variables were analyzed using
Fisher’s exact test and two-sided tests, respectively. Survival
curves were estimated using the Kaplan–Meier method,
and significant differences in survival were assessed using
the log-rank test. Univariate and multivariate analyses with
a Cox proportional hazards model were performed to determine significant factors. All statistical analyses were
Page 3 of 10
carried out using StatFlex ver.6 (Artech Co., Ltd., Osaka,
Japan), and p < 0.05 was considered statistically significant.
Results
Clinicopathological characteristics and nutrition
parameter of patients
In total, 191 patients with a mean age (± standard deviation) of 51.2 ± 10.4 were evaluated. The patient characteristics are shown in Table 1. With respect to clinical
stage at diagnosis, 1 (0.5%), 118 (61.8%), and 72 (37.7%)
patients had stage I, II, and III disease, respectively. For
the pathological classification, 171 patients (89.5%) had invasive ductal carcinoma; 12 patients (6.3%), invasive lobular carcinoma; and 8 patients (4.2%), other special types.
As for intrinsic subtype, 107 cases (56.0%) were luminal
Table 1 Clinicopathologic characteristics in patients
Variables
Total
low ΔPNI
high ΔPNI
n = 191 (%)
n = 91 (%)
n = 100 (%)
p value
Age(mean ± SD)
51.2 ± 10.4
50.9 ± 9.26
51.5 ± 11.3
0.68
Sex(Male/Female)
0/191
0/91
0/100
Pre-NAC clinical stage
Histological type
HG
Subtype
Regimens of NAC
Operation procedures
Pathological response to NAC
I
1 (0.5%)
1 (1.1%)
0 (0%)
II
118 (61.8%)
52 (57.2%)
66 (66.0%)
III
72 (37.7%)
38 (41.7%)
34 (34.0%)
IV
0 (0%)
0 (0%)
0 (0%)
IDC
171 (89.5%)
81 (89.0%)
90 (90.0%)
ILC
12 (6.3%)
7 (7.7%)
5 (5.0%)
Special type
8 (4.2%)
3 (3.3%)
5 (5.0%)
1
54 (28.3%)
18 (19.9%)
36 (36.0%)
2
89 (46.6%)
47 (51.6%)
42 (42.0%)
3
23 (12.0%)
14 (15.3%)
9 (9.0%)
Unknown
25 (13.1%)
12 (13.2%)
13 (13.0%)
Lunimal
107 (56.0%)
51 (56.0%)
56 (56.0%)
Luninal HER2
37 (19.4%)
19 (20.9%)
18 (18.0%)
HER2 enriched
24 (12.6%)
12 (13.2%)
12 (12.0%)
TNBC
23 (12.0%)
9 (9.9%)
14 (14.0%)
AC
11 (5.8%)
10 (11.0%)
1 (1.0%)
AC → PTX and/or HER
91 (47.6%)
52 (57.2%)
39 (39.0%)
AC → DOC and/or HER
89 (46.6%)
29 (31.8%)
60 (60.0%)
Bt,Ax
128 (67.1%)
59 (64.8%)
69 (69.0%)
Bp,Ax
63 (32.9%)
32 (35.2%)
31 (31.0%)
0.67
0.89
0.15
0.79
0.02
0.65
non-pCR
154 (80.6%)
78 (85.7%)
76 (76.0%)
pCR
37 (19.4%)
13 (14.3%)
24 (24.0%)
0.10
Pre-NAC PNI
52.6 ± 3.8
50.9 ± 3.7
54.1 ± 3.6
< 0.01
Post-NAC PNI
46.5 ± 4.5
48.8 ± 3.9
44.5 ± 4.0
< 0.01
Recurrence
38 (19.9%)
13 (14.3%)
25 (25.0%)
0.06
NAC Neoadjuvant chemotherapy, HG Histological grade, IDC Invasive ductal carcinoma, ILC Invasive lobular carcinoma, AC Antracycline, PTX paclitaxel, DOC
docetaxel, HER Trastuzumab, Bt Mastectomy, Bp Partial resection of breast, Ax Axillary dissection, NAC neoadjuvant chemotherapy, PNI prognostic nutritional index
Oba et al. BMC Cancer
(2020) 20:160
Page 4 of 10
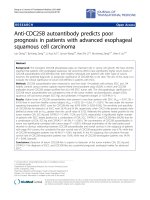
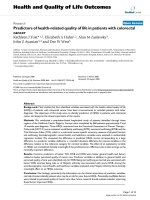
Fig. 1 Box-and-whisker plot for Pre-NAC and post-NAC PNI (p < 0.01) (a). Distribution of pre-NAC (b) and post-NAC PNI (c). NAC: Neoadjuvant
chemotherapy, PNI: Prognostic nutritional index
(ER+ and/or PgR+/HER2-), 37 cases (19.4%) were luminal
HER-2 (ER+ and/or PgR+/HER2+), 24 cases (12.6%) were
HER2 enriched (ER- and PgR- / HER2+), and 23 cases
(12.0%) were TNBC (ER- and PgR−/HER2-). Eleven patients (5.8%) were treated with AC without taxane; 91 patients (47.6%), AC followed by weekly PTX and/or
trastuzumab; and 89 patients (46.6%), AC followed by triweekly DOC and/or trastuzumab. Regarding chemotoxicity, 14 patients (7.3%) required a dose reduction of < 20%
during NAC. Mastectomy was performed for 128 patients
(67.1%), while breast-conserving surgery was performed
for 63 patients (32.9%). pCR was obtained in 37 patients
(19.4%). The median follow-up period after surgery was
51 months (range, 1–151 months), and 38 patients (19.9%)
developed recurrence.
The mean PNI (pre: 52.6 ± 3.8 vs post: 46.5 ± 4.5; p <
0.01) and Alb (pre: 4.41 ± 0.30 vs post: 4.11 ± 0.36; p <
0.01) were significantly decreased after NAC, whereas
NLR was significantly increased after NAC (pre: 2.50 ±
1.4 vs post: 2.96 ± 1.6; p < 0.01). Meanwhile, there was
no significant difference in BMI before and after NAC
(pre: 22.5 ± 3.9 vs post: 22.3 ± 3.9; p = 0.63) (Fig. 1, Additional file 1: Figure S1, Table 2). Among these four factors, PNI was the most commonly decreased (181/191;
94.7%) (Additional file 2: Table S1).
Association between nutritional parameters and diseasefree survival
Disease-free survival in the high and low groups of each
nutritional parameter was analyzed to examine the
correlation between nutritional status and patient outcome. The optimal cutoff values of PNI, Alb, NLR, and
BMI for disease-free survival as identified using the ROC
curves were 53.1, 4.36, 2.32, and 21.7 for pre-NAC, respectively, and 45.4, 4.04, 2.57 and 21.5, respectively, for
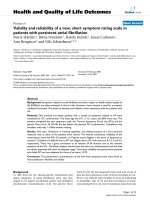
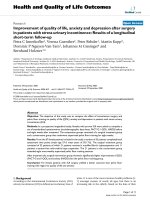
post-NAC (Additional file 3: TableS2). In pre-NAC,
there were no significant differences in disease-free survival between the high and low groups for each nutritional parameter (p = 0.89 for PNI, p = 0.65 for Alb, p =
0.25 for NLR, and p = 0.76 for BMI) (Fig. 2a, Additional file 4: Figure S2). Similar findings were found on
post-NAC (p = 0.21 for PNI, p = 0.78 for Alb, p = 0.58 for
NLR, and p = 0.58 for BMI) (Fig. 2b, Additional file 5:
Figure S3). As well as disease-free survival, diseasespecific survival was not different between the high and
low groups for each nutritional parameter (Pre-NAC:
p = 0.21 for PNI, p = 0.65 for Alb, p = 0.068 for NLR, and
p = 0.43 for BMI, Post-NAC: p = 0.98 for PNI, p = 0.14
for Alb, p = 0.57 for NLR, and p = 0.80 for BMI) (Additional file 6: Figure S4).
Table 2 Comparison of nutritional factors before and after NAC
(mean ± standard deviation)
Variables
Pre-NAC
Post-NAC
p value
PNI
52.6 ± 3.8
46.5 ± 4.5
< 0.01
Serum albumin level (g/dl)
4.41 ± 0.30
4.11 ± 0.36
< 0.01
NLR
2.50 ± 1.4
2.96 ± 1.6
< 0.01
BMI
22.5 ± 3.9
22.3 ± 3.9
0.63
NAC Neoadjuvant chemotherapy, PNI Prognostic nutritional index, NLR
Neutrophil/lymphocyte ratio, BMI Body mass index
Oba et al. BMC Cancer
(2020) 20:160
Page 5 of 10
Fig. 2 Kaplan–Meier curves for DFS according to PNI at (a) pre- (p = 0.89) and (b) post-NAC (p = 0.21). DFS: Disease-free survival, NAC:
Neoadjuvant chemotherapy, PNI: Prognostic nutritional index
Association between changes of nutrition parameters
during NAC and disease-free survival
Next, we focused on the association between changes in
nutrition parameters during NAC and disease-free survival. The optimal cutoff value determined via the ROC
curve for disease-free survival was 5.26 for ΔPNI, 0.34
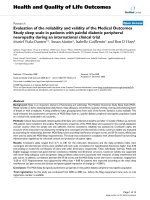
for ΔAlb, − 0.17 for ΔNLR, and − 0.26 for ΔBMI (Additional file 3: TableS2). Interestingly, the high ΔPNI
group had significantly poorer disease-free survival than
the low ΔPNI group (p = 0.015) (Fig. 3). Additionally, a
Fig. 3 Kaplan–Meier curves for DFS according to change of PNI
value (p = 0.015). DFS: Disease-free survival, PNI: Prognostic
nutritional index.
trend for lower disease-specific survival was found in the
high ΔPNI group than in the low ΔPNI group, although
no statistical difference was observed (p = 0.14) (Additional file 7: Figure S5). Meanwhile, there were no significant differences in either disease-free survival or
disease-specific survival between the high and low
groups according to ΔAlb (p = 0.053 for disease-free survival, p = 0.14 for disease-specific survival), ΔNLR (p =
0.65 for disease-free survival, p = 0.20 for disease-specific
survival), and ΔBMI (p = 0.66 for disease-free survival,
p = 0.66 for disease-specific survival) (Additional file 8:
Figure S6, Additional file 9: Figure S7).
The clinicopathological characteristics of the high and
low ΔPNI groups are shown in Table 1. The median
follow-up period after surgery was 64 (3–151) months
for the high ΔPNI group and 43 (1–151) for the low
ΔPNI group. The mean age, clinical stage, histological
type, HG, subtype, operation procedure, and pathological response to NAC were not significantly different
between the two groups. Meanwhile, NAC regimens differed significantly, with a higher rate of patients who
underwent NAC with DOC in the high ΔPNI group
(p = 0.02). Recurrence was more frequent in the high
ΔPNI group with marginal significance (p = 0.06). In the
high ΔPNI group, pre-NAC PNI was significantly higher
than that in the low ΔPNI group (p < 0.01). Furthermore,
the mean ΔPNI was significantly higher in the patients
with high pre-NAC PNI than in those with low preNAC PNI (Additional file 10: Figure S8), indicating that
a large PNI change may be likely to occur in patients
with high PNI at baseline.
The higher proportion of patients treated with DOC
in the high ΔPNI group prompted us to examine
whether NAC regimens affected disease-free survival.
However, we found no significant difference in diseasefree survival among the three NAC regimens (AC, AC
followed by PTX and/or trastuzumab, or AC followed by
Oba et al. BMC Cancer
(2020) 20:160
DOC and/or trastuzumab) (Additional file 11: Figure
S9). These data suggest that the difference in diseasefree survival by ΔPNI is independent of NAC regimens.
Next, we examined if tumor burden at time of the
diagnosis could influence the pre-NAC PNI, post-NAC
PNI, or ΔPNI. When we divided the patients into stage
I, II and stage III, pre-NAC PNI, post-NAC PNI, or
ΔPNI were not different (p = 0.87, p = 0.73, and p = 0.85,
respectively), indicating that the volume of disease did
not affect either the PNI value or the change in PNI
(Additional file 12: Figure S10).
Association between disease-free survival and ΔPNI based
on tumor characteristics
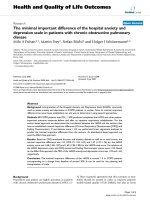
To investigate whether the effect of ΔPNI on diseasefree survival depends on tumor characteristics, we divided the patients according to ER and HER2 expression
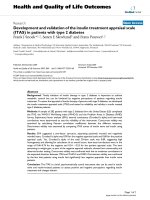
on tumors. In the ER-positive population, the high ΔPNI
Page 6 of 10
group had significantly poorer disease-free survival than
the low ΔPNI group (p = 0.030) (Fig. 4a). Meanwhile, as
for HER2 status, the high ΔPNI group presented significantly poorer disease-free survival than the low ΔPNI
group among HER2-negative cases (p = 0.029) (Fig. 4b).
Disease-free survival was not significantly associated
with ER negative (p = 0.32) and HER2 positive (p = 0.48)
status, but the high ΔPNI group tended to have poorer
disease-free survival than the low ΔPNI group in both
the ER-negative and HER2-positive cohorts (Fig. 4a,b).
On division into four subtypes (luminal; ER+ and/or
PgR+ / HER2-, luminal HER2: ER+ and/or PgR+ /
HER2+, HER2 enriched: ER- and PgR- / HER2+, and
TNBC: ER- and PgR−/HER-), the high ΔPNI group
showed a trend of poorer disease-free survival than the
low ΔPNI group, although the differences were not significant because of the small number of patients with
each subtype (p = 0.091 for luminal, p = 0.098 for luminal
Fig. 4 Kaplan-Meier curves for DFS according to the change of PNI distributed by ER and HER2. a ER-positive (p = 0.030) and negative (p = 0.32)
breast cancer. b HER2-positive (p = 0.48) and negative (p = 0.029) breast cancer. DFS: Disease-free survival, PNI: Prognostic nutritional index, ER:
estrogen receptor, HER2: human epidermal growth factor receptor 2
Oba et al. BMC Cancer
(2020) 20:160
Page 7 of 10
HER2, p = 0.67 for HER2 enriched, and p = 0.18 for
TNBC) (Additional file 13: Figure S11).
Regarding clinical stage, the high ΔPNI group showed
significantly poorer disease-free survival than the low
ΔPNI group among patients with stage III breast cancer
(p = 0.0064). In patients with stage I or II breast cancer,
the high ΔPNI group tended to show poorer disease-free
survival than the low ΔPNI group, although the difference was not significant (p = 0.39). As for HG, the high
ΔPNI group consistently showed poorer disease-free survival with respect to each HG with marginal or significant differences (p = 0.048 for HG1, p = 0.072 for HG2,
p = 0.069 for HG3) (Additional file 14: Figure S12).
Prognostic factors of disease-free survival
To confirm the significance of ΔPNI in disease-free survival, univariate and multivariate analyses were performed. Univariate analysis revealed that ΔPNI was a
significant predictor of disease-free survival (HR: 2.2,
95% CI: 1.14–4.41, p = 0.018). Other factors associated
with disease-free survival were pre-NAC clinical stage
(HR: 3.1, 95% CI: 1.58–5.81, p < 0.01) and HER2 status
(HR: 0.3, 95% CI: 0.11–0.77, p = 0.012). On multivariate
analysis using Cox hazard model, ΔPNI was an independent risk factor for disease-free survival (HR: 2.17,
95% CI: 1.08–4.76, p = 0.042) (Table 3).
Discussion
The present study demonstrates that high ΔPNI is significantly associated with poor disease-free survival and
is an independent predictor of disease-free survival. To
the best of our knowledge, this is the first report to demonstrate that high ΔPNI is a reliable prognostic factor of
disease-free survival in patients with breast cancer who
underwent NAC.
Several parameters, including PNI [3], serum albumin
level [19], or NLR [20], are used to evaluate nutritional
status. Increasing evidence suggests that high preoperative PNI is a predictor of better postoperative complications and patients outcomes in various types of
malignancy [4–10]. Meanwhile, both high serum albumin level and low preoperative NLR also have been reported to be associated with better postoperative
outcomes in several cancers [19–27]. BMI is also a wellknown prognostic factor in breast cancers [28–30], and
body weight is also associated with the patients’ nutritional condition [31]. These four factors (i.e., PNI, serum
albumin level, NLR, and BMI) are easily calculated or
obtained from clinical records or physical examinations.
Therefore, we used these four factors as nutritional parameters in the present study.
We found no association between pre-NAC PNI,
serum albumin level, NLR, or BMI and disease-free
survival. Furthermore, post-NAC PNI, serum albumin
level, NLR, or BMI also did not show any correlation
with disease-free survival, although the low post-NAC
PNI group tended to present poorer disease-free survival than the high post-NAC PNI group. These data
indicated that the nutritional index itself did not predict the prognosis either before or after NAC. In general, chemotherapy worsen patients’ nutritional
condition due to its adverse gastrointestinal effects
[15]. Although some studies have demonstrated significant decreases of various nutritional parameters
such as albumin, pre-albumin, and transferrin due to
preoperative chemotherapy in cancers of the digestive
tract [16, 32], the influence of NAC on the nutritional
status of patients with breast cancer has remained unclear. In the present study, we observed significant
decreases in PNI and serum albumin level and increases in NLR after NAC. Particularly, PNI was
Table 3 Univariate and multivariate Cox proportional hazards regression analyses of the clinicopathological parameters
Univariate
Multivariate
p value
HR
95% CI
Age, years (≥50 vs. < 50)
0.73
0.89
0.47–1.68
Pre-NAC clinical stage (stage I and II vs. stage III)
< 0.01
3.1
1.58–5.81
ER (positive vs. negative)
0.97
1.1
0.48–2.14
p value
< 0.01
HR
95% CI
2.17
1.57–7.27
HER2 (positive vs. negative)
0.012
0.3
0.11–0.77
0.016
0.28
0.10–0.79
ΔPNI (high vs. low)
0.018
2.2
1.14–4.41
0.042
2.17
1.08–4.76
ΔAlb (high vs. low)
0.058
1.9
0.97–3.52
ΔBMI (high vs. low)
0.66
0.87
0.45–1.63
ΔNLR (high vs. low)
0.66
1.2
0.61–2.18
Histological type (IDC vs. ILC or special type)
0.23
2.4
0.58–10.03
Pathological response to NAC (non-pCR vs. pCR)
0.19
0.64
0.32–1.25
ER Estrogen receptor, HER-2 Human epidermal growth factor receptor type 2, BMI Body mass index, NLR Neutrophil/lymphocyte ratio, PNI Prognostic nutritional
index, IDC Invasive ductal carcinoma, ILC Invasive lobular carcinoma, NAC Neoadjuvant chemotherapy, pCR Pathological complete response
Oba et al. BMC Cancer
(2020) 20:160
decreased in 181 patients of 191 (94.7%) after NAC.
These results suggest that NAC has a negative effect on
the nutritional status of patients with breast cancer, and
that among the four commonly used parameters, PNI may
be the most sensitive parameter to evaluate the nutritional
status in patients with breast cancer. Therefore, we consequently focused on changes in the value of these nutritional parameters and found that a decreased PNI after
NAC predicts poorer disease-free survival in patients with
breast cancer. Significant differences in disease-specific
survival were not observed in the present study. However,
a trend of poorer disease-specific survival was observed in
patients with a high decrease in PNI. A larger-scale study
or longer follow-up periods will be able to reveal the differences in disease-specific survival.
In the comparison of clinicopathological characteristics
between the high ΔPNI group and the low ΔPNI group,
there was a higher percentage of patients who received
DOC-containing regimens in the high ΔPNI group than
the low ΔPNI group. However, there was no significant
difference in disease-free survival among the three NAC
regimens (AC only, AC followed by PTX and/or trastuzumab, and AC followed by DOC and/or trastuzumab), indicating that the significant difference in disease-free
survival according to ΔPNI does not depend on the type
of chemotherapy regimen. One explanation for the higher
number of patients who underwent DOC-containing regimens in the high ΔPNI group may simply be due to the
stronger gastrointestinal adverse effects of DOC compared
with PTX [33, 34]. On the other hand, patients treated
with DOC are likely to develop peripheral edema [33, 35],
which is associated with hypoalbuminemia. This can be
another explanation for the increase of DOC-treated patients in the high ΔPNI group.
The biology of breast cancer is known to depend
largely on its intrinsic subtype, which is determined
mainly according to ER and HER2 status. Further, it is
globally accepted that the prognosis is different between
each subtype, and thus the therapeutic strategy depends
on the subtype [36]. However, the nutritional status of
patients with breast cancer may largely depend on patient factors, and not of the tumor. Consistent with this
notion, the present study demonstrated that the influence of ΔPNI on disease-free survival may be similar
across all breast cancer subtypes, particularly in patients
with ER-positive or HER2-negative breast cancer; however, this should be interpreted cautiously as there was
no statistical significance in the number of patients with
different subtypes owing to the small number of patients
enrolled in this study. Particularly, patients with HER2positive breast cancer had markedly good disease-free
survival to evaluate the statistical difference between
those with high and low ΔPNI. This may be due to the
administration of trastuzumab that contributed to
Page 8 of 10
improved prognosis in patients with HER2-positive
breast cancer [37]. As well as intrinsic subtype, clinical
stage and HG are also universally accepted as prognostic
factors of breast cancer [38, 39]. This study showed that
the influence of ΔPNI on disease-free survival is stronger
in the advanced stage, although the pre NAC-PNI, post
NAC-PNI, and ΔPNI values itself were not dependent
on clinical stage. In addition, high ΔPNI is consistently
associated with poorer disease-free survival, independent
from HG. Although further large-scale studies are required for determining the importance of nutritional
change in patient outcomes according to the cancer subtype or the tumor burden, the results of the present
study suggest that the association between changes in
nutritional status during NAC and patient outcome
mainly depends on the patient’s nutritional status, especially in the advanced stage, but not on tumor
characteristics.
From the point of view of immunity, better immunological condition has been considered to lead to improved survival in cancer. Malnutrition has been shown
to be related to cancer progression due to its association with weak immune response [40, 41]. Accordingly,
immune response has also been shown to correlate with
better outcomes during various antitumor therapies in
breast cancer [42]. Collectively, the result of the present
and previous studies supports that maintaining the PNI
during NAC may be beneficial to prevent worse prognosis in patients with breast cancer. Several studies
have demonstrated that nutritional support such as supplemental immunonutrition containing n-3 polyunsaturated fatty acids enabled improved the nutritional
condition of patients who underwent chemotherapy
[43–45]. Individual nutritional counseling has also been
demonstrated to be important in maintaining the nutritional status [46]. In line with our findings, providing
these nutritional support strategies during NAC may result in better patient outcome by maintaining the nutritional condition. Indeed, several clinical trials are
ongoing to test whether nutrition interventions could
improve the treatment outcome of metastatic breast
cancer patients (NCT03045289, NCT03045289). In line
with the results of this study, the concept of nutrition
intervention should be further broadened to the neoadjuvant setting.
Several limitations of the present study need to be
considered. First, it was a retrospective analysis with a
small study population in a single institution. In addition
to the heterogeneous nature of breast cancer, the limited
number of patients may reduce the statistical power.
Second, the NAC regimens varied between patients because the study period spanned several years when treatment regimens changed. Further investigations are
therefore needed to validate our results.
Oba et al. BMC Cancer
(2020) 20:160
Conclusions
The findings of the present study indicate that a decrease of PNI can be a marker to predict poor prognosis
after NAC in patients with breast cancer. Our results
imply the importance of monitoring the nutritional status during NAC.
Supplementary information
Supplementary information accompanies this paper at />1186/s12885-020-6647-4.
Additional file 1: Figure S1. Box-and-whisker plot for Alb, NLR, and
BMI in pre-NAC and post-NAC. NAC: Neoadjuvant chemotherapy, Alb:
Serum albumin level (g/dl), NLR: Neutrophil/lymphocyte ratio, BMI: Body
mass index.
Additional file 2: Table S1. Distribution of patients with decreased PNI,
Alb, and BMI or increased NLR during NAC.
Additional file 3: Table S2. The AUC and sensitivity/specificity for ROC
curve.
Additional file 4: Figure S2. Disease-free survival evaluated using the
Kaplan–Meier method for Alb, NLR, and BMI at pre-NAC. NAC: Neoadjuvant chemotherapy, Alb: Serum albumin level (g/dl), NLR: Neutrophil/
lymphocyte ratio, BMI: Body mass index.
Additional file 5: Figure S3. Disease-free survival evaluated using the
Kaplan–Meier method for Alb, NLR, and BMI at post-NAC. NAC: Neoadjuvant chemotherapy, Alb: Serum albumin level (g/dl), NLR: Neutrophil/
lymphocyte ratio, BMI: Body mass index.
Additional file 6: Figure S4. Disease-specific survival evaluated using
the Kaplan–Meier method for Alb, NLR, and BMI at pre-NAC and postNAC. NAC: Neoadjuvant chemotherapy, PNI: Prognostic nutritional index,
Alb: Serum albumin level (g/dl), NLR: Neutrophil/lymphocyte ratio, BMI:
Body mass index.
Additional file 7: Figure S5. Disease-specific survival evaluated using
the Kaplan–Meier method according to change of PNI value. PNI: Prognostic nutritional index.
Additional file 8: Figure S6. Kaplan–Meier curves for disease-free survival according to change in Alb, NLR, and BMI. Alb: Serum albumin level
(g/dl), NLR: Neutrophil/lymphocyte ratio, BMI: Body mass index.
Additional file 9: Figure S7. Kaplan–Meier curves for disease-specific
survival according to change in Alb, NLR, and BMI. Alb: Serum albumin
level (g/dl), NLR: Neutrophil/lymphocyte ratio, BMI: Body mass index.
Additional file 10: Figure S8. Disease-free survival evaluated using the
Kaplan–Meier method according to NAC regimens. NAC: Neoadjuvant
chemotherapy, AC: Anthracycline, PTX: paclitaxel, DOC: Docetaxel.
Additional file 11: Figure S9. Box-and-whisker plot for ΔPNI stratified
by pre-NAC PNI. NAC: Neoadjuvant chemotherapy, PNI: Prognostic nutritional index.
Additional file 12: Figure S10. Box-and-whisker plot for pre-NAC PNI,
post-NAC PNI, and ΔPNI stratified by clinical stage. NAC: Neoadjuvant
chemotherapy, PNI: Prognostic nutritional index.
Additional file 13: Figure S11. Kaplan–Meier curves for disease-free
survival according to change of PNI by breast cancer subtype. PNI: Prognostic nutritional index.
Additional file 14: Figure S12. Kaplan–Meier curves for disease-free
survival according to change of PNI by clinical stage and HG. PNI: Prognostic nutritional index, HG: Histological grade.
Abbreviations
AC: Anthracycline; Alb: Serum albumin level; BMI: Body mass index;
DOC: Docetaxel; EC: Epirubicin and cyclophosphamide; ER: Estrogen receptor;
FEC: Fluorouracil, epirubicin, and cyclophosphamide; HER2: Human epidermal
growth factor receptor type 2; HG: Histological grade; NAC: Neoadjuvant
chemotherapy; NLR: Neutrophil/lymphocyte ratio; pCR: Pathological
Page 9 of 10
complete response; PgR: Progesterone receptor; PNI: Prognostic nutritional
index; PTX: Paclitaxel; ROC: Receiver operating characteristics; TNBC: Triplenegative breast cancer
Acknowledgements
We would like to thank Editage (www.editage.com) for English language
editing.
Authors’ contributions
TO and KI designed the study. TO, DT, MO, TI, TK, KM collected the clinical
data. TO performed the statistical analysis. The draft manuscript was
prepared by TO and KM. All authors read and approved the final manuscript.
Funding
This work was not funded by any grant.
Availability of data and materials
The data supporting the findings of this work are available from the authors
upon reasonable request.
Ethics approval and consent to participate
This study was approved by the Medical Ethics Committee on Clinical
Investigation of Shinshu University (no. 4077). Patients were provided the
opportunity to opt out of participation in this study via notifications
displayed in the outpatient ward and the institution’s website. Unless
patients reject the enrollment in this study, the requirement for written
informed consent was waived by the Medical Ethics Committee on Clinical
Investigation of Shinshu University.
Consent for publication
Not applicable.
Competing interests
The authors declare that they have no competing interests.
Received: 10 July 2019 Accepted: 17 February 2020
References
1. Siegel R, Ma J, Zou Z, Jemal A. Cancer statistics, 2014. CA Cancer J Clin.
2014;64:9–29.
2. Rock CL, Doyle C, Demark-Wahnefried W, Meyerhardt J, Courneya KS,
Schwartz AL, et al. Nutrition and physical activity guidelines for cancer
survivors. CA Cancer J Clin. 2012;62:243–74.
3. Onodera T, Goseki N, Kosaki G. Prognostic nutritional index in
gastrointestinal surgery of malnourished cancer patients. Nihon Geka Gakkai
Zasshi. 1984;85:1001–5.
4. Yang Y, Gao P, Song Y, Sun J, Chen X, Zhao J, et al. The prognostic
nutritional index is a predictive indicator of prognosis and postoperative
complications in gastric cancer: a meta-analysis. Eur J Surg Oncol. 2016;42:
1176–82.
5. Yang Y, Gao P, Chen X, Song Y, Shi J, Zhao J, et al. Prognostic significance
of preoperative prognostic nutritional index in colorectal cancer: results
from a retrospective cohort study and a meta-analysis. Oncotarget. 2016;7:
58543–52.
6. Shoji F, Morodomi Y, Akamine T, Takamori S, Katsura M, Takada K, et al.
Predictive impact for postoperative recurrence using the preoperative
prognostic nutritional index in pathological stage I non-small cell lung
cancer. Lung Cancer. 2016;98:15–21.
7. Qiu C, Qu X, Shen H, Zheng C, Zhu L, Meng L, et al. Evaluation of
prognostic nutritional index in patients undergoing radical surgery with
nonsmall cell lung Cancer. Nutr Cancer. 2015;67:741–7.
8. Mori S, Usami N, Fukumoto K, Mizuno T, Kuroda H, Sakakura N, et al. The
significance of the prognostic nutritional index in patients with completely
resected non-small cell lung Cancer. PLoS One. 2015;10:e0136897.
9. Kanda M, Fujii T, Kodera Y, Nagai S, Takeda S, Nakao A. Nutritional predictors
of postoperative outcome in pancreatic cancer. Br J Surg. 2011;98:268–74.
10. Broggi MS, Patil D, Baum Y, Nieh PT, Alemozaffar M, Pattaras JG, et al.
Onodera's prognostic nutritional index as an independent prognostic factor
in clear cell renal cell carcinoma. Urology. 2016;96:99–105.
Oba et al. BMC Cancer
(2020) 20:160
11. Mohri T, Mohri Y, Shigemori T, Takeuchi K, Itoh Y, Kato T. Impact of
prognostic nutritional index on long-term outcomes in patients with breast
cancer. World J Surg Oncol. 2016;14:170.
12. Yang Z, Zhang B, Hou L, Xie Y, Cao X. Pre-operative prognostic nutritional
index predicts the outcomes for triple-negative breast cancer. Tumour Biol.
2014;35:12165–71.
13. Wolmark N, Wang J, Mamounas E, Bryant J, Fisher B. Preoperative
chemotherapy in patients with operable breast cancer: nine-year results
from National Surgical Adjuvant Breast and Bowel Project B-18. J Natl
Cancer Inst Monogr. 2001;30:96–102.
14. von Minckwitz G, Untch M, Blohmer JU, Costa SD, Eidtmann H, Fasching PA,
et al. Definition and impact of pathologic complete response on prognosis
after neoadjuvant chemotherapy in various intrinsic breast cancer subtypes.
J Clin Oncol. 2012;30:1796–804.
15. Hiura Y, Takiguchi S, Yamamoto K, Takahashi T, Kurokawa Y, Yamasaki M,
et al. Effects of ghrelin administration during chemotherapy with advanced
esophageal cancer patients: a prospective, randomized, placebo-controlled
phase 2 study. Cancer. 2012;118:4785–94.
16. Migita K, Matsumoto S, Wakatsuki K, Ito M, Kunishige T, Nakade H, et al. A
decrease in the prognostic nutritional index is associated with a worse
long-term outcome in gastric cancer patients undergoing neoadjuvant
chemotherapy. Surg Today. 2017;47:1018–26.
17. Tomita M, Shimizu T, Ayabe T, Yonei A, Onitsuka T. Preoperative neutrophil
to lymphocyte ratio as a prognostic predictor after curative resection for
non-small cell lung cancer. Anticancer Res. 2011;31:2995–8.
18. Shimizu K, Okita R, Saisho S, Maeda A, Nojima Y, Nakata M. Preoperative
neutrophil/lymphocyte ratio and prognostic nutritional index predict
survival in patients with non-small cell lung cancer. World J Surg Oncol.
2015;13:291.
19. Miura K, Hamanaka K, Koizumi T, Kitaguchi Y, Terada Y, Nakamura D, et al.
Clinical significance of preoperative serum albumin level for prognosis in
surgically resected patients with non-small cell lung cancer: comparative
study of normal lung, emphysema, and pulmonary fibrosis. Lung Cancer.
2017;111:88–95.
20. Ethier JL, Desautels D, Templeton A, Shah PS, Amir E. Prognostic role of
neutrophil-to-lymphocyte ratio in breast cancer: a systematic review and
meta-analysis. Breast Cancer Res. 2017;19:2.
21. Templeton AJ, McNamara MG, Seruga B, Vera-Badillo FE, Aneja P, Ocana A,
et al. Prognostic role of neutrophil-to-lymphocyte ratio in solid tumors: a
systematic review and meta-analysis. J Natl Cancer Inst. 2014;106:dju124.
22. Song Y, Yang Y, Gao P, Chen X, Yu D, Xu Y, et al. The preoperative
neutrophil to lymphocyte ratio is a superior indicator of prognosis
compared with other inflammatory biomarkers in resectable colorectal
cancer. BMC Cancer. 2017;17:744.
23. Sharaiha RZ, Halazun KJ, Mirza F, Port JL, Lee PC, Neugut AI, et al. Elevated
preoperative neutrophil:lymphocyte ratio as a predictor of postoperative
disease recurrence in esophageal cancer. Ann Surg Oncol. 2011;18:3362–9.
24. Marin Hernandez C, Pinero Madrona A, Gil Vazquez PJ, Galindo Fernandez
PJ, Ruiz Merino G, Alonso Romero JL, et al. Usefulness of lymphocyte-tomonocyte, neutrophil-to-monocyte and neutrophil-to-lymphocyte ratios as
prognostic markers in breast cancer patients treated with neoadjuvant
chemotherapy. Clin Transl Oncol. 2018;20:476–83.
25. Ma J, Kuzman J, Ray A, Lawson BO, Khong B, Xuan S, et al. Neutrophil-tolymphocyte ratio (NLR) as a predictor for recurrence in patients with stage
III melanoma. Sci Rep. 2018;8:4044.
26. Iwase T, Sangai T, Sakakibara M, Sakakibara J, Ishigami E, Hayama S, et al. An
increased neutrophil-to-lymphocyte ratio predicts poorer survival following
recurrence for patients with breast cancer. Mol Clin Oncol. 2017;6:266–70.
27. Azab B, Bhatt VR, Phookan J, Murukutla S, Kohn N, Terjanian T, et al. Usefulness
of the neutrophil-to-lymphocyte ratio in predicting short- and long-term
mortality in breast cancer patients. Ann Surg Oncol. 2012;19:217–24.
28. Ryu SY, Kim CB, Nam CM, Park JK, Kim KS, Park J, et al. Is body mass index
the prognostic factor in breast cancer?: a meta-analysis. J Korean Med Sci.
2001;16:610–4.
29. Protani M, Coory M, Martin JH. Effect of obesity on survival of women with
breast cancer: systematic review and meta-analysis. Breast Cancer Res Treat.
2010;123:627–35.
30. Chlebowski RT, Aiello E, McTiernan A. Weight loss in breast cancer patient
management. J Clin Oncol. 2002;20:1128–43.
31. Chlebowski RT. Nutrition and physical activity influence on breast cancer
incidence and outcome. Breast. 2013;22(Suppl 2):S30–7.
Page 10 of 10
32. Yoshida N, Watanabe M, Baba Y, Ishimoto T, Iwagami S, Sakamoto Y, et al.
Influence of preoperative docetaxel, cisplatin, and 5-fluorouracil on the
incidence of complications after esophagectomy for resectable advanced
esophageal cancer. Dis Esophagus. 2014;27:374–9.
33. Jones SE, Erban J, Overmoyer B, Budd GT, Hutchins L, Lower E, et al.
Randomized phase III study of docetaxel compared with paclitaxel in
metastatic breast cancer. J Clin Oncol. 2005;23:5542–51.
34. Sparano JA, Wang M, Martino S, Jones V, Perez EA, Saphner T, et al. Weekly
paclitaxel in the adjuvant treatment of breast cancer. N Engl J Med. 2008;
358:1663–71.
35. Harvey V, Mouridsen H, Semiglazov V, Jakobsen E, Voznyi E, Robinson BA,
et al. Phase III trial comparing three doses of docetaxel for second-line
treatment of advanced breast cancer. J Clin Oncol. 2006;24:4963–70.
36. Coates AS, Winer EP, Goldhirsch A, Gelber RD, Gnant M, Piccart-Gebhart M,
et al. Tailoring therapies-improving the management of early breast cancer:
St Gallen international expert consensus on the primary therapy of early
breast Cancer 2015. Ann Oncol. 2015;26:1533–46.
37. Gianni L, Eiermann W, Semiglazov V, Manikhas A, Lluch A, Tjulandin S, et al.
Neoadjuvant chemotherapy with trastuzumab followed by adjuvant
trastuzumab versus neoadjuvant chemotherapy alone, in patients with
HER2-positive locally advanced breast cancer (the NOAH trial): a randomised
controlled superiority trial with a parallel HER2-negative cohort. Lancet.
2010;375:377–84.
38. DeSantis CE, Ma J, Goding Sauer A, Newman LA, Jemal A. Breast cancer
statistics, 2017, racial disparity in mortality by state. CA Cancer J Clin. 2017;
67:439–48.
39. Rakha EA, Reis-Filho JS, Baehner F, Dabbs DJ, Decker T, Eusebi V, et al. Breast
cancer prognostic classification in the molecular era: the role of histological
grade. Breast Cancer Res. 2010;12:207.
40. Zitvogel L, Pietrocola F, Kroemer G. Nutrition, inflammation and cancer. Nat
Immunol. 2017;18:843–50.
41. Gupta D, Lis CG. Pretreatment serum albumin as a predictor of cancer
survival: a systematic review of the epidemiological literature. Nutr J. 2010;9:
69.
42. Mahmoud SM, Paish EC, Powe DG, Macmillan RD, Grainge MJ, Lee AH, et al.
Tumor-infiltrating CD8+ lymphocytes predict clinical outcome in breast
cancer. J Clin Oncol. 2011;29:1949–55.
43. Murphy RA, Mourtzakis M, Chu QS, Baracos VE, Reiman T, Mazurak VC.
Supplementation with fish oil increases first-line chemotherapy efficacy in
patients with advanced nonsmall cell lung cancer. Cancer. 2011;117:3774–
80.
44. Xue H, Sawyer MB, Field CJ, Dieleman LA, Baracos VE. Nutritional
modulation of antitumor efficacy and diarrhea toxicity related to irinotecan
chemotherapy in rats bearing the ward colon tumor. Clin Cancer Res. 2007;
13:7146–54.
45. Kiss NK, Krishnasamy M, Isenring EA. The effect of nutrition intervention in
lung cancer patients undergoing chemotherapy and/or radiotherapy: a
systematic review. Nutr Cancer. 2014;66:47–56.
46. Ravasco P, Monteiro-Grillo I, Camilo M. Individualized nutrition intervention
is of major benefit to colorectal cancer patients: long-term follow-up of a
randomized controlled trial of nutritional therapy. Am J Clin Nutr. 2012;96:
1346–53.
Publisher’s Note
Springer Nature remains neutral with regard to jurisdictional claims in
published maps and institutional affiliations.