A panel of protein kinase high expression is associated with postoperative recurrence in cholangiocarcinoma
Bạn đang xem bản rút gọn của tài liệu. Xem và tải ngay bản đầy đủ của tài liệu tại đây (1.98 MB, 16 trang )
Padthaisong et al. BMC Cancer
(2020) 20:154
/>
RESEARCH ARTICLE
Open Access
A panel of protein kinase high expression is
associated with postoperative recurrence in
cholangiocarcinoma
Sureerat Padthaisong1, Malinee Thanee2,3, Nisana Namwat1,2,3, Jutarop Phetcharaburanin1,2,3, Poramate Klanrit1,2,3,
Narong Khuntikeo2,3,4, Attapol Titapun2,3,4 and Watcharin Loilome1,2,3*
Abstract
Background: Cancer recurrence is one of the most concerning clinical problems of cholangiocarcinoma (CCA)
patients after treatment. However, an identification of predictive factor on Opisthorchis viverrini (OV)-associated CCA
recurrence is not well elucidated. In the present study, we aimed to investigate the correlation of twelve targeted
protein kinases with CCA recurrence.
Methods: Twelve protein kinases, epidermal growth factor receptor (EGFR), human epidermal growth factor
receptor 2, 3, 4 (HER2, HER3, HER4), vascular endothelial growth factor receptor 3 (VEGFR3), vascular endothelial
growth factor-C (VEGF-C), erythropoietin-producing hepatocellular carcinoma receptor type-A3 (EphA3), EphrinA1,
phosphor-serine/threonine kinase 1 (p-Akt1), serine/threonine kinase 1 (Akt1), beta-catenin and protein Wnt5a
(Wnt5a) were examined using immunohistochemistry. Pre-operative serum tumor markers, CA19–9 and CEA were
also investigated.
Results: Among twelve protein kinases, EGFR, HER4, and EphA3 were associated with tumor recurrence status,
recurrence-free survival (RFS) and overall survival (OS). Multivariate cox regression demonstrated that EGFR, HER4,
EphA3 or the panel of high expression of these proteins was an independent prognostic factor for tumor
recurrence. The combination of high expression of these proteins with a high level of CA19–9 could improve the
predictive ability on tumor recurrence. Moreover, the patients were stratified more accurately when analyzed using
the combination of high expression of these proteins with primary tumor (T) or lymph node metastasis (N) status.
Conclusion: EGFR, HER4, EphA3 or the panel of high expression of these proteins is an independent prognostic
factor for post-operative CCA recurrence.
Keywords: Cholangiocarcinoma, Cancer recurrence, Protein kinase, Tumor marker, Prognostic factor
Background
Cholangiocarcinoma (CCA) is a malignant tumor of bile
duct epithelium with very high incidence in Thailand,
particularly in northeastern region, of which Opisthorchis
viverrini (OV) infection is reported as the major risk factor
of CCA development in this area [1]. CCA is usually
asymptomatic in early stage and most patients are diagnosed with CCA when the disease becomes advanced,
* Correspondence:
1
Department of Biochemistry, Faculty of Medicine, Khon Kaen University, 123
Mittraparp Road, Muang District, Khon Kaen 40002, Thailand
2
Cholangiocarcinoma Screening and Care Program (CASCAP), Khon Kaen
University, Khon Kaen 40002, Thailand
Full list of author information is available at the end of the article
resulting in poor outcome [2]. Moreover, the recurrence
after treatment is nowadays very important, because it is a
significant problem for many patients with cancer and is
involved in poor prognosis of patients [3]. In CCA, the
high recurrence rate was reported in many studies [4, 5].
A precious study reported that most CCA patients developed recurrence within 2 years after surgery and the percentage of recurrence accounted for 62.2% [5]. Recently,
recurrence rate in mass-forming type of intrahepatic CCA
patients was reported with the recurrence rate of 80%. 1-,
2-, and 3-year RFS rate were very low which were 16.2,
5.4, and 2.7%, respectively. However, the association between RFS and clinicopathological data was not significant
© The Author(s). 2020 Open Access This article is distributed under the terms of the Creative Commons Attribution 4.0
International License ( which permits unrestricted use, distribution, and
reproduction in any medium, provided you give appropriate credit to the original author(s) and the source, provide a link to
the Creative Commons license, and indicate if changes were made. The Creative Commons Public Domain Dedication waiver
( applies to the data made available in this article, unless otherwise stated.
Padthaisong et al. BMC Cancer
(2020) 20:154
[4]. Thus, the effective prognostic biomarkers are required
to assess outcome of CCA patients as well as the probability of recurrence after treatment.
Nowadays, there are several markers reported as
tumor behavior predictors. They can be used for disease
management including progression and the relapse indicators of cancer. Serum tumor markers are the wellestablished markers for monitoring tumor and have been
reported to predict tumor recurrence in many types of
cancer [6, 7]. However, molecular biomarkers are widely
studied because it is not only used for the predicting of
tumor progression or recurrence, but can also be
employed as drug target for cancer treatment. Our
group previously reported the alteration of protein kinase expression in CCA. We found that many protein kinases were upregulated in CCA tissue and cell lines,
including receptor tyrosine kinase, the epidermal growth
factor receptor (EGFR) family, vascular endothelial
growth factor (VEGFR) receptor, erythropoietinproducing hepatocellular carcinoma (Eph) receptor, and
also many down-steam kinases such as serine/threonine
kinase or protein kinase B (Akt), and Wnt/beta-catenin
signaling pathways [8]. The evaluation of EGFR expression was reported in CCA and associated with poor
prognosis of CCA patients [9]. Furthermore, our group
also reported that high expressions of VEGFR3, EphA3
and their ligands were correlated with CCA metastasis
[10]. The role of protein kinase in PI3K/Akt signaling
pathway was also studied in CCA. The results showed
that high expression of protein in this pathway was
mostly involved in the worse clinical outcome of CCA
patients. Moreover, targeting of this pathway using
NVP-BEZ235 could inhibit tumor growth and metastasis
through reduced protein kinase activation [11]. The association of Wnt/beta-catenin signaling pathway with
CCA progression was also reported. The result showed
the alteration of Wnt proteins was associated with poor
prognosis of CCA patients, and inhibition of betacatenin expression could inhibit CCA cell growth [12].
Large-scale multi-omics have also been employed in
many studies in order to understand the carcinogenesis
as well as the progression of disease. In 2015, a previous
study reported the genomic alteration which characterized biliary tract cancer (BTC) patients. EGFR family
genes including EGFR, ERBB2 (HER2), ERBB3 (HER3)
were the most activating gene in gallbladder cancer
while EPHA2 mutation was found frequently in intrahepatic CCA (iCCA) [13]. ERBB2 amplification was reported for 3.9–8.5% of CCAs. This was more frequent in
fluke-associated CCA which account for 10.4% compared with 2.7% of fluke-negative CCA, resulting in the
elevation of ERBB2 gene expression in fluke-associated
CCA compared with fluke-negative cases. In addition,
the upregulation of AKT1 and WNT5B was also
Page 2 of 16
reported [14]. Single-nucleotide variations (SNVs) and
insertion-deletions (indels) were found in ERBB3 gene in
BTCs (5%). This mutation was significantly enriched in
extrahepatic CCA (eCCA) [15]. Recently, Nepal et al. reported that the mutation of ERBB4 gene was also found
in intrahepatic CCA (iCCA). In addition, pathway dysregulation in each subgroup of patients was explored.
They found that the patients who have KRAS mutation
were enriched for immune-related pathways, ErbB and
VEGF pathways. On the other hand, WNT pathway was
enriched in patients with TP53 gene mutation [16].
Since protein kinases play an important role in CCA
progression and are involved in poor prognosis of CCA
patients. In the current study, we hypothesized that the
alteration of these protein kinases including EGFR family, VEGFR3 and its ligand, Eph receptor and its ligand,
Akt1 and its activated form, Wnt, and beta-catenin may
be used as the predicting markers for post-operative
CCA recurrence. Therefore, twelve protein kinases were
examined using immunohistochemistry and analyzed
against CCA recurrence status, recurrence location,
recurrence-free survival (RFS) and overall survival (OS).
Methods
Patient selection criteria and follow-up
OV-associated cholangiocarcinoma (CCA) patients who
underwent surgery at Srinagarind Hospital, Khon Kaen
University, Khon Kaen, Thailand between February,
2007 and December, 2016 were retrospectively studied.
In order to avoid the effect of neoadjuvant on protein
expression, the patients were excluded if they received
either radiotherapy or chemotherapy before operation.
Tissue samples were obtained from CCA patients and
kept in the BioBank of the Cholangiocarcinoma Research Institute. The clinical information was assessed in
all CCA patients including sex, age, tumor location, histology, size of primary tumor (T stage), lymph node metastasis status (N stage), distant metastasis status (M
stage), and TNM staging. In addition, tumor makers
(carbohydrate antigen 19-9; CA19–9 and carcinoembryonic antigen; CEA) were examined in pre-operative
serum.
For the recurrence, first year after surgery, all CCA
patients were followed-up every 3 months and every 6
months thereafter. Post-operative recurrence was
defined in the patients who developed new tumor which
confirmed by computed tomography (CT)/magnetic resonance imaging (MRI). The interval between the date of
operation until the date of recurrence or until the last of
follow-up was defined as recurrence-free survival (RFS)
and the interval between the date of operation until the
date of death or until the last of follow-up was defined
as overall survival (OS). Early recurrence was defined if
patients developed the new tumor within 1 year after
Padthaisong et al. BMC Cancer
(2020) 20:154
surgery, while late recurrence was defined if patients developed the new tumor after 1 year. This study was approved by the Human Research Ethics Committees,
Khon Kaen University, Thailand (HE611412).
Antibodies
The antibodies used in this study were as follows:
EGFR (1:50; # ab52894), HER3 (1:25; # ab5470),
HER4 (1:150; # ab19391), VEGFR3 (1:100; # ab27278),
VEGF-C (1:50; # ab135506), Wnt5a (1:100; #
ab72583), Beta-Catenin (1:100; # ab32572), p-Akt1 (1:
100; # ab32505), Akt1 (1:50; #ab59380) were purchased from Abcam company, UK. HER2 (1:100,
#4290) was purchased from Cell Signaling Technology,
Inc., USA. EphrinA1 (1:100; # sc-911) and EphA3 (1:100;
# sc-920) were purchased from Santa Cruz Biotechnology,
USA. Horseradish peroxidase (HRP)-conjugated secondary antibodies (Dako EnVision, USA).
Immunohistochemical staining (IHC)
A CCA tissue microarray (TMA) was prepared from two
independent puncture from each patient and cut into
4 μm for each section. The expression of protein was investigated using IHC. Briefly, the sections were deparaffinized with xylene and rehydrated with stepwise of
100, 90, 80 and 70% ethanol, respectively. Microwave
cooking was used for antigen retrieval for 10 mins. Then
tissue sections were incubated with 0.3% hydrogen peroxide followed by 10% skim milk for 30 mins of each in
order to inhibited endogenous hydrogen peroxide
activity, and nonspecific binding. After washing the sections were incubated with primary antibodies at room
temperature for 1 h followed by 4 °C overnight. The excess antibodies were washed for 3 times using phosphate
buffered saline (PBS) with 0.1% tween20 followed by
Page 3 of 16
PBS for 5 mins of each. The sections were then incubated with HRP-conjugated secondary antibodies for 1 h,
and the excess antibodies were also washed using PBS
with 0.1% tween20 followed by PBS for 5 mins of each.
A 3, 3’diaminobenzidine tetrahydrochloride (DAB) substrate kit (Vector Laboratories, Inc., CA) was used to develop the signal. The tissues were then counterstained
using hematoxylin for 2 mins. After washing, the tissue
sections were dehydrated with stepwise of 70, 80, 90,
100% ethanol and xylene, respectively. Tissue sections
were mounted with permount, and finally observed
under light microscopy.
Immunohistochemical (IHC) scoring
The expression of each protein was scored based on intensity and frequency which is the proportion of positive
cells stanning. The intensity of protein expression was
classified into four levels including 0 = negative, 1 =
weak, 2 = moderate, and 3 = strong stanning. The proportion of positive cells stanning was semi-qualitatively,
and classified into negative = 0%, 1 = 1–25%, 2 = 26–50%,
and 3 = more than 50% positive stanning. The grading
score was calculated by multiplying between intensity
and frequency, and the minimum score was 0 while the
maximum score was 9. The grading score of each patient
was calculated from the average value of two independent punctures. Finally, the median value was calculated
from all cases and used as cut-off point. The patients
having a grading score lower, equal to or higher than the
median was classified as the low or high expression
group, respectively. For the proteins which have a median equal to zero, the patients have a grading score
equal to zero, being classified as the negative group,
while those with a grading score above zero are classified
as the positive group.
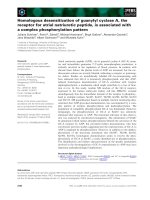
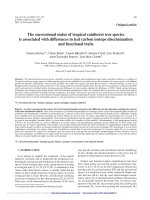
Fig. 1 Heatmap showing patients characteristics and expression levels of 190 CCA patients. Top rows indicate clinical characteristics of patients.
Bottom rows indicate the expression levels of 12 protein kinases
Padthaisong et al. BMC Cancer
(2020) 20:154
Page 4 of 16
Table 1 Summary of initial recurrence locations in CCA patients
Recurrence location
Number of CCA patients (%)
Locoregional recurrence
Surgical bed
1 (1.7%)
Anastomosis liver bed
4 (6.9%)
Lymph node
5 (8.6%)
Lymph node and anastomosis liver bed
3 (5.2%)
Distant recurrence/combination between locoregional recurrence with distant recurrence
Liver
10 (17.2%)
Lung
3 (5.2%)
Peritoneum
5 (8.6%)
Mesentery
1 (1.7%)
Skin
4 (6.9%)
Bone
1 (1.7%)
Brain
1 (1.7%)
Liver and lymph node
5 (8.6%)
Liver and anastomosis liver bed
1 (1.7%)
Lung and lymph node
1 (1.7%)
Lung and peritoneum and lymph node and bone
1 (1.7%)
Liver and peritoneum
2 (3.4%)
Lung and liver and lymph node
1 (1.7%)
Peritoneum and lymph node
2 (3.4%)
Liver and anastomosis liver bed and peritoneum
1 (1.7%)
Lung and anastomosis liver
1 (1.7%)
Lung and surgical bed
1 (1.7%)
Liver and peritoneum and lymph node
1 (1.7%)
Lung and liver and peritoneum
1 (1.7%)
Liver and skin
1 (1.7%)
Peritoneum and surgical bed
1 (1.7%)
Total
Statistical analysis
Statistical Package for the Social Science; SPSS software
v.25 was used to analyze data in this study. Chi-square
test was used to analyze the correlation between protein
kinase expression with recurrence status and clinicopathological characteristics of CCA patients. The difference in IHC score and tumor marker levels on
58 (100%)
recurrence and recurrence location was analyzed using
the Kruskal-Wallis test and Mann-Whitney U-test.
Kaplan-Meier (log-rank) analysis was used to analyze
RFS and OS. The predictive ability of protein kinases on
RFS and OS was analyzed by Cox proportional hazards
regression. Statistical significance was considered if
p-value less than 0.05.
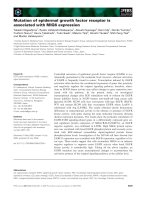
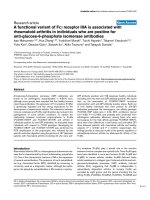
Fig. 2 The representative figures of IHC staining, ×200 and the percentages of high/positive and low/negative expression. High/positive and low/
negative expression of protein kinases were shown in the upper and lower panel, respectively. The percentages of high/positive and low/
negative expression were shown in the white boxes
Padthaisong et al. BMC Cancer
(2020) 20:154
Page 5 of 16
Table 2 The correlation of 12 protein kinases and post-operative recurrence of CCA patients
Protein
kinases
Early
recurrence
Late
recurrence
No
recurrence
n = 31
n = 27
n = 132
Low
14 (45)
19 (70)
88 (67)
High
17 (55)
8 (30)
44 (33)
Low
14 (45)
7 (26)
64 (49)
High
17 (55)
20 (74)
68 (51)
p value
Early vs No
recurrence
Late vs No
recurrence
Early vs Late
recurrence
EGFR
0.038
0.824
0.067
0.842
0.035
0.174
0.674
1.000
0.781
0.033
0.495
0.300
0.372
0.493
1.000
1.000
0.387
0.583
0.008
0.384
0.292
0.690
0.674
1.000
0.225
0.029
0.378
1.000
1.000
1.000
0.603
1.000
0.720
0.731
1.000
1.000
1.000
1.000
NA
1.000
0.095
0.192
HER2
HER3
Low
22 (71)
18 (67)
86 (65)
High
9 (29)
9 (33)
46 (35)
Low
15 (48)
17 (63)
93 (71)
High
16 (52)
10 (37)
39 (29)
HER4
VEGFR3
Low
25 (81)
21 (78)
93 (71)
High
6 (19)
6 (22)
39 (29)
Low
12 (39)
8 (30)
54 (41)
High
19 (61)
19 (70)
78 (59)
Low
12 (39)
15 (56)
86 (65)
High
19 (61)
12 (44)
46 (35)
Low
16 (52)
14 (52)
61 (46)
High
15 (48)
13 (48)
71 (54)
Low
9 (29)
5 (19)
55 (42)
High
22 (71)
22 (81)
77 (58)
Low
16 (52)
14 (52)
66 (50)
High
15 (48)
13 (48)
66 (50)
VEGF-C
EphA3
EphrinA1
p-Akt1
Akt1
Cytoplasmic beta-catenin
Negative
27 (87)
22 (82)
108 (82)
Positive
4 (13)
5 (18)
24 (18)
Membranous beta-catenin
Negative
28 (90)
25 (93)
121 (92)
Positive
3 (10)
2 (7)
11 (8)
Nuclear beta-catenin
Negative
31 (100)
27 (100)
129 (98)
Positive
0 (0)
0 (0)
3 (2)
Low
16 (52)
9 (33)
68 (51)
High
15 (48)
18 (67)
64 (49)
Wnt5a
EGFR Epidermal growth factor receptor, HER Human epidermal growth factor receptor, VEGFR3 Vascular endothelial growth factor receptor 3, VEGF-C
Vascular endothelial growth factor-C, EphA3 Erythropoietin-producing hepatocellular carcinoma receptor type-A3, p-Akt1: Phosphor-serine/threonine kinase
1, Akt1 Serine/threonine kinase 1, Wnt5a Protein Wnt5a, NA Not applicable
Padthaisong et al. BMC Cancer
(2020) 20:154
Page 6 of 16
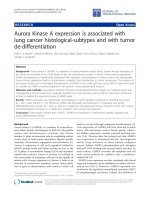
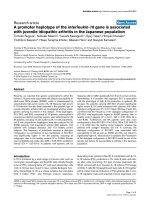
Fig. 3 The expressing levels of protein kinases in patients with and without recurrence, and in the different recurrence location. a, The expressing
levels of EGFR, HER2, HER4, EphA3 and p-Akt1 in different group of CCA patients which are no-recurrence (No, n = 132), late recurrence (Late, n =
27) and early recurrence (Early, n = 31). b, The expressing levels of EGFR, HER2, HER4, EphA3 and p-Akt1 in different recurrence location,
locoregional (n = 13) and distant recurrence/combination between locoregional recurrence with distant recurrence (n = 45). p-value less than 0.05
was considered as statistical significance
Table 3 The correlation of EGFR, HER2, HER4, EphA3 and p-Akt1 expression with clinicopathological data
Variable
p
EGFR
p
HER2
Low
High
p
HER4
Low
High
Low
High
Female
43 (36)
24 (35) 1.000 28 (33) 39 (37) 0.647 42 (34)
25 (39)
Male
78 (64)
45 (65)
83 (66)
40 (61)
< 61
60 (50)
32 (46) 0.763 37 (44) 55 (52) 0.245 61 (49)
31 (48)
≥ 61
61 (50)
37 (54)
34 (52)
61 (50)
44 (64) 0.095 48 (56) 57 (54) 0.771 64 (51)
41 (63)
25 (36)
61 (49)
24 (37)
p
EphA3
Low
High
p
p-Akt1
Low
High
Sex
57 (67) 66 (63)
0.525
40 (35)
27 (35) 1.000 25 (36) 42 (35)
73 (65)
50 (65)
55 (49)
36 (47) 0.768 38 (55) 54 (45)
57 (51)
41 (53)
0.875
44 (64) 79 (65)
Age (year)
48 (56) 50 (48)
64 (51)
1.000
0.177
31 (45) 67 (55)
Tumor location
Intrahepatic
Extrahepatic 60 (50)
37 (44) 48 (46)
0.127
63 (56)
42 (55) 0.883 35 (51) 70 (58)
50 (44)
35 (45)
48 (42)
33 (43) 1.000 27 (39) 54 (45)
65 (58)
44 (57)
68 (60)
41 (53) 0.372 44 (64) 65 (54)
45 (40)
36 (47)
0.366
34 (49) 51 (42)
Histology
Papillary
55 (46)
26 (38) 0.360 34 (40) 47 (45) 0.557 54 (43)
27 (42)
Others
66 (54)
43 (62)
71 (57)
38 (58)
51 (60) 58 (55)
0.878
0.542
42 (61) 67 (55)
Primary tumor (T)
I, II
75 (62)
34 (49) 0.096 50 (59) 59 (56) 0.769 77 (62)
32 (49)
III, IV
46 (38)
35 (51)
33 (51)
35 (41) 46 (44)
48 (38)
0.122
0.222
25 (36) 56 (46)
Lymph nodes metastasis (N)
No
67 (55)
38 (55) 1.000 46 (54) 59 (56) 0.883 76 (61)
29 (45) 0.045 66 (58)
39 (51) 0.302 37 (54) 68 (56)
Yes
54 (45)
31 (45)
36 (55)
38 (49)
39 (46) 46 (44)
49 (39)
47 (42)
0.763
32 (47) 53 (44)
Distant metastasis (M)
No
112 (93) 67 (97) 0.333 81 (95) 98 (93) 0.757 117 (94) 62 (95)
Yes
9 (7)
2 (3)
I, II
53 (44)
23 (33) 0.169 35 (41) 41 (39) 0.768 56 (45)
20 (31)
III, IV
68 (56)
46 (67)
45 (69)
4 (5)
7 (7)
8 (6)
0.752
3 (5)
105 (93) 74 (96) 0.530 66 (96) 113 (93) 0.749
8 (7)
3 (4)
3 (4)
8 (7)
47 (42)
29 (38) 0.652 31 (45) 45 (37)
66 (58)
48 (62)
TNM Stage
50 (59) 64 (61)
69 (55)
0.064
0.356
38 (55) 76 (63)
EGFR Epidermal growth factor receptor, HER Human epidermal growth factor receptor, EphA3 Erythropoietin-producing hepatocellular carcinoma receptor type-A3,
TNM Size of primary tumor-node metastasis-distant metastasis
Padthaisong et al. BMC Cancer
(2020) 20:154
Page 7 of 16
Results
Patterns of recurrence
Patients characteristics
Among 190 cases, post-operative recurrence was detected in 58 cases (31%) of patients. In this study, pattern of recurrence was divided into locoregional
recurrence (22.4%), distant recurrence and combination
between locoregional recurrence with distant recurrence
(77.6%) (Fig. 1). Locoregional recurrence was defined as
a relapse in lymph node (8.6%), anastomosis liver bed
(6.9%), and surgical bed (1.7%). In addition, distant recurrence was defined when tumor was detected in other
locations including liver (17.2%), lung (5.2%), peritoneum (8.6%), mesentery (1.7%), skin (6.9%), bone (1.7%),
and brain (1.7%). Moreover, the multiple recurrences
were also detected, and the patterns of recurrence was
summarized in Table 1.
A total of 190 CCA patients (35% female and 65%
male) were recruited in the current study. The median of age was 61 years (rang between 39 and 82).
55% of patients were classified as intrahepatic CCA
cases while 45% were extrahepatic CCA cases. 43% of
patients were characterized as papillary type and 57%
were other types. Size of primary tumor (T) was also
classified and 57% of patients were T stage I and II,
whereas 43% were T stage III and IV. From 190 patients, lymph node (N) and distant (M) metastasis
were shown in 55 and 6% of patients, respectively.
TNM staging was also characterized according to size
of primary tumor, lymph node and distant metastasis
status. In this study, 40% of patients were stage I and
II and 60% were stage III and IV and recurrence after
surgery was also detected in 31% (Fig. 1) (Table S1).
Among patients with recurrence, 53% were classified
as early recurrence while 47% were late recurrence.
The median follow-up was 16, 28, and 13 months for
no recurrence, late recurrence and early recurrence
groups, respectively.
The correlation of protein kinases with post-operative
recurrence and clinicopathological characteristics
In the present study, 12 protein kinases including EGFR,
HER2, HER3, HER4, VEGFR3, VEGF-C, EphA3,
EphrinA1, p-Akt1, Akt1, beta-catenin and Wnt5a were
examined in CCA tissues obtained from190 cases using
IHC. The expression of each protein was defined as high
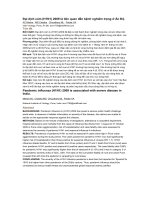
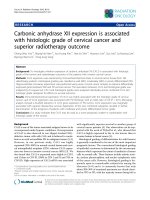
Fig. 4 The levels of serum tumor markers in patients with and without recurrence, and in the different recurrence location. a, the levels
of CA19–9 and CEA in different group of CCA patients which are no-recurrence (No, n = 81), late recurrence (Late, n = 19) and early
recurrence (Early, n = 19). b, the levels of CA19–9 and CEA in different recurrence location, locoregional (n = 11) and distant recurrence/
combination between locoregional recurrence with distant recurrence (n = 27). p-value less than 0.05 was considered as
statistical significance
Padthaisong et al. BMC Cancer
(2020) 20:154
Page 8 of 16
Table 4 Correlation coefficients between
immunohistochemistry result of protein kinases
EGFR Correlation coefficient
p
HER2 Correlation coefficient
p
HER4 Correlation coefficient
p
EphA3 Correlation coefficient
p
HER2
HER4
EphA3
p-Akt1
0.195
0.332
0.268
−0.044
0.007 3.0 × 10⁻⁶ 1.8 × 10− 4 0.545
0.180
0.096
0.025
0.013
0.186
0.735
0.399
−0.078
1.2 × 10⁻⁸
0.283
− 0.023
0.752
EGFR Epidermal growth factor receptor, HER Human epidermal growth factor
receptor, EphA3: Erythropoietin-producing hepatocellular carcinoma receptor
type-A3, p-Akt1 Phosphor-serine/threonine kinase 1
and low expression or positive and negative. The expression in individual patients was showed in Fig. 1. High
expression of EGFR, HER2, HER3, HER4, VEGFR3,
VEGF-C, EphA3, EphrinA1, p-Akt1, Akt1, beta-catenin
and Wnt5a were 36, 55, 34, 34, 27, 61, 41, 52, 64, 49, 17
and 51%, respectively (Fig. 2). The expressions of all
proteins were analyzed with post-operative recurrence
including early and late recurrence in order to identify
proteins that can be used for the prediction of tumor recurrence. In addition, the expression of beta-catenin was
examined in the different cellular compartments, cytoplasm, membrane and nucleus. Positive expression of
beta-catenin in cytoplasm, membrane and nucleus were
17, 8 and 2%, respectively. Among 12 protein kinases,
the expression of EGFR, HER4, and EphA3 was significantly associated with early recurrence (p = 0.038: p =
0.033: p = 0.008; Table 2), while HER2 and p-Akt1 were
significantly correlated with late recurrence (p = 0.035:
p = 0.029; Table 2). In contrast, there was no correlation
between HER3, VEGFR3, VEGF-C, EphrinA1, Akt1,
beta-catenin, Wnt5a and post-operative recurrence
(Table 2).
The IHC scores of EGFR, HER2, HER4, EphA3 and pAkt1 were also compared between patients with and
without recurrence. The IHC score of EGFR was significantly different between patients with early recurrence
compared with late or without recurrence (p = 0.029:
p = 0.024; Fig. 3a). The IHC scores of HER2 and p-Akt1
Fig. 5 Correlogram of 12 protein kinase expression with clustering analysis performed in MetaboAnalyst 4.0. Data was analysed using Pearson
correlation analysis. Correlation coefficient was indicated in each coloured cell on the map. The scale code shown on the right side (red and blue
colours indicate positive and negative correlations, respectively.)
Padthaisong et al. BMC Cancer
(2020) 20:154
Page 9 of 16
Fig. 6 Kaplan-Meier analysis for RFS and OS according to EGFR, HER2, HER4, EphA3, and p-Akt1 expression. Upper panel, the prognostic
significantly of EGFR, HER2, HER4, EphA3, and p-Akt1on RFS. Lower panel, the prognostic significantly of EGFR, HER2, HER4, EphA3, and p-Akt1on
OS. p-value less than 0.05 was considered as statistical significance
were significantly higher in patients with late recurrence
compared with no-recurrence (p = 0.002: p = 0.013; Fig.
3a), while IHC scores of HER4 and EphA3 were significantly higher in patients with early recurrence compared
with no-recurrence (p = 0.003: p = 0.004; Fig. 3a). On the
contrary, there was no difference between IHC scores of
HER3, VEGFR3, VEGF-C, Ehprin-A1, Akt1, beta-catenin
and Wnt5a (Fig. S1 and S2). The IHC scores of these
proteins were also analyzed with recurrent location. The
expressing level of p-Akt1 was significantly higher in the
patients with distant recurrence/combination between
locoregional recurrence with distant recurrence compared with locoregional recurrence (p = 0.004; Fig. 3b),
while there was no statistical difference in EGFR, HER2,
HER4 and EphA3 (Fig. 3b). The expression levels of
EGFR, HER2, HER4, EphA3 and p-Akt1 were also analyzed with clinicopathological characteristics. Our finding only showed the sigfinicant correlation between
expression of HER4 and lymph node metastasis
(p = 0.045; Table 3).
Fig. 7 Kaplan-Meier analysis for RFS and OS according to the combined of two protein kinase expression. Upper and lower panels demonstrated
the prognostic significantly of the combined of two protein kinase expression on RFS and OS, respectively. High and high represented the
patients with high expression of two proteins, while other represented the patients with at least one protein low expression. p-value less than
0.05 was considered as statistical significance
Padthaisong et al. BMC Cancer
(2020) 20:154
Page 10 of 16
Fig. 8 Kaplan-Meier analysis for RFS and OS according to the combined of three protein kinase expression (EGFR, HER4 and EphA3). Upper and
lower panels demonstrated the prognostic significantly of the combined of three protein kinase expression or the combined of three protein
kinase expression with CA19–9 level on RFS and OS, respectively. 0–1 marker high represented the patients with all markers low or one marker
high, 2–3 markers high represented the patients with at least two markers high, others represented three groups of patients (0–1 marker high
and CA19–9 low, 0–1 marker high and CA19–9 high or 2–3 markers high and CA19–9 low). p-value less than 0.05 was considered as
statistical significance
Table 5 Univariate analysis of factors predicting recurrence-free and overall survival
Variable
Recurrence-free survival
HR
95% CI
Overall survival
p
HR
95% CI
p
Sex (Male vs Female)
1.159 0.856–1.569 0.340
1.132 0.837–1.532 0.422
Age (≥61 vs < 61)
1.144 0.858–1.525 0.359
1.302 0.975–1.737 0.073
Tumor location (Extra. Vs Intra.)
0.852 0.639–1.136 0.276
0.823 0.617–1.099 0.186
Histology (Others vs Papillary)
1.221 0.914–1.631 0.176
Primary tumor (T) (III/IV vs I/II)
2.474 1.811–3.378 1.2 × 10
1.111 0.832–1.483 0.476
−8
2.520 1.853–3.426 3.7 × 10⁻⁹
−6
2.180 1.614–2.946 3.8 × 10⁻⁷
Lymph nodes metastasis (N) (Yes vs No)
1.968 1.459–2.655 9.0 × 10
Distant metastasis (M) (Yes vs No)
1.783 0.967–3.289 0.064
TNM Stage (III/IV vs I/II)
2.387 1.738–3.278 7.6 × 10⁻⁸ 2.564 1.865–3.525 6.7 × 10− 9
EGFR (High vs Low)
1.593 1.173–2.164 0.003
1.452 1.071–1.969 0.016
HER4 (High vs Low)
1.646 1.207–2.244 0.002
1.412 1.042–1.914 0.026
EphA3 (High vs Low)
1.465 1.091–1.966 0.011
1.424 1.060–1.913 0.019
Protein panela (2–3 markers high vs Othersb)
1.746 1.281–2.380 4.2 × 10− 4 1.476 1.087–2.003 0.013
Combined of protein panel and CA19–9 level (2–3 markers high and CA19–9 high
vs Othersc)
2.435 1.512–3.921 2.5 × 10− 4 1.849 1.166–2.932 0.009
2.093 1.133–3.869 0.018
TNM Size of primary tumor-node metastasis-distant metastasis, EGFR Epidermal growth factor receptor, HER Human epidermal growth factor receptor, EphA3
Erythropoietin-producing hepatocellular carcinoma receptor type-A3, Protein panela: the expression of EGFR, HER4 and EphA, Othersb: 0–1 marker high, Othersc:
three groups of patients (0–1 marker high and CA19–9 low, 0–1 marker high and CA19–9 high or 2–3 markers high and CA19–9 low)
Padthaisong et al. BMC Cancer
(2020) 20:154
Page 11 of 16
The correlation of tumor maker level with post-operative
recurrence
The correlation of EGFR, HER2, HER4, EphA3, p-Akt1 and
their prognostic significance
Since tumor markers were also used to monitor patients after treatment. Therefore, in the present study,
CA19–9 and CEA levels were analyzed with tumor
recurrence. The result revealed that the level of
CA19–9 was significantly higher in early recurrence
compared with no-recurrence (p = 0.017) (Fig. 4a),
whereas there was no difference between CEA level
in patients with and without recurrence (Fig. 4a). In
addition, the levels of CA19–9 and CEA were also
analyzed with recurrence location. All markers were
likely to increase in distant recurrence/combination
between locoregional recurrence with distant recurrence, compared with locoregional recurrence.
However, there was no such statistically significant
correlation in this study (Fig. 4b).
The correlations between EGFR, HER2, HER4, EphA3
and p-Akt1 were explored. The expression of EGFR was
highly correlated with HER4 (p = 3.0 × 10− 6) and EphA3
(p = 1.8 × 10− 4). In addition, the expression of HER4 was
also highly correlated with EphA3 (p = 1.2 × 10− 8). A
positive correlation of HER2 with EGFR (p = 0.007) and
HER4 (p = 0.013) was also found. On the other hand,
there was no significant correlation between p-Akt1 and
the other proteins (Table 4). Moreover, pearson correlation analysis on 12 protein kinases was also explored.
There was a strong correlation between EGFR, HER4
and EphA3. (Fig. 5).
The above results demonstrate that the expression of
EGFR, HER2, HER4, EphA3 and p-Akt1 was significantly
associated with post-operative recurrence. Thus, the
Table 6 Multivariate analysis of factors predicting recurrence-free survival
Variable
Recurrence-free survival
HR
95% CI
p
2.058
1.364–3.104
0.001
Model A
Primary tumor (T) (III/IV vs I/II)
Lymph nodes metastasis (N) (Yes vs No)
1.617
1.083–2.413
0.019
TNM Stage (III/IV vs I/II)
1.107
0.654–1.873
0.705
EGFR (High vs Low)
1.542
1.131–2.103
0.006
Primary tumor (T) (III/IV vs I/II)
2.000
1.312–3.047
0.001
Lymph nodes metastasis (N) (Yes vs No)
1.459
0.963–2.211
0.075
Model B
TNM Stage (III/IV vs I/II)
1.158
0.668–2.009
0.601
HER4 (High vs Low)
1.388
1.011–1.906
0.042
1.977
1.296–3.017
0.002
Model C
Primary tumor (T) (III/IV vs I/II)
Lymph nodes metastasis (N) (Yes vs No)
1.467
0.967–2.225
0.071
TNM Stage (III/IV vs I/II)
1.242
0.712–2.168
0.445
EphA3 (High vs Low)
1.469
1.091–1.977
0.011
Model D
Primary tumor (T) (III/IV vs I/II)
1.918
1.255–2.931
0.003
Lymph nodes metastasis (N) (Yes vs No)
1.480
0.979–2.240
0.063
TNM Stage (III/IV vs I/II)
1.193
0.686–2.073
0.531
Protein panela (2–3 markers high vs Othersb)
1.528
1.116–2.091
0.008
3.275
1.710–6.273
3.5 × 10⁻⁴
Model E
Primary tumor (T) (III/IV vs I/II)
Lymph nodes metastasis (N) (Yes vs No)
1.749
1.017–3.009
0.043
TNM Stage (III/IV vs I/II)
0.660
0.292–1.496
0.320
Combined of protein panel and CA19–9 level (2–3 markers high and CA19–9 high vs Othersc)
2.080
1.270–3.405
0.004
TNM Size of primary tumor-node metastasis-distant metastasis, EGFR Epidermal growth factor receptor, HER Human epidermal growth factor receptor, EphA3
Erythropoietin-producing hepatocellular carcinoma receptor type-A3, Protein panela: the expression of EGFR, HER4 and EphA3, Protein panela: the expression of
EGFR, HER4 and EphA, Othersb: 0–1 marker high, Othersc: three groups of patients (0–1 marker high and CA19–9 low, 0–1 marker high and CA19–9 high or 2–3
markers high and CA19–9 low)
Padthaisong et al. BMC Cancer
(2020) 20:154
expression of these proteins was then used to investigate
their prognostic ability. Patients with high expression of
EGFR, HER4 or EphA3 have shorter RFS (p = 0.003: p =
0.001: 0.010; Fig. 6) and OS (p = 0.016: p = 0.025: 0.018;
Fig. 6), compared with those patients with low expression. However, there was no significance found in HER2
and p-Akt1 (Fig. 6). Because the expressing levels of
EGFR, HER4 and EphA3 were highly correlated with
each other, their expressing levels were also associated
with patient prognosis. Therefore, the combination of
these proteins was also analyzed with patient prognosis.
High expression of the protein pairs, EGFR and HER4,
Page 12 of 16
EGFR and EphA3, and HER4 and EphA3 was significantly associated with shorter RFS (p = 0.001: p = 0.008:
p = 4.0 × 10− 4; Fig. 7). High expression of EGFR and
HER4, HER4 and EphA3 was also associated with a
shorter OS (p = 0.043: p = 0.002; Fig. 7). In addition, patients who had high expression of two and three proteins
were significantly associated with shorter RFS (p = 3.5 ×
10− 4; Fig. 8) and OS (p = 0.012; Fig. 8). The level of
tumor marker CA19–9 was also correlated with tumor
relapse. Thus, the prognostic efficiency of the combination of protein kinases expression and tumor marker
level was also explored. It was significantly associated
Table 7 Multivariate analysis of factors predicting overall survival
Variable
Overall survival
HR
95% CI
p
Model A
Primary tumor (T) (III/IV vs I/II)
2.056
1.335–3.166
0.001
Lymph nodes metastasis (N) (Yes vs No)
1.750
1.152–2.660
0.009
Distant metastasis (M) (Yes vs No)
1.146
0.599–2.192
0.680
TNM Stage (III/IV vs I/II)
1.100
0.632–1.915
0.735
EGFR (High vs Low)
1.450
1.063–1.978
0.019
Model B
Primary tumor (T) (III/IV vs I/II)
1.991
1.286–3.084
0.002
Lymph nodes metastasis (N) (Yes vs No)
1.642
1.067–2.526
0.024
Distant metastasis (M) (Yes vs No)
1.106
0.577–2.119
0.761
TNM Stage (III/IV vs I/II)
1.149
0.650–2.032
0.632
HER4 (High vs Low)
1.198
0.875–1.641
0.259
Model C
Primary tumor (T) (III/IV vs I/II)
1.931
1.243–3.002
0.003
Lymph nodes metastasis (N) (Yes vs No)
1.594
1.026–2.446
0.038
Distant metastasis (M) (Yes vs No)
1.159
0.604–2.223
0.657
TNM Stage (III/IV vs I/II)
1.224
0.686–2.182
0.494
EphA3 (High vs Low)
1.372
1.014–1.855
0.040
Model D
Primary tumor (T) (III/IV vs I/II)
1.925
1.237–2.995
0.004
Lymph nodes metastasis (N) (Yes vs No)
1.631
1.060–2.509
0.026
Distant metastasis (M) (Yes vs No)
1.134
0.591–2.176
0.706
TNM Stage (III/IV vs I/II)
1.178
0.665–2.089
0.574
1.269
0.926–1.738
0.138
Primary tumor (T) (III/IV vs I/II)
4.006
2.033–7.893
6.0 × 10⁻⁵
Lymph nodes metastasis (N) (Yes vs No)
2.055
1.160–3.640
0.014
Distant metastasis (M) (Yes vs No)
0.781
0.323–1.888
0.583
TNM Stage (III/IV vs I/II)
0.604
0.262–1.389
0.235
1.490
0.922–2.406
0.103
a
b
Protein panel (2–3 markers high vs Others )
Model E
c
Combined of protein panel and CA19–9 level (2–3 markers high and CA19–9 high vs Others )
TNM: Size of primary tumor-node metastasis-distant metastasis, EGFR Epidermal growth factor receptor, HER Human epidermal growth factor receptor, EphA3
Erythropoietin-producing hepatocellular carcinoma receptor type-A3, Protein panela: the expression of EGFR, HER4 and EphA3, Protein panela: the expression of
EGFR, HER4 and EphA, Othersb: 0–1 marker high, Othersc: three groups of patients (0–1 marker high and CA19–9 low, 0–1 marker high and CA19–9 high or 2–3
markers high and CA19–9 low)
Padthaisong et al. BMC Cancer
(2020) 20:154
with shorter RFS (p = 1.5 × 10− 4; Fig. 8) and OS (p =
0.008; Fig. 8).
Independent prognostic value of EGFR, HER4 and EphA3
In order to investigate whether EGFR, HER4 and EphA3
could be used as prognostic factors, independent of clinicopathological characteristics, Cox regression analysis
was used. The univariate result for factors predicting the
RFS and OS is shown in Table 5. Multivariate Cox regression for RFS and OS was analyzed using the different models that are summarized in Table 6 and Table 7.
The result demonstrated that EGFR, HER4 and EphA3
were the independent prognostic factors for RFS (HR:
1.542; p = 0.006, HR:1.388; p = 0.042, HR: 1.469; p =
0.001; Table 6). EGFR and EphA4 were also independent
prognostic factors for OS (HR: 1.450; p = 0.019, HR:
1.372; p = 0.040; Table 7). The combination of high
Page 13 of 16
expression of two and three markers or the high expression of two and three markers with high level of CA19–
9 could be used to improve the predictive ability for RFS
(HR: 1.528; p = 0008, HR: 2.080; p = 0.004; Table 6).
Moreover, the patients were stratified more accurately
when analyzed using the combintion of protein kinase
expression and primary tumor (T) or lymph node metastasis (N) status. The patients with high stage T and high
expression of two and three markers or high expression
of two and three markers with high level of CA19–9
have shorter RFS, compared with other groups (p =
2.1 × 10− 9: p = 6.9 × 10− 9; Fig. 9). Similarly, patients with
lymph node metastasis and high expression of two and
three markers or high expression of two and three
markers with a high level of CA19–9 have shorter RFS
compared with other groups (p = 9.0 × 10− 7: p = 3.8 ×
10− 5; Fig. 9).
Fig. 9 Kaplan-Meier analysis for RFS according to the combination of three protein kinase expression (EGFR, HER4 and EphA3) and
clinicopathological features. 0–1 marker high represented the patients with all markers low or one marker high, 2–3 markers high represented the
patients with at least two markers high, others represented three groups of patients (0–1 marker high and CA19–9 low, 0–1 marker high and
CA19–9 high or 2–3 markers high and CA19–9 low). T represented the primary tumor stage, N represented the lymph node metastasis status (N0:
no lymph node metastasis, N1: lymph node metastasis). p-value less than 0.05 was considered as statistical significance
Padthaisong et al. BMC Cancer
(2020) 20:154
Discussion
The treatment of CCA is challenging since most of the
patients were diagnosed when the disease reaches advance stage. Surgical resection is, nowadays, only curative method for CCA treatment, and usually suitable for
patients in early stage [17]. Some patients also receive
adjuvant chemotherapy or radiotherapy for improving
patient’s survival [18]. However, many patients developed tumor recurrence even with complete resection
[4]. The recurrence rates of CCA were shown differently
depending on the studies of which the rates were reported between 29 and 80% [4, 5, 19]. In this study, the
recurrence rate was 31%. Recurrence was found in both
locoregional and distant recurrence, and most of
patients developed distant recurrence. Among the
patients with distant recurrence, the highest recurrence
rate was found in the liver followed by peritoneum. Our
finding is consistent with the previous study exhibiting
that the common site of recurrence was distant recurrence with accounting for 54.3%. Among them, liver
(43%) and peritoneum (26.3%) were the common sites of
recurrence, resulting from the hematogenous spread of
tumor [20].
Since tumor recurrence affects the outcome of cancer
patients, there are several studies thus focused on an
identification of marker which can predict tumor recurrence. Clinical features of patient were previously reported as predictor for CCA recurrence including tumor
size, lymph node metastasis [21, 22], lymphatic infiltration, bile duct invasion, intrahepatic metastasis [23]. This
is consistent with our study, demonstrating the primary
tumor together with the presence of lymph node metastasis that effectively indicate the prognostic factor for
CCA recurrence. However, biomarkers are still needed
because the absence or presence of these markers can be
used to predict the outcome of patients and could be
useful for targeted therapy to prevent the worse outcome
of patients.
EGFR family is known as protein kinases which are involved in many cellular processes via the activation of
various downstream pathways [24]. The EGFR family
consists of four members: EGFR (HER1), HER2, HER3
and HER4. The overexpression of EGFR is more commonly found in the primary tumor stages III/IV than I/II
[25], and has been previously identified as a predictor of
tumor recurrence [26–28]. Moreover, knockdown of
EGFR expression could reduce the colony formation, migration and proliferation of colorectal cancer (CRC) [27].
These suggest that elevated EGFR is associated with
tumor aggressiveness. Our study confirms the predictive
value of this protein, even though a significant correlation between EGFR and clinicopathological features
was not observed. In the EGFR family, the function and
predictive ability of HER4 is poorly understood,
Page 14 of 16
compared with other members. HER4 is known because
of its role on cancer progression. High expression of
HER4 was also correlated with in triple negative breast
cancer recurrence [29]. We found that HER4 expression
was correlated with CCA recurrence and associated with
shorter RFS and OS. Our finding is consistent with the
previous report which explored the mechanism of tumor
relapse after treatment. They found that activation of
ligand-dependent HER4 signal plays an important role
in tumor relapse via induce chemoresistance [30]. Eph
receptor is another receptor tyrosine kinase which has
been studied in CCA. The interaction of Eph receptor
and ephrin ligand associated with the modification of
actin cytoskeleton, adhesion, as well as cell shape [31].
In addition, upregulation of EhpA3 has also been reported to associate with tumor metastasis and recurrence in gastric cancer [32]. The previous study,
exploring the mechanism underlying Eph receptor induce cancer recurrence demonstrated that co-expression
of EphA2 and EphA3 led to the high clonogenicity and
tumorigenic potential in recurrence of glioblastoma
which has been shown in both in vitro and in vivo
models. Moreover, co-targeting of EphA2 and EphA3
could also reduce clonogenic ability and tumorigenesis
[33]. This may be confirmed by our study which also
showed the association between EhpA3 and CCA
recurrence.
Serum tumor marker, the well-established marker for
monitoring tumor, is normally used for monitoring the
progression of several types of cancer. In CCA, CA19–9
and CEA are the most widely used to monitor the outcome of CCA patients [34], even though it is not specific
to only CCA. In this study, we also analyzed the association between CA19–9 and CEA levels with tumor recurrence. Among them, CA19–9 level was found higher
in patients with recurrence than those without recurrence. Similarly, to another study which reported that
CA19–9, it was shown as the independent prognosis
factor for CCA recurrence [7].
A panel of three proteins (PI3K-p85α, EGFR and p53)
has been identified as the independent prognostic factor
in esophageal squamous cell carcinoma (ESCC), and the
combination of a three protein panel with clinicopathological parameters, lymph node metastasis status and
pathologic stage could classify patients into the different
prognostic groups [25]. In our study, the combination of
two and three proteins (EGFR, HER4 and EphA3) or the
combination of these proteins with CA19–9 was an independent prognostic factor for tumor recurrence.
Moreover, the patients were classified more accurately
when analyzed using the combination of protein kinase
expression and primary tumor (T) or lymph node metastasis (N) status. This may be beneficial for CCA patients
to predict their outcome after surgical treatment and
Padthaisong et al. BMC Cancer
(2020) 20:154
Page 15 of 16
may be used as a guideline for clinical intervention in
order to improve patient survival.
Availability of data and materials
The datasets generated during and/or analyzed during the current study are
available from the corresponding author on reasonable request.
Conclusion
Our results demonstrate that the elevated expression of
EGFR, HER4, and EphA3 is correlated with OVassociated CCA recurrence. Moreover, the panel of high
expression of EGFR, HER4, and EphA3 can be used as a
prognostic factor for CCA recurrence, especially when
combined with CA19–9 or clinicopathological features,
primary tumor (T) or lymph node metastasis (N) status.
Ethics approval and consent to participate
This study was approved by the Human Research Ethics Committees, Khon
Kaen University, Thailand (HE611412). All patients provided written informed
consent before enrollment.
Supplementary information
Supplementary information accompanies this paper at />1186/s12885-020-6655-4.
Additional file 1: Fig. S1 The expressing levels of protein kinases in
patients with and without recurrence, and in the different recurrence
location. a, The expressing levels of protein kinases in different group of
CCA patients which are no-recurrence (No, n = 132), late recurrence (Late,
n = 27) and early recurrence (Early, n = 31). b, The expressing levels of
protein kinases in different recurrence location, locoregional (n = 13) and
distant recurrence/combination between locoregional recurrence with
distant recurrence (n = 45). p-value less than 0.05 was considered as statistical significance.
Additional file 2: Fig. S2 The expressing levels of beta-catenin in patients with and without recurrence in the different cellular compartments,
cytoplasm, membrane and nucleus. The expressing levels of beta-catenin
in different group of CCA patients which are no-recurrence (No, n = 132),
late recurrence (Late, n = 27) and early recurrence (Early, n = 31). p-value
less than 0.05 was considered as statistical significance.
Additional file 3: Table S1 Patients characteristics.
Abbreviations
Akt: Serine/threonine kinase or protein kinase B; CA19–9: Carbohydrate
antigen 19-9; CCA: Cholangiocarcinoma; CEA: Carcinoembryonic antigen;
EGFR: Epidermal growth factor receptor; Eph: Erythropoietin-producing
hepatocellular carcinoma receptor; HER: Human epidermal growth factor
receptor; OV: Opisthorchis viverrini; VEGF-C: Vascular endothelial growth factor
C; VEGFR3: Vascular endothelial growth factor receptor 3
Acknowledgements
We thank Professor Trevor N. Petney for editing the MS via the Publication
Clinic KKU, Thailand.
Authors’ contributions
SP, WL, NN, JP and PK were responsible for the experimental design. SP
wrote the manuscript. SP and MT evaluated immunohistochemistry of the
specimens, performed the statistical analyses. NK and AT are surgeons
participating to tumor surgery and clinicopathological data collection. WL,
NN, JP and PK revised the first draft of the manuscript. All authors read and
approved the final manuscript.
Funding
The study was supported by funding organizations include The Thailand
Research Fund (Royal Golden Jubilee Ph.D. Program) and Khon Kaen
University (Grant No. PHD/0084/2560) allocated to WL and SP. Invitation
Research Grant (IN62142) allocated to SP. A grant from Cholangiocarcinoma
Screening and Care Program, Khon Kaen Univeristy (CASCAP-09), a grant
from the Thailand Research Fund (Grant No. RSA5980013) allocated to WL.
The funding sources had no role in the design of the study, data collection
and analysis, interpretation of results, writing of the manuscript.
Consent for publication
Not applicable.
Competing interests
The authors declare that they have no conflict of interest.
Author details
Department of Biochemistry, Faculty of Medicine, Khon Kaen University, 123
Mittraparp Road, Muang District, Khon Kaen 40002, Thailand.
2
Cholangiocarcinoma Screening and Care Program (CASCAP), Khon Kaen
University, Khon Kaen 40002, Thailand. 3Cholangiocarcinoma Research
Institute, Faculty of Medicine, Khon Kaen University, Khon Kaen 40002,
Thailand. 4Department of Surgery, Faculty of Medicine, Khon Kaen University,
Khon Kaen 40002, Thailand.
1
Received: 25 September 2019 Accepted: 18 February 2020
References
1. Yongvanit P, Pinlaor S, Bartsch H. Oxidative and nitrative DNA damage: key
events in opisthorchiasis-induced carcinogenesis. Parasitol Int. 2012;61:130–5.
2. Fairweather M, Balachandran VP, D'Angelica MI. Surgical management of
biliary tract cancers. Chin Clin Oncol. 2016;5:63.
3. Wang B, Zhang S, Yue K, Wang XD. The recurrence and survival of oral squamous
cell carcinoma: a report of 275 cases. Chin J Cancer. 2013;32:614–8.
4. Luvira V, Eurboonyanun C, Bhudhisawasdi V, Pugkhem A, Pairojkul C, Luvira
V, et al. Patterns of recurrence after resection of mass-forming type
intrahepatic Cholangiocarcinomas. Asian Pac J Cancer Prev. 2016;17:4735–9.
5. Tabrizian P, Jibara G, Hechtman JF, Franssen B, Labow DM, Schwartz ME,
et al. Outcomes following resection of intrahepatic cholangiocarcinoma.
HPB (Oxford). 2015;17:344–51.
6. Cho WK, Choi DH, Park HC, Park W, Yu JI, Park YS, et al. Elevated CEA is
associated with worse survival in recurrent rectal cancer. Oncotarget. 2017;8:
105936–41.
7. Wang JK, Hu HJ, Shrestha A, Ma WJ, Yang Q, Liu F, et al. Can preoperative
and postoperative CA19-9 levels predict survival and early recurrence in
patients with resectable hilar cholangiocarcinoma? Oncotarget. 2017;8:
45335–44.
8. Dokduang H, Juntana S, Techasen A, Namwat N, Yongvanit P, Khuntikeo N,
et al. Survey of activated kinase proteins reveals potential targets for
cholangiocarcinoma treatment. Tumour Biol. 2013;34:3519–28.
9. Padthaisong S, Thanee M, Techasen A, Namwat N, Yongvanit P, Liwatthakun
A, et al. Nimotuzumab inhibits Cholangiocarcinoma cell metastasis via
suppression of the epithelial-Mesenchymal transition process. Anticancer
Res. 2017;37:3591–7.
10. Suksawat M, Techasen A, Namwat N, Yongvanit P, Khuntikeo N, Titapun A,
et al. Upregulation of endothelial nitric oxide synthase (eNOS) and its
upstream regulators in Opisthorchis viverrini associated cholangiocarcinoma
and its clinical significance. Parasitol Int. 2017;66:486–93.
11. Yothaisong S, Dokduang H, Techasen A, Namwat N, Yongvanit P,
Bhudhisawasdi V, et al. Increased activation of PI3K/AKT signaling pathway
is associated with cholangiocarcinoma metastasis and PI3K/mTOR inhibition
presents a possible therapeutic strategy. Tumour Biol. 2013;34:3637–48.
12. Loilome W, Bungkanjana P, Techasen A, Namwat N, Yongvanit P, Puapairoj
A, et al. Activated macrophages promote Wnt/beta-catenin signaling in
cholangiocarcinoma cells. Tumour Biol. 2014;35:5357–67.
13. Nakamura H, Arai Y, Totoki Y, Shirota T, Elzawahry A, Kato M, et al. Genomic
spectra of biliary tract cancer. Nat Genet. 2015;47:1003–10.
14. Jusakul A, Cutcutache I, Yong CH, Lim JQ, Huang MN, Padmanabhan N,
et al. Whole-genome and Epigenomic landscapes of etiologically distinct
subtypes of Cholangiocarcinoma. Cancer Discov. 2017;7:1116–35.
Padthaisong et al. BMC Cancer
(2020) 20:154
15. Wardell CP, Fujita M, Yamada T, Simbolo M, Fassan M, Karlic R, et al.
Genomic characterization of biliary tract cancers identifies driver genes and
predisposing mutations. J Hepatol. 2018;68:959–69.
16. Nepal C, O'Rourke CJ, Oliveira D, Taranta A, Shema S, Gautam P, et al.
Genomic perturbations reveal distinct regulatory networks in intrahepatic
cholangiocarcinoma. Hepatology. 2018;68:949–63.
17. Imperatori M, D'Onofrio L, Marrucci E, Pantano F, Zoccoli A, Tonini G.
Neoadjuvant treatment of biliary tract cancer: state-of-the-art and new
perspectives. Hepat Oncol. 2016;3:93–9.
18. Nassour I, Mokdad AA, Porembka MR, Choti MA, Polanco PM, Mansour JC, et al.
Adjuvant therapy is associated with improved survival in resected Perihilar
Cholangiocarcinoma: a propensity matched study. Ann Surg Oncol.
2018;25:1193–201.
19. Lee DD, Croome KP, Musto KR, Melendez J, Tranesh G, Nakhleh R, et al.
Liver transplantation for intrahepatic cholangiocarcinoma. Liver Transpl.
2018;24:634–44.
20. Jung SJ, Woo SM, Park HK, Lee WJ, Han MA, Han SS, et al. Patterns of initial
disease recurrence after resection of biliary tract cancer. Oncology. 2012;83:83–90.
21. Jeong S, Cheng Q, Huang L, Wang J, Sha M, Tong Y, et al. Risk stratification
system to predict recurrence of intrahepatic cholangiocarcinoma after
hepatic resection. BMC Cancer. 2017;17:464.
22. Ito Y, Abe Y, Egawa T, Kitago M, Itano O, Kitagawa Y. Predictive factors of
early recurrence in patients with distal Cholangiocarcinoma after
Pancreaticoduodenectomy. Gastroenterol Res Pract. 2018;2018:6431254.
23. Yamashita YI, Shirabe K, Beppu T, Eguchi S, Nanashima A, Ohta M, et al.
Surgical management of recurrent intrahepatic cholangiocarcinoma:
predictors, adjuvant chemotherapy, and surgical therapy for recurrence: a
multi-institutional study by the Kyushu study Group of Liver Surgery. Ann
Gastroenterol Surg. 2017;1:136–42.
24. Mooso BA, Vinall RL. Mudryj M, yap SA, deVere white RW, Ghosh PM. The
role of EGFR family inhibitors in muscle invasive bladder cancer: a review of
clinical data and molecular evidence. J Urol. 2015;193:19–29.
25. Shang L, Liu HJ, Hao JJ, Jiang YY, Shi F, Zhang Y, et al. A panel of
overexpressed proteins for prognosis in esophageal squamous cell
carcinoma. PLoS One. 2014;9:e111045.
26. Lee HJ, Seo AN, Kim EJ, Jang MH, Kim YJ, Kim JH, et al. Prognostic and
predictive values of EGFR overexpression and EGFR copy number alteration
in HER2-positive breast cancer. Br J Cancer. 2015;112:103–11.
27. Huang CW, Chen YT, Tsai HL, Yeh YS, Su WC, Ma CJ, et al. EGFR expression
in patients with stage III colorectal cancer after adjuvant chemotherapy and
on cancer cell function. Oncotarget. 2017;8:114663–76.
28. Hashmi AA, Hussain ZF, Irfan M, Khan EY, Faridi N, Naqvi H, et al. Prognostic
significance of epidermal growth factor receptor (EGFR) over expression in
urothelial carcinoma of urinary bladder. BMC Urol. 2018;18:59.
29. Kim JY, Jung HH, Do IG, Bae S, Lee SK, Kim SW, et al. Prognostic value of
ERBB4 expression in patients with triple negative breast cancer. BMC
Cancer. 2016;16:138.
30. Hegde GV, de la Cruz CC, Chiu C, Alag N, Schaefer G, Crocker L, et al.
Blocking NRG1 and other ligand-mediated Her4 signaling enhances the
magnitude and duration of the chemotherapeutic response of non-small
cell lung cancer. Sci Transl Med. 2013;5:171ra18.
31. Lahtela J, Pradhan B, Narhi K, Hemmes A, Sarkioja M, Kovanen PE, et al. The
putative tumor suppressor gene EphA3 fails to demonstrate a crucial role in
murine lung tumorigenesis or morphogenesis. Dis Model Mech. 2015;8:393–401.
32. Nasri B, Inokuchi M, Ishikawa T, Uetake H, Takagi Y, Otsuki S, et al. High expression
of EphA3 (erythropoietin-producing hepatocellular A3) in gastric cancer is
associated with metastasis and poor survival. BMC Clin Pathol. 2017;17:8.
33. Qazi MA, Vora P, Venugopal C, Adams J, Singh M, Hu A, et al. Cotargeting
Ephrin receptor tyrosine kinases A2 and A3 in Cancer stem cells reduces
growth of recurrent Glioblastoma. Cancer Res. 2018;78:5023–37.
34. Fang T, Wang H, Wang Y, Lin X, Cui Y, Wang Z. Clinical significance of
preoperative serum CEA, CA125, and CA19-9 levels in predicting the
Resectability of Cholangiocarcinoma. Dis Markers. 2019;2019:6016931.
Publisher’s Note
Springer Nature remains neutral with regard to jurisdictional claims in
published maps and institutional affiliations.
Page 16 of 16