Electrophoretic characterization of gynoecious and monoecious cucumber (Cucumis sativus L.) genotypes based on seed protein profiles
Bạn đang xem bản rút gọn của tài liệu. Xem và tải ngay bản đầy đủ của tài liệu tại đây (310.67 KB, 9 trang )
Int.J.Curr.Microbiol.App.Sci (2018) 7(10): 3021-3029
International Journal of Current Microbiology and Applied Sciences
ISSN: 2319-7706 Volume 7 Number 10 (2018)
Journal homepage:
Original Research Article
/>
Electrophoretic Characterization of Gynoecious and Monoecious Cucumber
(Cucumis sativus L.) Genotypes Based on Seed Protein Profiles
Shailaja Punetha1*, Basavaraj Makanur2, Deepali Tewari1 and Parul Punetha3
1
Department of Vegetable Science, 2Department of Seed Science and Technology,
3
Department of Floriculture and Landscape Architecture, G.B. Pant University of Agriculture
and Technology, Pantnagar-263145, Uttarakhand, India
*Corresponding author
ABSTRACT
Keywords
Cucumber, Protein
profiling, SDS-PAGE,
Germplasm, Genetic
diversity, Electrophoresis
Article Info
Accepted:
24 September 2018
Available Online:
10 October 2018
Thirteen (Three gynoecious and ten monoecious) germplasm lines of cucumber
(Cucumber sativus L.) were characterized by sodium dodecyl sulphate polyacrylamide
vertical slab gel electrophoresis (SDS-PAGE). The seed protein could be resolved into
total 11 bands distributed in 4 zones i.e. A, B, C and D. Zone A was divided into 5
subzones and 5 bands, zone B has 1 band C has 5 and zone D included 5 bands. Similarity
index value ranged from 62% to 100% among all the genotypes. Pgyn-1 showed least
similarity 68% with other genotypes. It was observed that all the gynoecious genotypes
were dissimilar to monoecious genotypes. It was possible through seed protein profiles to
distinguished morphologically similar genotypes. Hence, seed protein profiles proved
useful in identifying gynoecious and monoecious lines of cucumber.
Introduction
Cucumber (Cucumis sativus L.) is one of the
most popular vegetables of the family
Cucurbitaceae. It is an important summer
vegetable crop of tropical India and is an
important vegetable crop in terms of utility as
well as foreign exchange. Cucurbitaceae, the
gourd family, is one of the largest families of
flowering plant, comprising of over 940
species and about 122 genera distributed in
tropical and sub-tropical regions of the world
(Shaefer and Renner, 2011). Among
Cucurbits, bottle gourd, bitter gourd,
cucumber, ivy gourd, ridge and snake gourd,
melons etc. demonstrate exuberant ethnomedicinal and agronomical chattels and are
consumed as vegetal crop by humankind
(Jeffrey, 2005). A wide range of genetic
variability is available in cucumber. Releasing
large number of varieties and increasing
morphological similarities between them, it
would make bit of confusion among plant
breeders and producers. So it is necessary to
differentiate one cultivar form the other
cultivars.
3021
Int.J.Curr.Microbiol.App.Sci (2018) 7(10): 3021-3029
Varietal
characterization
based
on
morphological data is becoming difficult
because these morphological traits are highly
influenced by environment. Morphologies
reflect not only genetic constitution of
cultivars, but also interaction of the genotype
with the environment. Due to the Genotype X
Environment effects, it is inappropriate to
discriminate ambiguity among similar
morphological
expressions. Descriptions
based on morphologies are fundamentally
flawed in their ability to provide reliable
information for calculation of genetic distance
or validation of pedigrees. Establishing the
identity of a variety through registration is
critical from the point of Plant Variety
Protection (PVP) as well as seed
multiplication and subsequent handling.
According to Protection of Plant Varieties and
Farmer’s Rights Act 2001 (PPV&FR) of
India, the varieties need to be characterized in
detail for establishing their distinctness,
uniformity and stability (DUS) before they are
introduced in seed multiplication chain.
One of the biochemical methods more
extensively used for taxonomic purposes has
been the electrophoretic analysis of the
proteins found in seeds and storage organs
(Ladizinsky
and
Hymowitz,
1979),
electrophoresis analysis is also used to study
molecular systematic for identification of
genotypes based on proteins and this
technique of Sodium Dodecyl Sulphate
Polyacrylamide Gel Electrophoresis (SDSPAGE) is commonly used for separation of
seed storage proteins (Ullah et al., 2010).
Therefore, isozymes or biochemical markers
are different in enzymes that are detected by
electrophoresis
and
specific
staining.
Biochemical markers are the protein produced
by gene expression. Such protein profile has
been extensively exploited for taxonomic and
evolutionary studies. Knowledge of genetic
variation is a useful tool in genebank
management, helping in the establishment of
core collections, facilitating efficient sampling
and utilization of germplasm (identifying
and/or eliminating duplicates in the gene
stock), and selection of desirable genotypes to
be
used
in
breeding
programs.
Characterization
of
germplasm
using
biochemical techniques (storage proteins and
isozymes) has received a great attention in the
last decades. This attention was attributed to
the increased recognition of germplasm
resources in crop plants improvement. Sodium
dodecyl
sulphate
polyacrylamide
gel
electrophoresis (SDS/PAGE) is among the
biochemical technique that is widely used due
to its simplicity and effectiveness for
describing the genetic structure of the
accessions of wild plant species. Protein
electrophoresis is considered a reliable,
practical and reproducible method because
seed storage proteins are the third hand copy
of genomic DNA and largely independent of
environmental fluctuations (Sammour, 1987;
Javaid et al., 2004; Iqbal et al., 2005).
In 1986, ISTA adopted a standard reference
method of PAGE for identification of varieties
of wheat and barley into its international rules,
involving separation of gliadin from wheat
and hordein from barley (ISTA, 1986). UPOV
has recommended SDS-PAGE for analysis of
high molecular weight glutenins in wheat
(Anonymous, 1994a) and hordeins in barley
(Anonymous, 1994b). Though for cucumber,
molecular markers like SSRs and SNPs are
now contemplated for profiling of the
varieties; SDS-PAGE profiling is relatively
simple, inexpensive, does not need elaborate
laboratory equipment or other additional
paraphernalia and can be adopted by field
laboratories of rice workers for varietal
identification and characterization.
Seed protein and isozyme variants that migrate
different rates have been extensively used as a
marker of characterization of cucurbits (Dane,
1983; Knerr et al., 1995). Seed protein has the
3022
Int.J.Curr.Microbiol.App.Sci (2018) 7(10): 3021-3029
advantage of being scorable, from inviable
organ or tissues and the electrophoretic
protocols for bulk protein assay are generally
simpler than for isozymes (Gepts, 1990).
Electrophoresis of seed or seedling extracts
followed by appropriate protein or activity
stains has been suggested as a possible method
for distinguishing cultivars (Larsen and
Benson, 1970; Wilkinson and Beard, 1972).
These techniques are all based on the concept
that each cultivar is distinct and relatively
homogeneous at the genetic level. Thus by
screening enough loci one should be able to
uniquely define each cultivar. Soluble proteins
of seeds are the physiologically active
constituents, which constitute bulk of enzymes
involved in plant metabolism and are
responsible
for
the
nutritional
and
technological property of plant (Johari et al.,
1977). Soluble proteins being primary gene
products provide a valuable tool of making
genetic system and hence, different methods
of electrophoresis are used in chemo
taxonomical studies of plant species (Ahl et
al., 1982 and Agrawal, 1985). This technique
is least influenced by environment and is used
as “Fingerprint” to identify genotypes (Smith
and Smith, 1992). Therefore, the following
experiment was carried out to characterize the
thirteen (Three gynoecious and ten
monoecious) germplasm lines of cucumber
through SDS-PAGE seed protein profiles.
Materials and Methods
Plant material
Cucumber seeds were collected from
Department
of
Vegetable
Science,
GBPUA&T, Pantnagar, India. Thirteen
genotypes of Cucumis sativus L. were
electrophoretically characterized using SDSPAGE at the Biotech Laboratory of
Department of Genetics and Plant Breeding.
Genotypes are enlisted in the following Table
1.
SDS-PAGE
Protein extraction and purification
Collected seeds of thirteen genotypes viz.,
Pgyn-1, Pgyn-4, Pgyn-5, PCUC-8, Pant Khira1, PCUC-83, PCUC-126, PCUC-208, PCUC15, PCUC-25, PCUC-35, US-832, Punjab
Naveen were crushed and grounded with the
help of mortar and pestle using CTAB method
(Doyle and Doyle, 1987). The seed flour was
taken in to a 10 ml test tube. A volume of 5 ml
of chloroform, methanol and acetone mixture
(2:1:1) was added and mixed well by
vortexing. Then the samples were kept at
room temperature for overnight. After
centrifuging the samples the solvent was
removed and taken the defatted seed powder
was placed in 1.5 ml eppendorf tubes. Then
the protein extraction buffer (0.6M Tris HCL
buffer-pH 6.8 mixed SDS and βmercaptoethanol) was added. Bromophenol
blue was added to extraction buffer as a dye to
point out the movement of protein in the gel.
All these chemicals were mixed together then
the solution was purified and homogenated.
The samples were thoroughly vortexed and
centrifuged at 12,000 rpm for 10 minutes at
room temperature (RT). After centrifuging the
samples, the crude protein recovered as clear
supernatant on the top of the tube. Then
supernatant were transferred into new 1.5 ml
Eppendorf tubes and stored at -20 0C until gel
electrophoresis. Proteins profiling of samples
was performed using SDS- polyacrylamide
gels as described by Laemmli (1970) protocol.
Electrophoresis
Crude protein samples were directly analyzed
by SDS-PAGE using 12.0% polyacrylamide
as resolving gel and 4.5% stacking gel. 20 μg
protein samples were loaded with the help of
micropipette into the wells of the stacking gel.
Electrophoresis was carried out at 20 V for
staking gel and 100 V for as resolving gel,
3023
Int.J.Curr.Microbiol.App.Sci (2018) 7(10): 3021-3029
until the bromophenol blue (BPB) reached to
the bottom of gel plate.
Staining
After completion of electrophoresis, the gels
were placed in fixing solution (15% TCA) in
staining box for overnight. After decanting,
the fixing solution, pored the 2.0% (w/v)
coomassie brilliant blue (CBB) R250 in box.
De-staining
When the staining procedure was completed,
then the gel was de-stained by washing with a
solutioncontaining acetic acid, methanol and
water in the ratio of 5:20:75 (v/v), so that the
blue color of the coomassie brilliant blue
(CBB) R disappears and the electrophoresis
band on gels clearly visible.
Gel analysis and data processing
The protein bands were scored as 0 for
absence or 1 for presence for polymorphism.
The Jaccard’s similarity index was calculated
using NTSYS-pc version 2.02e (Applied BioStatistics, Inc., Setauket, NY, USA) package
to compute pair wise Jaccard’s similarity
coefficients and this similarity matrix was
used in cluster analysis using an unweighted
pair group method with arithmetic averages
(UPGMA) and sequential, agglomerative,
hierarchical
and
nested
(SAHN)
clusteringalgorithm to obtain a dendrogram.
Results and Discussion
Protein profile pattern
genotypes by SDS-PAGE
of
cucumber
Although uniformity and uniqueness of the
seed protein profiles are typical of many
groups of the plants, variation in the number
of bands and their position in the profile have
been reported especially where a good number
of accessions were examined. Seed protein
variants have been observed to be the most
widely used biochemical genetic markers
during the last quarter century. Its success
depends on the polymorphism of seed proteins
and the fact that these proteins represent
primary gene products and are largely
unaffected by the environmental interactions
(Smith and Smith, 1992). The seed protein
profile of three gynoecious and ten
monoecious cucumber genotypes was carried
out using SDS-PAGE for biochemical
characterization. The protein profile of
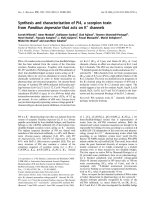
banding pattern is given in Figure 1.
The profile was divided into four zones A, B,
C and D each zone was allocated with a
number of protein bands or subzones. Zone A
was nearest to origin (gel wells) and
comprised protein bands of high molecular
weight while zone D was the farthest from
origin and thus had protein bands of low
molecular weight. A standard medium range
protein molecular weight marker of known
molecular weight (14,300 kDa to 97,400 kDa)
was used along with samples. For genotype
discrimination, the presence and absence of
protein bands was the criteria selected for
characterization.
Each zone was further subdivided into a
number of bands (Fig. 1). Zone A representing
the heaviest molecular weight protein was
subdivided into three intense to light and sharp
band of subzones A1, A2, A3,A4 and A5.
Zone B was representing a dark band. Zone C
was representing thick and sharp bands of
subzones C1, C2, C3, C4 and C5. Zone D was
representing dark and light band and divided
in five subzones D1, D2, D3, D4 and D5.
Subzone A1 band was present in only one
genotype Pgyn-1 and absent in all other 12
genotypes. Subzone A2 was absent in Pgyn-1
and present in remaining al 12 parents (Pgyn4, Pgyn-5, PCUC-8, Pant Khira-1, US-832,
3024
Int.J.Curr.Microbiol.App.Sci (2018) 7(10): 3021-3029
PCUC-15, PCUC-25, PCUC-35, PCUC-83,
PCUC-126, PCUC-208, and Punjab Naveen).
Subzone A3 showed in 10 monoecious
genotypes i.e. PCUC-8, Pant Khira-1, US-832,
PCUC-15, PCUC-25, PCUC-35, PCUC-83,
PCUC-126, PCUC-208, and Punjab Naveen.
Subzone A4 was presents thick band in all 10
monoecious parents i.e. PCUC-8, Pant Khira1, US-832, PCUC-15, PCUC-25, PCUC-35,
PCUC-83, PCUC-126, PCUC-208, and
Punjab Naveen. Subzone A5 was present only
in Pgyn-1, Pgyn-4 and Pgyn-5.
Subzone C1 was present only in PCUC-8. The
subzone C2 was present in parents in seven
genotypes, Pant Khira-1, PCUC-15, PCUC25, PCUC-35, PCUC-83, PCUC-208, and
Punjab Naveen. Subzone C3 was present in
Pgyn-1 and Pgyn-4 only. Subzone D2 was
present only in Pgyn-1. Subzone D3 was
present only in PCUC-25 and Punjab Naveen.
Subzone D4 was present in Pgyn-1, Pgyn-4,
US-832, PCUC-126 and PCUC-208. Subzone
B1, C4, C5, D1 and D5 bands were present in
all gynoecious and monoecious genotypes
under study.
Zone A1 and D2 were only present in Pgyn-1
and absent in all others bands. Zone A3 was
present in monoecious genotypes and absent
in gynoecious genotypes. Zone A2 was
present in all monoecious genotypes along
with two gynoecious genotype Pgyn-4 and
Pgyn-5. Maximum ten bands were found in
parents Pgyn-1, PCUC-15, PCUC-25 PCUC208, Punjab Naveen and rest of genotypes
showed nine bands in different locations. The
banding pattern of these forty varieties was
uniform and was not affected by the repeated
electrophoretic runs. Though no unique band
was observed specific for a variety, all the
varieties studied exhibited unique banding
patterns (Fig. 1).
Fig.1 Protein profile of gynoecious and monoecious cucumber genotypes
3025
Int.J.Curr.Microbiol.App.Sci (2018) 7(10): 3021-3029
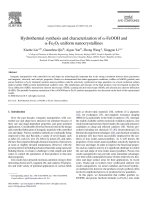
Fig.2 UPGMA dendrogram of protein profile of gynoecious and monoecious genotype cucumber
Table.1 List of cucumber genotypes and their sources
Sl. No.
1.
2.
3.
4.
5.
6.
7.
8.
9.
10.
11.
12.
13.
Germplasm Line
Pgyn-1
Pgyn-4
Pgyn-5
PCUC-8
Pant Khira-1
PCUC-83
PCUC-126
PCUC-208
PCUC-15
PCUC-25
PCUC-35
US-832
Punjab Naveen
Nature
Gynoecious
Gynoecious
Gynoecious
Monoecious
Monoecious
Monoecious
Monoecious
Monoecious
Monoecious
Monoecious
Monoecious
Monoecious
Monoecious
3026
Source
Pantnagar
Pantnagar
Pantnagar
Pantnagar
Pantnagar
Pantnagar
Pantnagar
Pantnagar
Pantnagar
Pantnagar
Pantnagar
UAS, Bangalore
PAU, Ludhiana
Int.J.Curr.Microbiol.App.Sci (2018) 7(10): 3021-3029
Table.2 Similarity matrix of protein profile in genotypes of cucumber
Pgyn-1
Pgyn-4
Pgyn-5
PCUC-8
Pant Khira 1
PCUC832
PCUC-15
PCUC-25
PCUC-35
PCUC-83
PCUC-126
PCUC-208
Punjab Naveen
Pgyn1
1.000
0.875
0.625
0.667
0.667
0.667
0.778
0.778
0.667
0.667
0.667
0.667
0.778
Pgyn4
Pgyn5
PCUC8
Pant
Khira-1
US832
PCUC15
PCUC25
PCUC35
PCUC83
PCUC126
PCUC208
Punjab
Naveen
1.0 00
0.714
0.750
0.750
0.750
0.875
0.875
0.750
0.750
0.750
0.750
0.875
1.000
0.714
0.714
0.714
0.625
0.625
0.714
0.714
0.714
0.714
0.625
1.000
1.000
0.750
0.875
0.875
1.000
1.000
0.750
0.750
0.875
1.000
0.750
0.875
0.875
1.000
1.000
0.750
0.750
0.875
1.000
0.875
0.875
0.750
0.750
1.000
1.000
0.875
1.000
1.000
0.875
0.875
0.875
0.875
1.000
1.000
0.875
0.875
0.875
0.875
1.000
1.000
1.000
0.750
0.750
0.875
1.000
0.750
0.750
0.875
1.000
1.000
0.875
1.000
0.875
1.000
The differences in banding patterns were
either with total number of bands present,
location of bands and intensity of bands or it
can even be the presence or absence of four
categories of bands namely dense, medium,
light, and faint. The overall differential
banding pattern of seed proteins indicated
qualitative and quantitative variations among
the different genotypes. These observations
suggested
that
with
electrophoretic
differences in protein banding pattern of
different genotypes, specific varieties were
identified with the presence or absence of a
specific position of band and also the intensity
of band, which could be used as genetic
marker. Singh and Ram (2005) also reported
similar type of banding and characterization
in thirty lines of cucumber by SDS-PAGE.
Present study results were also in line with
Singh et al., (2010). They studied the
biochemical characterization of total fifteen
genotypes including four parthenocarpic
gynoecoius cucumber lines and their three
hybrids, four monoecious varieties (Cucumis
sativus L.), three wild relatives (Cucumis
sativus var. hardwickii) and a backcross
which were subjected to seed protein analysis
through SDS-PAGE. They observed different
banding pattern in their study. However,
differences among genotypes for darkness and
thickness of protein bands were also evident.
Ladizinsky and Hymowitz (1979) reported
such variation as the commonly reported
ones, suggesting that the formation of many
of the bands in the seed protein profile are
under control of quantitative gene system and
such variation may be due to lack of
separation of several proteins having similar
migration rates on the gels.
Similarity index (SI) and UPGMA cluster
analysis
The variation in number and position of bands
was expressed by similarity index. The
method was used by Vaughan and Denford
(1968), which expresses the variation in the
banding pattern between two gels.
This similarity index was used for analysis of
parental genotypes in cucumber. The
similarity index value ranged from 62% to
100% among all the genotypes (Table 2).
The genotype Pgyn-1 showed least similarity
68% with other gynoecious genotypes Pgyn1, Pgyn-4 and other monoecious genotypes.
On the basis of protein profile of thirteen
cucumber genotypes the un-weighted pair
group method using arithmetic average
3027
Int.J.Curr.Microbiol.App.Sci (2018) 7(10): 3021-3029
(UPGMA) analysis was done. The
dendrogram is presented in Figure 2. The
genotypes were clustered into two major
clusters (A and B) with 68% similarity among
them. Cluster A comprised 12 genotypes and
cluster B comprised only one Pgyn-1
genotype.
the ranging of genotypes in either closer or
distinct groups, which could also be used for
the breeder’s needs, as well as in the seed
industry for identification and selection of
desirable cucumber genotypes.
Cluster A was further subdivided into two
sub-clusters IA and IIA with 72% similarity.
Sub-cluster IA comprised two gynoecious
genotypes with 87% similarity. The cluster
IIA comprised all the ten monoecious
genotypes and was further divided into two
with 80% similarity. IIA was again forked
into two small groups IIAa and IIAb with
87% similarity.
Agrawal, P. K. 1985. Field plot test for
assessing genetic purity in hybrid cotton,
Seed Tech News, 15(3): 1-5.
Ahl, P., Cornu, A. And Gianninazzi, S. 1982.
Soluble proteins as genetic markers in
studies of resistance and phylogeny
in Nicotiana. Phytopathology 72: 80–85.
Anonymous. 1994 a. UPOV guidelines for the
conduct of test for DUS-Wheat (Triticum
aestivum) UPOV, TG/3/11.
Anonymous. 1994 b. UPOV guidelines for the
conduct of test for DUS-barley (Hordeum
vulgare) Revised document UPOV,
TG/2/5.
Dane, F. 1983. Cucurbits, In: Isozymes in Plant
Genetics and Breeding, Part B. C.D.
Tanksley and T.J. Orton (Eds.). Elsevier
Science Publishers, Amsterdam, pp. 369380.
Doyle, J J and Doyle, J L. 1987. A rapid DNA
isolation procedure for small quantities of
fresh leaf tissue. Phytochemistry Bulletin
19:11-15.
Doyle, J.J. and J.L. Doyle. 1987. A rapid DNA
isolation procedure for small quantities of
fresh leaf tissue. Phytochemistry Bulletin
19: 11-15.
Gepts, P. 1990. Genetic diversity of seed
storage proteins in plants. In: A.H.D.
Brown, M.T. Clegg, A.L. Kahler and B.S.
Weir (Eds.). Plant Population Genetics,
Breeding and Genetic Resources,
Sunderland, Sinauer Assoc. members of
the subfamily Papilionoideae. Journal of
Agronomy and Crop Science.
International Seed Testing Association. 1996.
International Rules for Seed Testing, Seed
Science and Technology 24, Supplement
1–228.
In IIAa four monoecious genotypes PCUC-8,
Pant Khira-1 and PCUC-35 and PCUC-83
were present with 100% similarity among
each. IIAb had three genotypes PCUC-15
PCUC-25 and Punjab Naveen with 100%
similarity among each. IIAc was divided into
minor cluster with 100% similarity to each
other which comprised three monoecious
genotypes US-832, PCUC-126 and PCUC208. Singh and Ram (2000) classified 19
cucumber germplasm in eight different
groups. Singh and Ram (2005) reported that
the protein bands in cucurbits were genera
specific. Singh et al., (2010) categorized
fifteen genotypes of cucumber into two major
groups.
Seed storage protein profiles could be useful
marker for genotype identification and
diversity analysis (between and within
Cucumis species). Characterization on the
basis of proteins and selection of desirable
lines/genotypes is great importance for
breeders. Precise differentiation in protein
banding patterns is possible on the basis of
the presence or absence of unique
polypeptides, and the creation of matrices for
statistical analyses. Their clustering allows
References
3028
Int.J.Curr.Microbiol.App.Sci (2018) 7(10): 3021-3029
Iqbal S H, Ghafoor A and Ayub N. 2005.
Relationship
between
SDS-PAGE
markers and Ascochyta blight in
chickpea. Pakistan Journal of Botany 37:
87-96.
Javaid A, Ghafoor A and Anwar R. 2004. Seed
storage protein electrophoresis in
groundnut
for
evaluating
genetic
diversity. Pakistan Journal of Botany 30
(1): 25-29.
Jeffrey, C. 2005. A new system of
Cucurbitaceae. Bot. Zhurn. 90: 332–335.
Johari R P, Metha S L and Naik M S. 1977.
Changes in soluble protein and
isoenzymes in developing sorghum
grains. Crop Sci. 46: 409-411.
Knerr, I D, Meglic, V and Stans, J E. 1995.
Fourth malate dehydrogenase (MDH)
locus in cucumber. Hort. Sci., 30 (1):
118-119.
Laemmli, U.K. 1970. Cleavage of structural
proteins during the assembly of the head
of bacteriophage T4, Nature 227: 680685.
Landizinsky G and Hymowitz T. 1979. Seed
protein electrophoresis in taxonomic and
evolutionary studies. Theoretical and
Applied Genetics 54: 145–51.
Larsen A L and Benson W C. 1970. Varietyspecific variants of oxidative enzymes
from soybean seed. Crop Sci. 10: 493495.
Protection of Plant Varieties and Farmers’
Rights
Act.
2001.
http://www.
plantauthortiy.gov.in.
Sammour R. H. 1987. Electrophoretic and
serological studies of the seed proteins of
some members of the subfamily
Papilionoideae. Journal of Agronomy and
Crop Science. 159: 282-286.
Shaefer, H and Renner S S. 2011. A
Cucurbitaceae. Families and genera of
vascular plants. Springer Verlag, Berlin
(ed by Kubitzki). 10: 112-174.
Singh, A. and Ram, H H. 2005.
Characterization of germplasm lines of
cucumber (Cucumis sativus L.) through
seed protein profiles. Veg. Sci. 32(2):117119.
Singh, D K and Ram, Hari Har. 2000.
Characterization
of
indigenous
germplasm lines of cucumber (Cucumi
ssativus L.) through SDS-PAGE. Veg.
Sci. 28 (1): 22-23.
Singh, D K, Padiyar, S. and Choudhary, H.
2010. Biochemical characterization of
parthenocarpic gynoecious cucumber
lines, hybrids, monoecious varieties and
wild relatives. Indian J. of Hort. 67(3):
343-347.
Smith J S C and Smith O S. 1992.
Fingerprinting crop varieties. Adv. Agron.
47: 85-140.
Smith, J.S.C. and Smith, O.S. 1992.
Fingerprinting in varieties. Advances
Agron. 47: 85-140.
Ullah I, Ahmad Khan I, Ahmad H, Sul-Gafoor
S Gul, Muhammad I and Ilyas M. 2010.
Seed storage protein profile of rice
varieties commonly grown in Pakistan.
Asian Journal of Agricultural Sciences 2
(4): 120–123.
Vaughan, J.G. and Denford, K.E. 1968. An
acrylamide gel electrophoretic study of
the seed proteins of Brassica and Sinapsis
species with special reference to their
taxonomic value. J. Exp. Bot. 19: 724732.
Wilkinson, J F. and Beard, J. B. 1972.
Electrophoretic identification of cultivars.
Crop Sci. 12: 833-834.
How to cite this article:
Shailaja Punetha, Basavaraj Makanur, Deepali Tewari and Parul Punetha. 2018. Electrophoretic
Characterization of Gynoecious and Monoecious Cucumber (Cucumis sativus L.) Genotypes Based
on Seed Protein Profiles. Int.J.Curr.Microbiol.App.Sci. 7(10): 3021-3029.
doi: />
3029