Cultural, morphological and molecular variability of Fusarium oxysporum f. sp. udum Isolates by RAPD method
Bạn đang xem bản rút gọn của tài liệu. Xem và tải ngay bản đầy đủ của tài liệu tại đây (620.78 KB, 14 trang )
Int.J.Curr.Microbiol.App.Sci (2018) 7(10): 2109-2122
International Journal of Current Microbiology and Applied Sciences
ISSN: 2319-7706 Volume 7 Number 10 (2018)
Journal homepage:
Original Research Article
/>
Cultural, Morphological and Molecular Variability of
Fusarium oxysporum f. sp. udum Isolates by RAPD Method
P.H. Ghante*, K.M. Kanase, S.P. Kale, R.L. Chavan, K.M. Sharma and S.B. Ghuge
Department of Plant Pathology, College of Agriculture, Parbhani, Vasantrao Naik
Marathwada Krishi Vidyapeeth, Parbhani 431 402 (M.S), India
*Corresponding author
ABSTRACT
Keywords
Pigeonpea wilt, Fusarium
oxysporum f. sp. udum, in
vivo, Cultural,
morphological and
molecular characteristics
Article Info
Accepted:
15 September 2018
Available Online:
10 October 2018
Cultural, morphological and molecular characteristics of Fusarium oxysporum f. sp. udum
were studied where eight isolates indicated a great variability amongst them. However, the
isolate FOC-2 (Jalna) exhibited maximum mycelial growth of 90 mm. The isolates viz.,
Jalna (FOC-2) and Beed (FOC-3) produced partially submerged (FOC-2) to submerged
(FOC-3) white sparse dense growth with smooth margin and bright white substrate
pigmentation, respectively. Maximum micro-conidial, macro-conidial and chlamydospore
size (17.20 μm, 30.50 x 7.00 μm and 21.80 x 19.60 μm) were recorded in isolate Jalna
(FOC-2). The micro-conidia were more or less oval to cylindrical with no septation. The
macro-conidia were typically sickle shaped curved, fusoid varied in the size and number of
septation (3-5). The chlamydospores were round to oval in shape. Genetic diversity was
analyzed based on data obtained by 10 RAPD primers. Most of the primers were found
91.66 to 100 per cent polymorphic in nature. All primers had amplified total number of
144 bands among which 140 and 4 were found polymorphic and monomorphic,
respectively. The cluster I comprised isolates FOC-1 (Aurangabad) and FOC-6 (Nanded)
together and showed 57.60 per cent similarity to each other; however, cluster II comprised
six isolates [FOC-2 (Jalna), FOC-3 (Beed), FOC-4 (Osmanabad), FOC-5 (Latur), FOC-7
(Parbhani) and FOC-8 (Hingoli)] together showing 53.88 per cent similarity. All of these
six isolates of cluster II were from different region showing maximum similarity in the
range of 59.00 to 100 per cent.
Introduction
Pigeonpea [Cajanus cajan (L.) Millspaugh] is
known by more than 350 vernacular names,
the most popular being arhar, yellow dhal, red
gram, tur (India), congo pea, gandul, guandu
(Brazil), angola pea (United Kingdom),
catjang pea, ambrevade, pois d’angdie
(French-speaking West Africa), quinochoncho
(Venezuela). Pigeonpea ranks fourth in
importance as edible legume in the world.
Pigeon pea is extensively grown throughout
the tropics, subtropics and warmer equatorial
regions of Asia, East Africa and Central
America in lower altitude areas between 30o N
to 30o S, particularly in the semi-arid and
lower humid tropics.
Globally, it is grown on approximately 5
million hectares in about 82 countries of the
2109
Int.J.Curr.Microbiol.App.Sci (2018) 7(10): 2109-2122
world. The major production area is located in
India, Myanmar, Kenya, Malawi, Uganda and
Tanzania.
The pigeonpea is the first seed legume plant to
have its complete genome sequenced. The
sequencing was first accomplished by a group
of 31 Indian scientists from the Indian Council
of Agricultural Research, New Delhi (India).
India alone occupies three-fourth of the global
harvested area and contributes almost a similar
share in production. Pigeonpea occupies a
prominent place in Indian rainfed agriculture.
It is the second most important pulse crop next
to chickpea, covering an area of around 4.42
m ha (occupying about 14.5% of area under
pulses), production of 2.86 MT (contributing
to 16% of total pulse production) and
productivity of about 707 kg/ha. Deep roots
improve physical properties of the soil and
pulverize the soil. The plants shed large
amount of leaves, this biomass adds organic
matter to soil. Besides, it also leaves 30-50 kg
‘N’ to the succeeding crop and also benefiting
the inter-cropped cereals through increased
‘N’ supply. Pigeonpea in some areas is an
important crop for green manure, providing up
to 90 kg nitrogen per hectare.
The area of pigeonpea in Maharashtra is
increased from 10.39 lakh ha to 15.33 lakh ha
in 2016-17. Area of pigeonpea was highest in
2016-17 (15.33 lakh ha) while the production
and productivity were highest during 2013-14
i.e.10.34 lakh tones and 906 kg/ha,
respectively. In 2016-17 estimated production
of pigeonpea in Maharashtra is 11.70 lakh
tonnes. In Marathwada, area under pigeonpea
was 5.95 lakh ha during 2016-17, while
production and productivity were highest
during 2013-14 i.e. 5.16 lakh tones and 933
kg/ha, respectively (Anonymous 2017).
Maharashtra contributes 30.29 % in terms of
area with 28.29 % of production at national
level (average of last ten years). Percentage of
area increase during 2016-17 as compared to
previous year (2015-16) is 27.25 %, 32.22 %
and 33.64 % in India, Maharashtra and
Marathwada, respectively. In general, there is
low productivity of pulses including
pigeonpea. Because, the crop is grown on
marginal lands, low rainfall areas, poor
management, poor crop husbandry, high rate
of flower and fruit drop, non- uniform
maturity, pod shattering and susceptibility to
pests and diseases.
Wilt caused by Fusarium udum is the most
destructive disease of pigeonpea throughout
India. The plant mortality up to 50 per cent
has been observed with severe infection of
wilt. The main symptoms are wilting of
seedlings and adult plants. The wilting starts
gradually showing yellowing and drying of
leaves followed by wilting of whole infected
plant. The affected plants can easily be
recognized in patches in the field. Wilt
appears on the young seedlings but mainly
observed during flowering and podding stage.
Surveys conducted for the disease by
Kannaiyan et al., (1984) have indicated it to
be a major problem in the states of Bihar and
Maharashtra (Reddy et al., 1990). Fusarium
wilt characterized by wilting of the affected
plants and characteristic internal browning or
blackening of the xylem vessels extending
from root system to stems. Partial wilting of
the plants (Upadhyay and Rai, 1992) and
patches of dead plants (Reddy et al., 1993)
were reported to be common in the fields
during advanced stages of plant growth.
Investigation was carried out to study cultural,
morphological and molecular variability of
test pathogen.
Materials and Methods
The experiment was conducted at Department
of Plant Pathology, College of Agriculture
Parbhani, VNMKV, Parbhani (M.S.). The
pathogen was isolated from diseased leaves of
Pigeonpea on PDA incubated at 27±2 ºC. Ten
2110
Int.J.Curr.Microbiol.App.Sci (2018) 7(10): 2109-2122
highly virulent, test isolates of F. udum,
representing four agro-climatic zones were
subjected to study for their cultural variability.
Quantity of 20 ml autoclaved and cooled PDA
medium was dispensed in sterile glass
petriplates (90 mm diam.) and allowed to
solidify at room temperature. Aseptically,
these plates were inoculated separately by
putting in the centre a mycelial disc (5 mm)
obtained from actively growing a week old
pure culture of the test isolates and incubated
at 27 + 1 oC. Three PDA plates / isolate /
replication were maintained
breadth, septation of microconidia and macroconidia of each test isolate (10 days old pure
culture growth on PDA) were recorded by
using J image software, TS view and with the
help of the compound microscope (make:
Labomed Vision 2000 as well as Olympus) at
400X magnification under 10 random
microscopic fields.
Molecular variability
Molecular variability among 10 isolates of F.
udum was analyzed by RAPD molecular
markers.
Cultural variability
Isolation of genomic DNA
Ten highly virulent, test isolates of F. udum,
representing four agro-climatic zones were
subjected to study for their cultural variability.
The experiment was planned in CRD and the
ten test isolates were replicated thrice.
The genomic DNA of the 10 test isolates of F.
udum was isolated, separately by using
standard 2 % cetyl trimethyl ammonium
bromide (CTAB) extraction method.
Observations on cultural characteristics viz.,
colony diameter, colony colour, colony
appearance, colony shape and colony margin,
zonation, substrate pigmentation etc. were
recorded after a week of incubation and
sporulation was recorded at 10 days of
incubation, sporulating culture of the test
isolates in Petri plates was flooded with 10 ml
distilled water and was gently scraped with
camel hair brush, to obtain spore suspension.
Temporary mount on glass slide, of the spore
suspension was prepared, mounted under
research microscope (10X objective lens),
counted the spores under five random
microscopic fields and averaged. Based on
(Kumar and Choudhary, 2006) scale, the test
isolates were categorized.
Quantification of DNA
Morphological variability
Available RAPD primers were used for
screening of Fusarium udum. The primers
were screened on the basis of reproducible and
scorable amplification for analysis of
Fusarium udum. For example, positively
screened primers (OP series A to Z) along
with their sequence are mentioned below.
Temporary mounts in Lactophenol cotton blue
stain on glass slides of the sporulated cultures
of 10 test isolates were prepared separately
and covered with glass slide. The
morphological characteristics viz., length and
Spectrophotometer was used for quantitative
and qualitative analysis of the DNA of the test
isolates. Five µl of DNA sample was added in
Cuvette carrying 0.995 µl of sterile H2O and
absorbance was measured at 280 nm wave
lengths. Similarly, the purity of DNA was
checked by measuring the ratio of OD at
A260/A280 nm. The quantification of DNA
was calculated by using following formula.
OD at 260 nm X dilution factor
DNA (µg/µl) = ------------------------------ X 50
1000
Primer screening
2111
Int.J.Curr.Microbiol.App.Sci (2018) 7(10): 2109-2122
Cultural variability
Grade
+
++
+++
++++
Sporulation
Absent
Poor
Fair
Good
Excellent
No. of spores per microscopic field
Nil
1 -10
11 – 30
31 – 50
More than 50
Primer screening
Sr. No.
1
2
3
4
5
6
7
8
9
Primer
OPA-03
OPA-09
OPA-17
OPB-04
OPB-10
OPB-12
OPB-15
OPB-20
OPC-01
Sequence 5’-3’
AGTCAGCCAC
GGGTAACGCC
GACCGCTTGT
GGACTGGAGT
CTGCTGGGAC
CCTTGACGCA
GGAGGGTGTT
GGACCCTTAC
TTCGAGCCAG
Sr. No.
10
11
12
13
14
15
16
17
Primer
OPC-05
OPC-14
OPC-19
OPC-20
OPD-02
OPD-03
OPD-05
OPD-07
GATGACCGCC
TGCGTGCTTG
GTTGCCAGCC
ACTTCGCCAC
GGACCCAACC
GTCGCCGTCA
TGAGCGGACA
TTGGCACGGG
RAPD analysis of F. udum isolates
Data scoring and analysis
The PCR protocol for RAPD reaction was
optimized with various PCR components and
thermal cycler programme. Master mix (24 µl)
containing all of the reactants, except template
DNA were dispensed in autoclaved PCR tubes
(0.2 ml). Genomic DNA of each isolate of F.
udum was added to the individual tubes
containing the master mix.
The amplified products generated from
RAPD-PCR reaction were resolved on 1.5 %
agarose gel. The RAPD amplicons showing
monomorphic and polymorphic pattern were
scored and amplicon size was determined by
comparison with 1 kb DNA ladder
(Fermentas, U.K.). Jaccard’s similarity
coefficient (J) was used to calculate similarity
between pairs of varieties, which was as
follows (Jaccard, 1908).
The contents of each tube were mixed by
tapping with fingers, followed by a brief spun
to collect the content at bottom of the tube.
These tubes were placed in Thermocycler (Bio
Rad, USA) and subjected to PCR according to
the standardized protocol.
The amplified RAPD product was separated
by electrophoresis in 1.5 % agarose gel with 1
X TAE buffer, stained with ethidium bromide
(0.5 µg/ml) at 90 V for 1.0 to 1.5 hrs and
photographed using gel documentation system
(Alpha Innotech, USA). The sizes of the
amplification product were estimated using
100 bp to 1 kb ladder (Fermentas, UK). The
polymorphism was detected by comparing
RAPD product of the test isolates of F. udum
J = nxy / nt-nz
nxy is the number of bands common to variety
x and y
nt is the total number of bands present in all
samples and
nz is the number of bands absent in x and y
but, found in all samples
RAPD fingerprint data was scored in present
(1) or absent (0) forms, data matrices were
generated and used to plot dendrogram
exploited for phylogenetic analysis, by using
Jacquards' similarity coefficient, using the
software NTSYS pc2.02i and Exerter
Software.
2112
Int.J.Curr.Microbiol.App.Sci (2018) 7(10): 2109-2122
Results and Discussion
Cultural variability among the F. udum
isolates
The results obtained on cultural characteristics
viz., mycelial growth (colony diameter),
mycelial colour, colony appearance, growth
speed, colony shape, margin, sporulation and
pigmentation etc. in respect of 10 test isolates
of F. udum grown on PDA (Table 1, 2 and
Fig. 1).
Mycelial growth
The results indicated that among the test
isolates, mycelial growth was varied from
54.67 mm (FOU 17) to 89 mm (FOU 16).
However, it was the highest in isolate FOU 16
(89 mm), followed by the isolates viz., FOU
30 (88.67 mm), FOU 12 (87.67 mm), FOU 6
(84.33 mm), FOU 22 (83.33 mm), FOU 2
(82.67 mm) and these all six were at par with
each other.
In rest of the test isolates, mycelial growth
was ranged from 81.33 mm to 54.67 mm.
significantly; minimum mycelial growth was
found in FOU 17 i.e. 54.67 mm.
The maximum (> 80 mm) colony diameter
were seen in seven isolates i.e. FOU 2, FOU 6,
FOU 12, FOU 16, FOU 19 and FOU 22 with
70 % frequency and medium colony diameter
was seen in isolate FOU 3 isolate with 10 %
frequency. However, minimum (<60 mm)
colony diameter were seen in isolates FOU 13
and FOU 17 with 20 % frequency.
Colony colour
On the basis of colony colour, the test isolates
were categorized into four groups. Group I
consisted three isolates with white colony
(FOU 2, FOU 19 and FOU 30) shared 30 %
frequency. Group II contained two isolates
with purple colony (FOU 3 and FOU 13)
containing 20 % frequency, group III
consisted three isolates with pink colony
(FOU 6, FOU 12 and FOU 17) had 30 %
frequency, group IV consisted two isolates
with buff colony (FOU 16 and FOU 22)
shared 20 % frequency.
Colony growth rate
On the basis colony growth rate, the test
isolates were categorized as fast growing,
moderate growing and slow growing. In fast
growing category, the five isolates viz., FOU
2, FOU 6, FOU 16, FOU 19 and FOU 30 were
included with 50 % frequency. In medium /
moderate growing category, the two isolates
viz., FOU 12 and FOU 22 were included with
20 % frequency as well as in slow growing
category the three isolates FOU 3, FOU 13
and FOU 17 were included with 30 %
frequency.
Colony shape and margin
On the basis of colony shape (circular) and
colony margin (non-serrated, smoother
serrated), the test isolates were categorized
into two groups. The group I included two
isolates with circular colony and non-serrated
with smooth margin, which were FOU 19 and
FOU 30 with 20 % frequency. The group II
included the isolates with circular colony and
serrated margin, which contained rest of the
eight isolates viz., FOU 2, FOU 3, FOU 6,
FOU 12, FOU 13, FOU 16, FOU 17 and FOU
22 with 80 % frequency.
Sporulation and pigmentation
The sporulation induced by the test isolates
varied from fair (++) to excellent (++++).
However, it was excellent (++++) in six
isolates viz., FOU 2, FOU 6, FOU 12, FOU
13, FOU 16 and FOU 17 with 60 %
frequency; good (+++) in two isolates viz,
FOU 3 and FOU 22 with 20 % frequency and
fair (++) in two isolates viz., FOU 19 and FOU
2113
Int.J.Curr.Microbiol.App.Sci (2018) 7(10): 2109-2122
30 with 20 % frequency.
On the basis of pigmentation, the test isolates
were categorized into five groups. The group I
included one isolate with dark yellow
pigmentation (FOU 2) with 10 % frequency;
the group II included four isolates with pink
pigmentation (FOU 3, FOU 6, FOU 12 and
FOU 13) with 40 % frequency; the group III
included
two
isolates
with
brown
pigmentation (FOU 16 and FOU 22) with 20
% frequency.The group IV included one
isolate with yellow to brown pigmentation
(FOU 17) with 10 % frequency and the group
V included two isolates with light yellow
pigmentation (FOU 19 and FOU 30) with 20
% frequency.
Table.1 Cultural variability among the test isolates of Fusarium udum
Sr.
No.
1
2
3
4
5
6
7
8
Parameters
Colony
dia.
(mm)
Colour
Mycelial
Appearance
Growth speed
Colony shape
Colony margin
Sporulation
Pigmentation
Isolates (District Location) / Characteristics
FOU 2
(Ahmednagar
)
82.67
FOU 3
(Akola)
FOU 6
(Beed)
63.00
84.33
White
Luxuriant,
appressed,
felted and
fluffy
Fast
Circular
Serrated
++++
Dark Yellow
Purple
Scanty,
partially
appressed and
fibrous
Slow
Circular
Serrated
+++
Pink
Pink
Luxuriant,
appressed
and fluffy
Fast
Circular
Serrated
++++
Pink
FOU 12
(JalnaBadnapur)
87.67
FOU 13
(JalnaMantha)
58.67
Pink
Luxuriant,
partially
appressed and
fibrous
Medium
Circular
Serrated
++++
Pink
Purple
Scanty,
partially
appressed
and fibrous
Slow
Circular
Serrated
++++
Pink
Continued….
Sr.
No.
Parameters
1
2
3
Colony dia. (mm)
Colour
Mycelial
Appearance
4
5
6
Growth speed
Colony shape
Colony margin
7
8
Sporulation
Pigmentation
FOU 16
(Latur)
89.00
Buff
Luxuriant,
partially
appressed and
fibrous
Fast
Circular
Serrated
++++
Brown
Isolates (District Location) / Characteristics
FOU 17
FOU 19
FOU 22
(Nagpur)
(Nashik)
(Parbhani)
54.67
81.33
83.33
Pink
White
Buff
Scanty, partially
Luxuriant,
Luxuriant,
appressed and
appressed,
partially
fibrous
felted and
appressed and
fluffy
fluffy
Slow
Fast
Medium
Circular
Circular
Circular
Serrated
Non-Serrated,
Serrated
smooth
++++
Yellow to Brown
++
Light Yellow
Sporulation: ++++ = Excellent, +++ = Good, ++ = Fair, + = Poor, Dia: Diameter
2114
+++
Brown
FOU 30
(Satara)
88.67
White
Luxuriant,
appressed,
felted and
fluffy
Fast
Circular
NonSerrated,
smooth
++
Light
Yellow
Int.J.Curr.Microbiol.App.Sci (2018) 7(10): 2109-2122
Table.2 Grouping and frequency of F. udum test isolates based on cultural variability
Groups
Cultural parameters
No. of Isolates code
Frequency
isolates
1. Colony growth (Range and category)
Group-I
Maximum (> 80 mm)
07
FOU 2, 6, 12, 16, 19, 22 and 70 %
30
Group-II
Medium (60 to 80 mm)
01
FOU 3
10 %
Group-III Minimum (< 60 mm)
2. Colony colour
Group-I
White
Group-II
Purple
Group-III Pink
Group-IV Buff
3. Mycelium appearance
Group I
Luxuriant and appressed
02
FOU 13 and FOU 17
20 %
03
02
03
02
FOU 2, FOU 19 & FOU 30
FOU 3 and FOU 13
FOU 6, FOU 12 & FOU 17
FOU 16 and FOU 22
30 %
20 %
30 %
20 %
04
Group II
03
FOU 2, FOU 6, FOU 19 and 40%
FOU 30
FOU 12, FOU 16 & FOU 22 30%
03
FOU 3, FOU 13 & FOU 17
05
02
03
FOU 2, 6, 16,19 & FOU 30
50 %
FOU 12 and FOU 22
20 %
FOU 3, FOU 13 and FOU 30 %
17
08
FOU 2, 3, 6, 12, 13, 16, 17 80 %
and 22
FOU 19 and FOU 30
20 %
Luxuriant and partially
appressed
Group III Scanty
and
partially
appressed
4. Growth speed (mm / day)
Group I
Fast (12 mm / day)
Group II
Medium (10 mm / day)
Group III Slow (06 mm / day)
5. Colony margin
Group I
Serrated
Group II
Non-serrated
6. Sporulation
Group I
Excellent (++++)
02
Group II
Good (+++)
Group III Fair (++)
7. Pigmentation
Group I
Dark yellow
Group II
Light yellow
Group III Yellow to Brown
Group IV Pink
02
02
Group V
02
Brown
06
30 %
FOU 2, 6, 12,13,16 and 60 %
FOU 17
FOU 3 and FOU 22
20 %
FOU 19 and FOU 30
20 %
01
02
01
04
FOU 2
FOU 19 and FOU 30
FOU 17
FOU 3, FOU 6, FOU 12 and
FOU 13
FOU 16 and FOU 22
2115
10 %
20 %
10 %
40 %
20 %
Int.J.Curr.Microbiol.App.Sci (2018) 7(10): 2109-2122
Table.3 Morphological variability among the test isolates of F. udum
Sr.
No.
Isolates
1
2
3
4
5
6
7
8
9
10
FOU 2
FOU 3
FOU 6
FOU 12
FOU 13
FOU 16
FOU 17
FOU 19
FOU 22
FOU 30
Micro-conidia
Av. Size (µm)
Septation
Length x Breadth
(No.)
8.62 x 3.70
7.41 x 3.10
6.55 x 2.73
8.74 x 3.92
6.32 x 2.81
9.02 x 4.10
9.34 x 4.15
5.92 x 2.61
8.43 x 3.54
5.33 x 2.62
0
0-1
0
0
0
0
0- 1
0
0
0
Macro-conidia
Av. Size (µm)
Septation
Length x Breadth
(No.)
28.60 x 4.30
25.63 x 4.40
23.20 x 3.90
28.29 x 4.10
26.22 x 4.30
31.83 x 3.89
30.86 x 5.52
22.40 x 4.62
27.62 x 4.10
24.80 x 4.28
1- 4
2- 4
1- 3
1- 3
2- 4
1- 4
1- 3
2- 3
3- 4
1- 2
Table.4 Grouping and frequency of F. udum test isolates based on morphological variability
Sr.
Conidia
Group and size
No.
(µm)
I. Length x Breadth size
Group I: Large
1
Micro- (8.1-10 µm x 3-4 µm)
conidia Group II: Medium
(7.1-8 µm x 3-4 µm)
Group III: Small
(5-7 µm x 2-3 µm)
Group I: Large
(28.1-32 µm x 4-6 µm)
2
Macro- Group II: Medium
conidia (26.1-28 µm to 4-5
µm)
Group III: Small
(22-26 µm x 3-5 µm)
II. Septation
Group I:
No septation
1
Micro
Group II:
conidia Single septation
Group I: Maximum
(1-4, 2-4 & 3-4)
Group II: Medium
2
Macro (1-3, & 2-3)
conidia Group III: Minimum
(1-2)
No. of
Isolates
Code of isolates
Frequency
05
FOU 2, 12, 16, 17 and
FOU 22
FOU 3
50 %
FOU 6, 13, 19 and FOU
30
FOU 2, 12, 16 and FOU
17
FOU 13 & FOU 22
40 %
04
FOU 3, 6, 19 and FOU
30
40 %
08
FOU 2,6,12,13,16,19,22
and FOU 30
FOU 3 & FOU 17
80 %
FOU 2, 3, 13, 16 and
FOU 22
FOU 6, 12, 17 and FOU
19
FOU 30
50 %
01
04
04
02
02
05
04
01
2116
10 %
40 %
20 %
20 %
40 %
10 %
Int.J.Curr.Microbiol.App.Sci (2018) 7(10): 2109-2122
Table.5 Polymorphic amplifications generated by RAPD markers
Sr.
Primer
No.
1.
OPA 9
2.
OPA 17
3.
OPA 3
4.
OPB 4
5.
OPB 12
6.
OPB 15
7.
OPC 1
8.
OPC 5
9.
OPC 14
10. OPD 2
11. OPD 3
12. OPD 5
13. OPD 7
14. OPC 19
15. OPC 20
16. OPB 10
17. OPB 20
Overall
Average
Total
No. of amplicons
10
7
9
19
12
15
9
6
18
19
23
16
14
21
16
38
22
274
16.11
Average No. of
bands / primer
0.1
0.7
0.9
1.9
1.2
1.5
0.9
0.6
1.8
1.9
2.3
1.6
1.4
2.1
1.6
3.8
2.2
1.56
Total No.
of Loci
3
4
4
5
4
9
2
3
7
7
6
8
5
8
7
10
6
98
5.76
No. of polymorphic
Loci
3
4
4
5
4
9
2
3
7
7
6
8
5
8
7
10
6
98
5.76
Per cent
Polymorphism (%)
100
100
100
100
100
100
100
100
100
100
100
100
100
100
100
100
100
100
100
Table.6 Similarity index in DNA fingerprinting of F. udum isolates
FOU 2
FOU 3
FOU 6
FOU 12
FOU 13
FOU 16
FOU 17
FOU 19
FOU 22
FOU 30
FOU 2
1.0000000
0.0000000
0.0000000
0.0000000
0.0000000
0.1666667
0.0000000
0.0000000
0.0217391
0.0000000
FOU 3
FOU 6
FOU 12
FOU 13
FOU 16
FOU 17
FOU 19
FOU 22
FOU 30
1.0000000
0.1525424
0.1363636
0.0882353
0.0800000
0.2894737
0.1600000
0.1964286
0.2881356
1.0000000
0.3846154
0.2553191
0.0208333
0.1451613
0.3793103
0.2714286
0.3424658
1.0000000
0.3666667
0.0689655
0.1041667
0.2916667
0.2241379
0.2500000
1.0000000
0.0588235
0.1111111
0.2250000
0.1372549
0.1166667
1.0000000
0.0714286
0.0540541
0.0909091
0.0178571
1.0000000
0.2200000
0.2500000
0.2539683
1.0000000
0.4629630
0.3134328
1.0000000
0.2597403
1.0000000
Table.7 Dis-similarity index in DNA fingerprinting of F. udum isolates
FOU 2
FOU 3
FOU 6
FOU 12
FOU 13
FOU 16
FOU 17
FOU 19
FOU 22
FOU 30
FOU 2
0.0000000
1.0000000
1.0000000
1.0000000
1.0000000
0.8333333
1.0000000
1.0000000
0.9782609
1.0000000
FOU 3
FOU 6
FOU 12
FOU 13
FOU 16
FOU 17
FOU 19
FOU 22
FOU 30
0.0000000
0.8474576
0.8636364
0.9117647
0.9200000
0.7105263
0.8400000
0.8035714
0.7118644
0.0000000
0.6153846
0.7446809
0.9791667
0.8548387
0.6206897
0.7285714
0.6575342
0.0000000
0.6333333
0.9310345
0.8958333
0.7083333
0.7758621
0.7500000
0.0000000
0.9411765
0.8888889
0.7750000
0.8627451
0.8833333
0.0000000
0.9285714
0.9459459
0.9090909
0.9821429
0.0000000
0.7800000
0.7500000
0.7460317
0.0000000
0.5370370
0.6865672
0.0000000
0.7402597
0.0000000
2117
Int.J.Curr.Microbiol.App.Sci (2018) 7(10): 2109-2122
Fig.1 Cultural (Colony growth) variability among the test isolates of F. udum
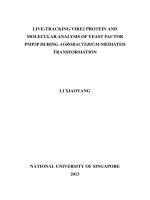
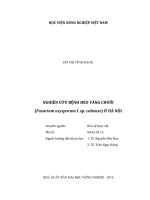
Fig.2 Dendrogram based on RAPD analysis depicting relationship between
10 test isolates of F. udum
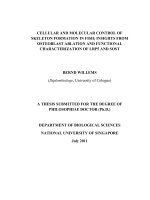
Fig.3 RAPD fingerprient profile of 10 isolates of F. udum (DNA)
2118
Int.J.Curr.Microbiol.App.Sci (2018) 7(10): 2109-2122
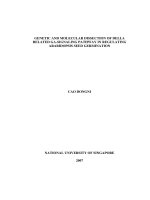
Fig.4 RAPD fingerprient profile of 10 isolates of F. udum by using primer OPC 19 & OPC 20
Lane M- marker (1 kb DNA ladder); Lanes 1-10 isolates
Fig. 5 RAPD fingerprient profile of 10 isolates of F. udum by using primer OPB 10 Lane Mmarker (1 kb DNA ladder); Lanes 1-10 isolates
Fig.6 RAPD fingerprient profile of 10 isolates of F. udum by using primer OPB 20 Lane Mmarker (1 kb DNA ladder); Lanes 1-10 isolates
Morphological variability among F. udum
isolates
Conidial size
The results revealed that all the ten isolates
exhibited a wide range of variability in
respect of size of microconidia and macroconidia. Average size of micro-conidia of the
test isolates was ranged from 5.33 µm x 2.62
µm (FOU 30) to 9.34 µm x 4.15 µm (FOU
17). However, maximum micro-conidial size
(9.34 x 4.15) was recorded in isolate FOU 17.
This was followed by the isolates viz., FOU
16 (9.02 x 4.10), FOU 12 (8.74 x 3.92), FOU
2 (8.62 x 3.70), FOU 22 (8.43 x 3.54), FOU 3
(7.41 x 3.10), FOU 6 (6.55 x 2.73), FOU 13
(6.32 x 2.81), FOU 19 (5.92 x 2.61) and FOU
30 (5.33 µm x 2.62 µm).
2119
Int.J.Curr.Microbiol.App.Sci (2018) 7(10): 2109-2122
Average size of macro-conidia of the test
isolates was ranged from 22.40 µm x 4.62 µm
(FOU 19) to 31.83 µm x 3.89 µm (FOU 16).
However, maximum macro-conidial size
(31.83 x 3.89) was recorded in isolate FOU
16.
This was followed by the isolates viz., FOU
17 (30.86 µm x 5.52 µm), FOU 2 (28.60 x
4.30), FOU 12 (28.29 x 4.10), FOU 22 (27.62
x 4.10), FOU 13 (26.22 x 4.30), FOU 3 (25.63
x 4.40), FOU 30 (24.80 x 4.28), FOU 6 (23.20
x 3.90) and FOU 19 (22.40 µm x 4.62 µm).
In case of micro-conidial size three groups
viz., Group I (large), II (medium) and III
(small) showed 50 %, 10 % and 40 %
frequency respectively where as in case of
macro-conidial size groups viz., Group I
(large), II (medium) and III (small) showed
40 %, 20 % and 40 % frequency, respectively.
frequency, respectively. Whereas, in case of
macro-conidial septation, three groups viz.,
Group I (maximum), II (medium) and III
(minimum) showed 50 %, 40 % and 10 %
frequency, respectively. (Table 3 and 4)
The pathogenic, cultural and morphological
variability of F. udum found in present study
are in consonance with the earlier reports
(Madhukeshwara and Seshadri, 2001; Kiprop
et al., 2002; Reddy 2006; Mahesh et al.,
2010; Tiwari and Dhar, 2011; Rangaswamy et
al., 2012; Kumar and Upadhyay, 2014;
Shinde et al., 2014, Rashmi and
Chattannavar, 2016). These results indicated
that there is existence of pathogenic, cultural
and morphological variability in Fusarium
oxysporum f. sp. udum which might be due to
environmental variation or struggle of
existence or such several causes.
Molecular variability
Septation
DNA fingerprinting profile
Results revealed least variability was
observed among the test isolates in respect of
septa on the micro-conidia. Among the test
isolates, septation was ranged from 0 to 1.
Isolates FOU 3 and FOU 17 were recorded 01 septation, whereas isolates FOU 2, FOU 6,
FOU 12, FOU 13, FOU 16, FOU 19, FOU 22
and FOU 30 were more or less oval without
septation.
Results revealed marked variability among
the test isolates in respect of septa on the
macro-conidia. Among the test isolates,
septation was ranged from 1-2 to 3-4. Of the
test isolates, FOU 22 recorded maximum (34) septation, followed by the isolates viz.,
FOU 3 and FOU 13 (2-4), FOU 19 (2-3),
FOU 2 (1-4), FOU 6 as well as FOU 17 (1-3)
and FOU 30 (1-2 septation).
In case of micro-conidial septation two
groups viz., Group I (No septation) and II
(single septation) showed 80 % and 20 %
The RAPD-PCR protocol described by
Chavan, (2004) was used with some
modifications to produce DNA fingerprinting
profile of 10 fungal isolates of F. udum
species. The PCR amplification reaction was
optimized by varying concentration of PCR
components. Amplification reaction was
carried out in 25 µl reaction mixtures
containing 30 ng of fungal genomic DNA, 1X
PCR buffer, 1.5 mM MgCl2, 0.25 mM
dNTPs, 10 pmol primers and 1.50 U of Taq
DNA polymerase. PCR amplification was
performed in master cycler gradient,
Eppendorf PCR thermocycler.
The program consisted of an initial denaturing
at 94 oC for 4 min, followed by 39 cycles
comprising denaturation at 94 oC, 1 min,
annealing at 37 oC and extension of 2 min. at
72 oC. The final extension was set at 72 oC for
10 min. PCR amplified product was separated
by electrophoresis on 1.5 % agarose gel in 1X
2120
Int.J.Curr.Microbiol.App.Sci (2018) 7(10): 2109-2122
TAE buffer, stained with ethidium bromide
and visualized under gel documentation
system.
Diversity analysis using RAPD marker
The genomic DNA of 10 isolates of F. udum
isolated from pigeonpea crop was subjected
for PCR amplification by using RAPD
primers. Initially 17 random primers viz.,
OPA to OPD series were screened (random
primer kit A, Operon Tech., USA). These 17
primers were found more polymorphic and
generated significant data for discrimination
of the test 10 isolates.
two isolates namely FOU 2 and FOU 16
while second cluster contained eight isolates
viz., FOU 3, FOU 17, FOU 6, FOU 12, FOU
13, FOU 19, FOU 22 and FOU 30. The
isolates FOU 19 and FOU 22 were found to
be most similar with 46% similarity. Exactly
reciprocal / opposite results were obtained in
dissimilarity index.
Molecular variability (Genetic diversity)
among Fusarium udum was demonstrated
earlier by many scientists. (Kumar et al.,
2007; Datta et al., 2009; Kiprop et al., 2005;
Prasad et al., 2012; Mesapogu et al., 2012 and
Shinde et al., 2015)
The average size of amplicons generated by
the test primers was ranged between 100 bp to
10 kb. The RAPD-PCR amplification results
showed that about 17 RAPD primers
generated a total of 274 bands, which were
found polymorphic with an average of 16.11
bands per primer. The primers OPB-10, OPB15, OPC-19, OPC-5, OPC-14, OPD-02 and
OPC-20 were found more informative, as they
generated maximum number of bands i.e. 10,
9, 8, 8, 7, 7 and 6 bands, respectively.
Thus, in present study pathological, cultural,
morphological and molecular variability
observed among the isolates of F. udum may
be attributed to their distribution in different
Agro-climatic zones of the Maharashtra state,
long term F. udum pathogen at a particular
location and ability of the pathogens to adopt
themselves in different cultivars (Table 5, 6, 7
and Fig. 2).
OPC-1, OPC-5 and OPA-9 generated low
number of 2, 3 and 3 bands, respectively. All
amplicons were found polymorphic with 100
% polymorphism. The similarity matrix based
on Jaccard’s coefficient was prepared by
using the scored data of banding pattern with
the help of NTSys pc software. The highest
similarity (0.462) was found between the
isolates FOU 19 and FOU 22 followed by
0.384 between FOU 6 and FOU 12. The
lowest similarity (0.00) was found between
the isolates FOU 2 and FOU 30.
Anonymous (2017). Annual Report for 2017. Chief
Statistician, Pune, Maharashtra, India.
Chavan, R. L. (2004). Study of genetic variability
among isolates of Alternaria species infecting
sunflower:
cultural,
morphological,
pathological, biochemical and molecular
investigations. M. Sc. (Agri.) Thesis, M.A.U.
Parbhani., Pp. 1-72.
Dutta, S., Rita, R., Dhar, V., Chaudhary, R. G. and
Gurha, S. N. (2009). RAPD based diagnosis
and diversity analysis of Fusarium wilt
pathogen of pulse crops. J. Food Legumes, 22
(2): 77-81.
Jaccard, P. (1908). Nawelle recherché surla
distribution Florale. Bulletin de la Societc
Vaucloise des Sciences Naturelles., 44: 223270.
Kannaiyan, J., Nene, Y. L., Reddy, M. V., Rayan, J.
G. and Raju, T. N. (1984). Prevalence of
pigeonpea diseases and associated crop losses
Dendrogram generated by UPGMA cluster
analysis based on Jaccard’s similarity
coefficient obtained from RAPD markers
through NTSys pc software revealed two
major clusters. The first cluster consisted of
References
2121
Int.J.Curr.Microbiol.App.Sci (2018) 7(10): 2109-2122
in Asia and Amirica. Trop. J. Pest
Management, 30: 62-71.
Kiprop, E. K., Baudoin, J. P., Mwang'ombe, A. W.,
Kimani, P. M. and Mergeai, G. (2002).
Characterization of Kenyan Isolates of
Fusarium udum from Pigeonpea [Cajanus
cajan
(L.)
Millsp.]
by
Cultural
Characteristics, Aggressiveness and AFLP
Analysis., J. Phytopathol. 150 (10): 517–525.
Kiprop, E. K., Mwang’ombe, A. W., Baudoin, J. P.,
Kimani, P. M. and Mergeai, G. (2005).
Genetic Variability among Fusarium udum
isolates from pigeonpea. African J. Crop Sci.,
13 (3): 163-172.
Kumar, D. and Choudhary, U. (2006). Influence of
temperature on mycelial growth and
sporulation of A. brassicae and A.
brassicicola causing blight. J. Res. SKUASTJ. 5 (1): 48-51.
Kumar, S. and Upadhyay, J. P. (2014). Studies on
cultural morphological and pathogenic
variability in isolates of Fusarium udum
causing
wilt
in
pigeonpea.
Indian
Phytopathol, 67 (1): 55-58.
Kumar, V., Chavan, V. B. and Shrivastva, J. P.
(2007).
Pathogenic
and
biochemical
variability in Fusarium udum causing
pigeonpea wilt. Indian Phytopathol. 60 (3):
281-288.
Madhukeshwara, S. S. and Sesadri, V. S. (2001).
Variation and management of Fusarium udum
of pigeonpea (Cajanus cajan (L.) Millsp.)
Trop. Agril. Res. 13: 380-394.
Mahesh, M., Saifulla, M., Prasad, P. S. and
Sreenivasa, S. (2010). Studies on cultural
variability of Fusarium udum isolates in
India. Inter. J. Sci. Nature 1 (2): 219- 225.
Mesapogu, S., Bakshi, Achala, Babu, B. K., Reddy,
S. S., Sexsena, S. and Arora, D. K. (2012).
Genetic diversity and pathogenic variability
among Indian isolates of Fusarium udum
infecting pigeonpea (Cajanus cajan (L.)
Millsp.). Inter. Research J. Agril. Sci. Soil
Sci. 2 (1): 51-57.
Prasad, P. S., Saifulla, M., Mallikarjuna, N.,
Thimmegowda, P. R. and Lakshmipathy, R.
N. (2012). Integrated disease management of
Pigeonpea wilt Fusarium udum (Butler).
Madras Agric. J., 99 (10): 811-814.
Rangaswany, E., Pushpavati, B., Mallikarjuna, M.
G. and Reddy, P. N. (2012). Morphological
and cultural characters of Fusarium udum.
Bioinfolet, 9 (4): 572-575.
Rashmi, U. S. and Chattannavar, S. N. (2016).
Cultural and morphological diversity among
the isolates of Fusarium udum in Karnataka.
J. Fa. M. Sci., 29 (23): 365-369.
Reddy, B. A. and Saifulla, M. (2006). Variation in
growth and morphology of Fusarium udum
isolates. Karnataka J. Agril. Sci., 19 (2): 318322.
Reddy, M. V., Nene, Y. L., Kannaiyan, J., Raju, T.
N., Saka, V. N., Davor, A. T., Songa, W. P.
and Omanga, P. (1990). Pigeonpea lines
resistant to wilt in Kenya and Malawi. Inter.
Pigeonpea Newsl, 6: 34.
Reddy, M. V., Raju, T. N, Sharma, S. B., Nene, Y.
L. and McDonald, D. (1993). Hand book of
pigeonpea diseases Information Bulletin. 42:
8-10.
Shinde, A. S., Kalaskar, S. R., Rathod, A. H.,
Sheikh, W. A. and Acharya, S. (2015). RAPD
based molecular diversity analysis of different
Fusarium udum Butler isolates of pigeonpea
wilt. Inter.J. Pl. Protec., 8 (1): 81-85.
Shinde, V. S., Zagade, S. N. and Chavan, A. A.
(2014). Cultural and morphological variation
in Fusarium udum. J.Pl. Dis. Sci., 9 (2): 237244.
Tiwari, S. and Dhar, V. (2011). Prevalence of new
variants of Fusarium udum in India. Indian
Phytopath, 64: 243-246.
Upadhyay, R. S. and Rai, B., (1992). Wilt of
pigeonpea. In: Plant Disease of International
Importance
(Eds.
Singh,
U.S.,
Mukhopadhyaya, A., Kumar, J. and Chaube,
H.S.), Prentice Hall, Englewood Cliffs New
Jersey, pp. 388-414.
How to cite this article:
Ghante, P.H., K.M. Kanase, S.P. Kale, R.L. Chavan, K.M. Sharma and Ghuge, S.B. 2018.
Cultural, Morphological and Molecular Variability of Fusarium oxysporum f. sp. udum Isolates
by RAPD Method. Int.J.Curr.Microbiol.App.Sci. 7(10): 2109-2122.
doi: />
2122