Functional consequences of enhanced expression of STIM1 and Orai1 in Huh-7 hepatocellular carcinoma tumor-initiating cells
Bạn đang xem bản rút gọn của tài liệu. Xem và tải ngay bản đầy đủ của tài liệu tại đây (2.11 MB, 10 trang )
Karacicek et al. BMC Cancer
(2019) 19:751
/>
RESEARCH ARTICLE
Open Access
Functional consequences of enhanced
expression of STIM1 and Orai1 in Huh-7
hepatocellular carcinoma tumor-initiating
cells
B. Karacicek1, Y. Erac2 and M. Tosun3*
Abstract
Background: The endoplasmic reticulum (ER) Ca2+ sensor, stromal interaction molecule1 (STIM1) activates the
plasma membrane (PM) channel Orai1 in order to mediate store-operated Ca2+ entry (SOCE) in response to ER store
depletion. Enhanced expression of STIM1 in cancer tissue has been associated with poor patient prognosis.
Therefore, this study investigated the functional consequences of enhanced expression of STIM1 and Orai1 in a
tumor-initiating subpopulation of Huh-7 hepatocellular carcinoma (HCC) cells that express epithelial cell adhesion
molecule (EpCAM) and Prominin 1 (CD133).
Methods: We performed qRT-PCR, intracellular Ca2+ monitoring, protein analyses, and real-time cell proliferation
assays on EpCAM(+)CD133(+) subpopulation of tumor-initiating Huh-7 HCC cells expressing high levels of STIM1 and/
or Orai1. Statistical significance between the means of two groups was evaluated using unpaired Student’s t-test.
Results: Enhanced STIM1 expression significantly increased ER Ca2+ release and proliferation rate of
EpCAM(+)CD133(+) cells.
Conclusion: STIM1 overexpression may facilitate cancer cell survival by increasing ER Ca2+-buffering capacity, which
makes more Ca2+ available for the cytosolic events, on the other hand, possibly preventing Ca2+-dependent enzymatic
activity in mitochondria whose Ca2+ uniporter requires much higher cytosolic Ca2+ levels.
Keywords: HCC, SOCE, TIC, STIM1, Orai1, Ca2+
Background
Hepatocellular carcinoma (HCC) appears to be the third
leading cause of cancer-related deaths worldwide [1–11].
The primary issue in HCC cases is the high recurrence
rates [12] possibly due to the existence of chemotherapyresistant tumor-initiating cell (TIC) subpopulations [13].
Tumor-initiating cells constitute 0.01–1% of tumor mass
[14, 15]. These cells express certain cell surface antigens
used for separating them from other cell types within the
heterogeneous tumor cell lines [16]. Epithelial cell adhesion molecule (EpCAM) and Prominin 1 (CD133) are frequently used to identify Huh-7 human HCC TICs [17, 18]
* Correspondence:
3
Department of Pharmacology, School of Medicine, Izmir University of
Economics, 35330 Izmir, Turkey
Full list of author information is available at the end of the article
as NOD/SCID mice developed tumor after receiving Huh7 cells expressing these two antigens [19].
SOCE, a major Ca2+ influx through Ca2+-release
activated Ca2+ (CRAC) channels in non-excitable cells
[20–25], has been shown to be operational both in normal hepatocytes and HCC [26]. SOCE components are
the ER-resident Ca2+ sensor stromal interaction molecule 1 (STIM1) [27] and the PM Ca2+ channel Orai1
[28–30]. The roles of STIM1 and Orai1 in carcinogenesis, tumor initiation, proliferation and metastasis have
recently attracted significant attention [27, 31]. Indeed,
altered expression of STIM1 and Orai1 is a hallmark of
many cancer types, suggesting their potential value as
prognostic biomarkers in cancer [27, 32–35].
TICs appear to be responsible for high recurrence
rates as well as for chemoresistance [36]. HCC cells are
© The Author(s). 2019 Open Access This article is distributed under the terms of the Creative Commons Attribution 4.0
International License ( which permits unrestricted use, distribution, and
reproduction in any medium, provided you give appropriate credit to the original author(s) and the source, provide a link to
the Creative Commons license, and indicate if changes were made. The Creative Commons Public Domain Dedication waiver
( applies to the data made available in this article, unless otherwise stated.
Karacicek et al. BMC Cancer
(2019) 19:751
Page 2 of 10
Table 1 Oligonucleotide sequences of qRT-PCR primers
Target Accession number
Gene
Sequence (5′-3′)
Amplicon size (bp)
NM_001277961
STIM1
F: AGC AGA GTT TTG CCG AAT TG
132
R: ATC ACT TTC TTC CAC ATC CAC AT
NM_032790.3
Orai1
F: CAG AGT TAC TCC GAG GTG ATG AG
119
R: GAG AGC AGA GCC GAG GTC C
NR_003286
18S rRNA
F: CGA CGA CCC ATT CGA ACG TCT
312
R: GCT ATT GGA GCT GGA ATT ACC G
NM_000927.4
MDR1
F: CAG AGG GGA TGG TCA GTG TT
197
R: TCA TAG GCA TTG GCT TCC TT
F forward, R reverse, bp base pair
a non-excitable cell type, where SOCE plays a crucial
role in Ca2+ homeostasis and signaling [37]. In many
cancer types including HCC, enhanced expression of
STIM1 and Orai1 have been shown to enhance carcinogenesis including proliferation, migration and invasion
processes [26, 38, 39]. Previous studies have reported
that STIM1 and Orai1 molecules mix at a specific ratio
to encode functional CRAC channel assembly [40, 41].
Based on crystallographic and electrophysiological studies, STIM1 exists as a dimer under resting conditions,
and binds to Orai1 in a nonlinear fashion such that all
six Orai1 binding sites must be occupied for the activation of SOCE [42]. However, the structural basis of
STIM1 interaction with Orai1 within the channel assembly is not known. Therefore, the purpose of this
study is to investigate the functional impact of altered
stoichiometry of STIM1 and/or Orai1 by employing overexpression plasmid vectors on intracellular Ca2+ dynamics
as well as carcinogenic properties of Huh-7
EpCAM(+)CD133(+) cells.
Methodsn
Cell culture
Human HCC cell lines (Huh-7) were provided by
Dr. Ozturk (IBG İzmir), originally from Dr. Jack Wands
Laboratory (Massachusetts General Hospital, Boston,
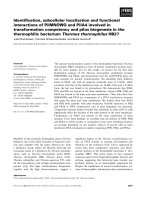
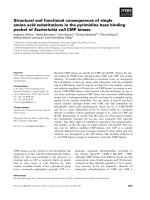
Fig. 1 EpCAM and CD133 antigen-expressing Huh-7 cell distribution after separation. a EpCAM(+)CD133(+) 96.6% in Day 0, P5 gate for
EpCAM(+)CD133(+), (b) EpCAM(−)CD133(−) Huh-7 cells 99.5% in Day 0, P4 gate for EpCAM(−)CD133(−) and (c) EpCAM(+)CD133(+) in Day 5.
EpCAM-FITC: fluorescein isothiocyanate conjugated EpCAM, CD133-PE: Phycoerythrin conjugated CD133
Karacicek et al. BMC Cancer
(2019) 19:751
Page 3 of 10
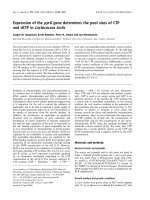
Fig. 2 STIM1 mRNA expression levels in control and plasmid-transfected EpCAM(+)CD133(+) cells. Shown are (a) control vs. STIM1-OE and (b)
control vs. STIM1 + Orai1-OE (Target gene/18S rRNAx102; *p < 0.05; **p < 0.01, Student t-test, unpaired data, n = 4)
MA) as a gift, and tested for authenticity via DNA profiling (Applied Biosystem’s Identifier kit, PN 4322288) at
DNA Sequencing & Analysis Shared Resource, University of Colorado Cancer Center. The authenticity was
reconfirmed by Idexx Bioresearch Company (Germany)
just before initiating our studies. In addition to these,
the cells have been also checked regularly in our laboratory for mycoplasma contamination by using MycoAlert
Mycoplasma Detection kit (Lonza). Parental Huh-7
HCC cells and the sorted cells after Fluorescence Activated Cell Sorting (FACS, FACSAria III, BD) were maintained in complete growth medium (Dulbecco’s modified
Eagle medium, DMEM, Sigma) containing 10% heatinactivated fetal bovine serum (FBS, Biowest), 2 mM Lglutamine (Sigma) and 0.1 mM non-essential amino
acids (Sigma).
Selection of EpCAM(+)CD133(+) and EpCAM(−)CD133(−)
Huh-7 cells with FACS
Huh-7 HCC cells were trypsinized, washed, and resuspended in FACS buffer (1XPBS, 1 mM EDTA, 25 mM
HEPES, 1% FBS) and filtered through 0.2 μm filter. Cells
were passed through cell strainers with pore diameters
of 100 and 30 μm (Miltenyi) to eliminate cell aggregates.
Cells (15 × 106) were centrifuged to obtain pellets,
then, resuspended in 105 μl FACS buffer followed by
reincubation with 30 μl FcR blocking reagent (Miltenyi), 15 μl EpCAM-FITC (Miltenyi) and 15 μl CD133PE (Miltenyi) for 10 min on ice. After incubation,
cells were washed with FACS buffer and sorted via a
fluorescence-activated cell sorter (FACS Aria III, BD
Biosciences). Cells with and without EpCAM and/or
CD133 were separately collected inside FBS containing tubes. After sorting, purity percentages for
EpCAM(+)CD133(+) were determined with FACSCalibur (BD Biosciences) on the fifth day.
Transfection of EpCAM(+)CD133(+) Huh-7 cells with
STIM1 and Orai1 overexpression plasmids
Cells were seeded on 6 well-plate (105 cells/well) and
transfection was performed after 24 h with X-tremeGENE
HP DNA Transfection Reagent (Roche). Following
removal of the cell media, serum-reduced media (OptiMEM) were added and incubated for additional 1 h.
100 μl Opti-MEM, 1.5 μg plasmid DNA (MO70-STIM1eYFP, pDEST501-Orai1-CFP and pCMV6 empty vector as
a control) and 1 μl X-tremeGENE HP DNA Reagent-containing transfection mix was added to each well and
incubated for 30 min at room temperature. Transfection
mix was added on the cells dropwise and shaked gently.
Plasmids were gently provided by Dr. M Trebak (Penn
State University).
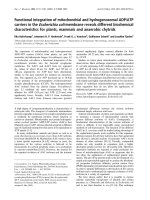
Fig. 3 Orai1 mRNA expression levels in plasmid-transfected EpCAM(+)CD133(+) cells. Shown are (a) control vs. Orai1-OE and (b) control vs.
STIM1 + Orai1-OE (Target gene/18S rRNAx102; **p < 0.01, Student t-test, unpaired data, n = 4)
Karacicek et al. BMC Cancer
(2019) 19:751
Page 4 of 10
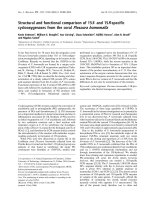
Fig. 4 STIM1 protein expression in STIM1-OE EpCAM(+)CD133(+) Huh-7 cells. Shown are (a) STIM1 control (77 kDa) vs. STIM1-OE bands (STIM1 OE;
STIM1 + eYFP ~ 103 kDa) and (b) cumulative data of STIM1 protein expression levels. STIM1 band intensities were normalized to β-actin’s (STIM1/
β-actin; **p < 0.01, Student t-test, unpaired data, n = 4)
RNA isolation and cDNA synthesis
Cells were seeded on 6-well plate (15 × 104/well). Total
RNA was isolated by using High Pure RNA Isolation
(Roche) according to the manufacturer’s instructions.
cDNA synthesis from the total RNA samples were
performed by using Transcriptor First Strand cDNA
Synthesis Kit (Roche) according to the manufacturer’s
instructions.
Real-time quantitative RT-PCR (qRT-PCR)
FastStart DNA Master SYBR Green I kit was used in
real-time qRT-PCR experiments performed (LightCycler 1.5, Roche Applied Science). Primer sequences
are shown in Table 1. All expression levels were normalized to that of internal 18S rRNA ([Target gene]/
[18S rRNA] × 100).
Protein isolation and Western blot
Protein isolation was performed on 15 × 104 cells seeded
on 6-well plate by cOmplete Lysis-M, EDTA-free
(Roche) according to the manufacturer’s instructions.
Protein extracts, separated by SDS-PAGE were transferred onto PVDF membranes, then, incubated with
antibodies targeted against STIM1 (3 μg/μl, Abcam),
Orai1 (1:750, Abcam) and β-actin (1:5000, Sigma)
overnight at 4 °C. Membranes were incubated with secondary antibodies (1:5000, anti-rabbit or anti-mouse, LICOR) for 1 h via shaking at room temperature. Protein
bands were visualized in an infrared imager (Odyssey,
LI-COR) based on the appropriate channel properties
(680RD or 800CW) of secondary antibodies.
Intracellular Ca2+
Cells seeded on circular coverslips were loaded with
5 μM Fura-2/AM (Molecular Probes) in HEPES-buffered
saline. Changes in intracellular Ca2+ levels were monitored via a front-surface spectrofluorometer (PTI QM8/
2005) as described earlier [43].
Real-time monitoring of proliferation by real-time cell
analyzer (RTCA)
Real-time label-free impedance-based monitoring of cellular proliferation assay was performed by using xCELLigence MP (Roche Applied Science). Transfected cells
were incubated in 6-well plates for 48 h. After the incubation period, 5000 cells/well were seeded in E-plate 96.
Cell proliferation was monitored at every 15 min for 72
h. Changes in proliferation rate were expressed as “cell
index” (RTCA software 1.2.1, Roche Applied Science).
Fig. 5 Orai1 protein expression in STIM1-OE EpCAM(+)CD133(+) cells. Shown are (a) Orai1 (33 kDa) bands in WB analysis and (b) cumulative data
of Orai1 protein expression levels. Orai1 band intensities were determined according to Orai1/β-actin ratios. (N.S., Student t-test, unpaired
data, n = 4)
Karacicek et al. BMC Cancer
(2019) 19:751
Page 5 of 10
Fig. 6 STIM1 protein expression in STIM1 + Orai1-OE EpCAM(+)CD133(+) cells. Shown are (a) STIM1-OE (STIM1 + eYFP ≈103 kDa) vs. STIM1 (77
kDa) bands in WB analysis and (b) cumulative data of STIM1 protein expression levels. STIM1 band intensities were normalized to β-actin’s (STIM1/
β-actin; **p < 0.01, Student t-test, unpaired data, n = 4)
Data analysis
Data expressed as mean ± standard error of the mean
(S.E.M.). “n” denotes the number of samples. Statistical
significance between the means of two groups was evaluated using Student’s t-test (unpaired data). Significance
was accepted at 0.05 level of probability.
Results
Selection of EpCAM(+)CD133(+) and EpCAM(−)CD133(−)
Huh7 cells
EpCAM(+)CD133(+) and EpCAM(−)CD133(−) Huh-7
cells were selected from a parental Huh-7 cell line via a
FACS. Figure 1a and b show the percentages of
EpCAM(+)CD133(+) and EpCAM(−)CD133(−) cells
after sorting (Day 0) and on the 5th day (Day 5) Fig. 1c.
On Day 5, as cells reach about 70% confluency in order
to be ready for the transfection procedure, the
EpCAM(+)CD133(+) cell population decreased from
96.6 to 64.3%.
In addition to microscopic examinations, overexpression (OE) efficiency of STIM1 and Orai1 in all experimental conditions (STIM1-OE, Orai1-OE, STIM1 +
Orai1-OE) on EpCAM(+)CD133(+) cells was confirmed
via real time qRT-PCR. STIM1 and Orai1 expression
levels were not significantly different between
EpCAM(+)CD133(+) and EpCAM(−)CD133(−) cells
(data not shown). In STIM1-OE and STIM1 + Orai1-OE
EpCAM(+)CD133(+) cells (Fig. 2) STIM1 increased both
in STIM1-OE (p < 0.05, Fig. 2a) and STIM1 + Orai1-OE
cells (**p < 0.01, Fig. 2b) as expected.
Orai1 mRNA level increased in Orai1-OE (**p < 0.01,
Student t-test, unpaired data n = 4, Fig. 3a) and STIM1 +
Orai1-OE (**p < 0.01, Student t-test, unpaired data, n =
4, Fig. 3b) EpCAM(+)CD133(+) cells (Fig. 3) comparable
to the control, which is similar to that of STIM1 mRNA
expression levels revealed in previous data.
In STIM1-OE EpCAM(+)CD133(+) Huh-7 cells,
STIM1 protein level was significantly higher (3 fold)
than that of the control (**p < 0.01, Student t-test,
unpaired data, Fig. 4a and b).
Although not statistically significant, the Orai1 protein
level was lower in STIM1-OE samples comparable to
that of the control (Fig. 5).
STIM1 protein levels decreased in STIM1 + Orai1-OE
EpCAM(+)CD133(+) cells (p < 0.01, Fig. 6) possibly due
to administration of STIM1 and Orai1 plasmids
together.
Intracellular Ca2+
Intracellular basal Ca2+ levels were significantly higher
in EpCAM(+)CD133(+) comparable to those of
EpCAM(−)CD133(−) cells. Although Ca2+ elevation
Fig. 7 Changes in ER Ca2+ release and SOCE in EpCAM(+)CD133(+) and EpCAM(−) CD133(−) cells. Shown are (a) EpCAM(+)CD133(+) vs.
EpCAM(−)CD133(−) (99%, Fig. 1) cells (Mean ± S.E.M.) and (b) cumulative data of ER Ca2+ release and SOCE (*p < 0.05, Student t-test, unpaired
data, n = 4–6). ΔF340/380: changes in intracellular Ca+ 2i levels
Karacicek et al. BMC Cancer
(2019) 19:751
Page 6 of 10
Fig. 8 Changes in ER Ca2+ release and SOCE in STIM1-OE EpCAM(+)CD133(+) cells. Shown are (a) control vs. STIM1-OE EpCAM(+)CD133(+) (64%,
Fig.1) cells (Mean ± SEM) and (b) cumulative data of ER Ca2+ release and SOCE (Student t-test, unpaired data, n = 4–6). ΔF340/380: changes in
intracellular Ca+ 2 levels
due to ER release was significantly higher in
EpCAM(+)CD133(+) cells (*p < 0.05, Student t-test,
unpaired data, n = 4–6), SOCE was not altered
(Fig. 7).
Although there was an apparent increase both in ER
Ca2+ release and SOCE, the data did not reach statistical
significance in STIM1-OE EpCAM(+)CD133(+) cells
(Fig. 8). No significant change was observed in basal, ER
Ca2+ release (expected) and SOCE, possibly due to increased coupling efficiency between depleted ER and
Orai1. Although ER Ca2+ release and SOCE decreased in
Orai1-OE EpCAM(+)CD133(+) cells, the data were not
statistically significant (Fig. 9). SOCE increased significantly (p < 0.05, Fig. 10) in STIM1+ Orai1-OE cells without any change in ER Ca2+ release.
Cell proliferation patterns in EpCAM(+)CD133(+) and
EpCAM(−)CD133(−), STIM1-OE and STIM1 + Orai1-OE
EpCAM(+)CD133(+) cells
Elevations in impedance (cell index) in RTCA show an
increased cellular proliferation rate in real-time. In this
study, differences in the cell proliferation pattern were
monitored in two groups [EpCAM(+)CD133(+) vs.
EpCAM(−)CD133(−) cells and STIM1-OE and STIM1 +
Orai1-OE EpCAM(+)CD133(+) cells]. The proliferation
rate at 48th h was significantly higher in
EpCAM(−)CD133(−) cells comparable to that of
EpCAM(+)CD133(+) (**p < 0.01, Fig. 11).
We also monitored the effects of STIM1 and STIM1 +
Orai1 overexpression on cell proliferation in
EpCAM(+)CD133(+) Huh-7 cells. Comparable to the
control, STIM1-OE cells at 72nd h showed the highest
proliferation rate (p < 0.01, Fig. 12); higher than that of
STIM1 + Orai1-OE.
The difference in multidrug resistance gene (MDR1)
expression between tumor-initiating cells and tumor cell
lines as well as the effects of STIM1 and Orai1 overexpression on MDR1 transcription in a number of experimental settings were investigated as increases in SOCE
appeared to be associated with chemoresistance [44].
MDR1 mRNA levels were significantly higher in
EpCAM(+)CD133(+) cells that in EpCAM(−)CD133(−)
cells (**p < 0.01, Student t-test, unpaired data, n = 4,
Fig. 13). Elevation of MDR1 in EpCAM(+)CD133(+) was
potentiated by inducing STIM1 or an Orai1 expression
and drastically increased (6-fold) by STIM1 + Orai1
overexpression (*p < 0.05, Student t-test, unpaired data,
n = 4, data not shown).
Fig. 9 Changes in ER Ca2+ release and SOCE in Orai1-OE EpCAM(+)CD133(+) cells. Shown are data from (a) control vs. Orai1 OE
EpCAM(+)CD133(+) (64%, Fig. 1) cells (Mean ± S.E.M.) and (b) cumulative data of ER Ca2+ release vs. SOCE in (Student t-test, unpaired data, n = 5).
ΔF340/380: changes in intracellular Ca+ 2 levels
Karacicek et al. BMC Cancer
(2019) 19:751
Page 7 of 10
Fig. 10 Changes in ER Ca2+ release and SOCE in STIM1 + Orai1 overexpressed EpCAM(+)CD133(+) cells. Shown are (a) control vs. STIM1 + Orai1OE EpCAM(+)CD133(+) (64%, Fig. 1) (Mean ± S.E.M.) and (b) cumulative data of ER Ca2+ release and SOCE (*p < 0.05, Student t-test, unpaired data,
n = 5). ΔF340/380: changes in intracellular Ca+ 2 levels
Discussion
In addition to being involved in intracellular Ca2+
homeostasis mechanism of non-excitable cells, SOCE
appears to be operational in hepatocellular carcinogenesis [26]. In this study, the role of SOCE components,
STIM1 and Orai1, reportedly involved in intracellular
Ca2+ regulation was investigated on Huh-7 TICs expressing cell surface antigens EpCAM and CD133
through monitoring intracellular Ca2+ dynamics (ER
Ca2+ release and SOCE), proliferation and MDR1 expression responsible partly for drug resistance. High
intracellular Ca2+ concentration comprises toxic and
proapoptotic conditions for cells. Excessive Ca2+ is buffered by certain proteins (e.g., calsequestrin and calreticulin) inside ER and by mitochondria. ER Ca2+ release and
SOCE are significantly higher in EpCAM(+)CD133(+)
cells comparable to that of EpCAM(−) CD133(−).
Overexpression of STIM1 and Orai1 is shown in many
cancer types like prostate cancer, breast cancer, glioblastoma and hepatocellular carcinoma [33]. More specifically, STIM1 overexpression is commonly seen in HCC
[26, 39]. Among the three overexpression groups of
EpCAM(+)CD133(+) Huh-7 cell subpopulation in our
study, STIM1-OE showed the highest ER Ca2+ release.
As STIM1 has Ca2+ binding EF hand domains located
on the intracellular part of ER [45], its overexpression
may buffer more Ca2+, leading to more Ca2+ available to
be released from ER following SERCA blockade by CPA.
STIM1 is the key initiating molecule in SOCE. After ER
depletion, as a sensor of ER Ca2+ content, STIM1 accumulated in ER membrane closely located to PM with
Orai1. At this ER and PM junctions, STIM1 interacts
with Orai1 as a result SOCE is activated [46]. Lower ER
release and SOCE in Orai1 OE EpCAM(+)CD133(+)
Huh-7 cells comparable to the control cells could be due
to changes in coupling stoichiometry between STIM1Orai1 for SOCE [47]. Higher levels of the PM channel
subunit (Orai1) might decrease effective coupling of two
molecules (STIM1 and Orai1) yielding SOCE inhibition.
Increases of ER release and SOCE in STIM1 + Orai1-OE
EpCAM(+)CD133(+) cells, show presence of appropriate
coupling stoichiometry between STIM1 and Orai1 for
SOCE as both molecules are freely available for random
interaction [32]. Similar SOCE elevations were also seen
Fig. 11 Real-time proliferation patterns of EpCAM(+)CD133(+) vs. EpCAM(−)CD133(−) cells during 48 h. Seeding density was 5000 cells/well.
Shown are (a) real-time proliferation pattern of EpCAM(+)CD133(+) vs. EpCAM(−)CD133(−) and (b) cumulative cell index data (**p < 0.01, Student
t-test, unpaired data, n = 24)
Karacicek et al. BMC Cancer
(2019) 19:751
Page 8 of 10
Fig. 12 Real-time proliferation patterns of control, STIM1-OE and STIM1 + Orai1-OE EpCAM(+)CD133(+) Huh-7 cells. Cell seeding density was, 5000
cells/well. Shown are (a) real-time proliferation pattern of STIM1-OE vs. STIM1 + Orai1-OE EpCAM(+)CD133(+) during 72 h and (b) cumulative cell
index data (***p < 0.001, ###p < 0.001, ##p < 0.05; *control vs. STIM1-OE, #control vs. STIM1 + Orai1-OE, Student t-test, unpaired data, n = 32)
in STIM1 + Orai1-OE and only STIM1-OE DU145
(prostate cancer cell line) and HEK (human embryonic
kidney) cells, respectively [40, 48, 49]. Overexpression of
Orai1 in DU145 and HEK cells also inhibited SOCE, as
observed in EpCAM(+)CD133(+) cells in our study [40,
47, 48].
TICs tended to remain in a quiescence state [50].
These EpCAM(+)CD133(+) cells have slow proliferation rates comparable to that of EpCAM(−)CD133(−)
[49, 51] as was also observed in the present study.
This may support their survival strategy in a cytotoxic
environment [34, 52, 53]. The higher proliferation
rate of STIM1-OE cells, comparable to that of
STIM1 + Orai1-OE cells, showed that upregulation of
these two genes (STIM1 and Orai1) suppresses the
cell division/proliferation possibly through attenuated
Ca2+ buffer capacity of ER. Again, the significantly
higher proliferation rate observed with STIM1-OE
cells over that of EpCAM(+)CD133(+) cells overexpressing both STIM1 and Orai1 (present data) confirms the poor prognosis of several cancer types with
overexpressed STIM1 [54–56].
Cancer cells show resistance to chemotherapeutic
treatments. This may result from drug inactivation,
changing drug targets, DNA damage repair, and efflux of
drug from cells by ABC transporters [57]. Because of the
upregulated ABC transporters, cancer cells can pump
chemotherapeutics out of the cell [58]. The “slow and
steady” feature might also be maintained by higher
MDR1 (an ABC transporter family member) expression.
Upregulated MDR1 in EpCAM(+)CD133(+) Huh-7 cells
in the present study is also in accordance with the increased MDR1 gene expression in lung cancer [59],
ovary cancer [60], osteosarcoma [61] and glioblastoma’s
[62] cancer stem cells. The signaling pathways (JAK/
STAT, PI3K/AKT, MAPK/ERK), which take place in
drug resistance, are regulated by Ca2+/calmodulin
dependent protein kinase II (CaMKII), suggesting an
interaction between Ca2+ and MDR mechanisms in liver
cancer [38].
Conclusions
Based on the higher proliferation rates observed in
STIM1-overexpressing EpCAM(+)CD133(+) Huh7 cells
compared to that of STIM1 + Orai1-OE constructs, one
may conclude that HCC stem cells might undergo a
phenotypical switch process from a quiescent to proliferative stage by increasing ER Ca2+ buffering capacity due
to higher levels of Ca2+-binding protein, STIM1. Furthermore, one may also speculate that increased ER
Ca2+ buffering prevents Ca2+- dependent processes in
mitochondria localized within the ER microenvironment
Fig. 13 MDR1 mRNA expression levels. Shown are (a) EpCAM(+)CD133(+) vs. EpCAM(−)CD133(−) cells, (b) control vs. STIM1, Orai1 and STIM1 +
Orai1-OE EpCAM(+)CD133(+) cells (Target gene/18S rRNA x102; **p < 0.01 and * p < 0.05, Student t-test, unpaired data, n = 4)
Karacicek et al. BMC Cancer
(2019) 19:751
by inhibiting Ca2+ uptake via low affinity/high capacity
Ca2+ uniporter of mitochondria.
Abbreviations
ABC: ATP-Binding Cassette; BSA: Bovine Serum Albumin; CD133: Clustering
Domain 133 (Prominin 1); CRAC: Calcium release-activated calcium;
DMEM: Dulbecco’s modified eagle medium; EpCAM: Epithelial cell adhesion
molecule; ER: Endoplasmic reticulum; FACS: Fluorescence-activated cell
sorting; FITC: Fluorescein isothiocyanate; HBS: HEPES-buffered saline;
HCC: Hepatocellular carcinoma; MDR: Multidrug resistance;
OE: Overexpressed; PE: Phytoerythrin; PM: Plasma membrane; RTCA: Realtime cell analyzer; SDS-PAGE: Sodium dodecyl sulfate polyacrylamide gel
electrophoresis; SOCE: Store-operated calcium entry; STIM: Stromal
interaction molecule; TIC: Tumor-initiating cells
Acknowledgements
Authors acknowledge Dr. Xiaozhou Hu (Izmir Biomedicine and Genome
Center, Dokuz Eylul University, Izmir, Turkey) for an excellent technical
support in flow cytometry, Dr. Mehmet Ozturk (Izmir Biomedicine and
Genome Center, Dokuz Eylul University, Izmir, Turkey) and Dr. Mohamed
Trebak (Dept. of Cellular and Molecular Physiology, Penn State Cancer
Institute, Hershey, PA, USA) for providing Huh-7 cells and plasmid vectors, respectively. Authors also thank Dr. Trebak and Dr. Donald Staub (School of
Foreign Languages at Izmir University of Economics, Izmir, Turkey) for their
critical comments on the manuscript.
Authors’ contributions
Project proposal: YE, MT; Recipient of the project grant: MT; Experimental
design: YE, MT; Experimental work: BK, YE; Analysis and interpretation: BK, YE,
MT; Manuscript preparation: BK, YE, MT. All authors read and approved the
final manuscript.
Funding
This work was supported by the Scientific and Technological Research
Council of Turkey (TUBITAK 113S399 to MT).
Page 9 of 10
6.
7.
8.
9.
10.
11.
12.
13.
14.
15.
16.
17.
18.
19.
Availability of data and materials
The datasets used and/or analyzed in the present study are available from
the corresponding author.
20.
Ethics approval and consent to participate
Not applicable.
22.
Consent for publication
Not applicable.
23.
21.
24.
Competing interests
The authors declare that they have no competing interests.
25.
Author details
1
Izmir Biomedicine and Genome Center (IBG), Dokuz Eylul University, 35340
Izmir, Turkey. 2Department of Pharmacology, Faculty of Pharmacy, Ege
University, 35100 Izmir, Turkey. 3Department of Pharmacology, School of
Medicine, Izmir University of Economics, 35330 Izmir, Turkey.
26.
27.
Received: 14 April 2019 Accepted: 16 July 2019
28.
References
1. Zhao YJ, Ju Q, Li GC. Tumor markers for hepatocellular carcinoma. Mol Clin
Oncol. 2013;1(4):593–8.
2. Yang SY, Zhang JJL, Huang XY. Orai1 and STIM1 are critical for breast tumor
cell migration and metastasis. Cancer Cell. 2009;15(2):124–34.
3. Li Y, Farmer RW, Yang Y, Martin RC. Epithelial cell adhesion molecule in
human hepatocellular carcinoma cell lines: a target of chemoresistence.
BMC Cancer. 2016;16(16):228.
4. Tam K. The roles of doxorubicin in hepatocellular carcinoma. ADMET &
DMPK. 2013;1(3):29–44.
5. Hoffmann K, Franz C, Xiao Z, Mohr E, Serba S, Buchler MW, et al. Sorafenib
modulates the gene expression of multi-drug resistance mediating ATP-
29.
30.
31.
binding cassette proteins in experimental hepatocellular carcinoma.
Anticancer Res. 2010;30(11):4503–8.
Callegari E, Gramantieri L, Negrini M, Sabbioni S. Emerging role of
microRNAs in the treatment of hepatocellular carcinoma. Gastrointest
Cancer. 2015;5:89–102.
D'Anzeo M, Faloppi L, Scartozzi M, Giampieri R, Bianconi M, Del Prete M, et
al. The role of micro-RNAs in hepatocellular carcinoma: from molecular
biology to treatment. Molecules. 2014;19(5):6393–406.
Negahdary M, Eftekhari A, Mirzaei S, Basirizadeh M, Ghobadzadeh S. Tumor
markers and hepatocellular carcinoma. J Biol Today's World. 2015;4(6):124–31.
Behne T, Copur MS. Biomarkers for hepatocellular carcinoma. Int J Hepatol.
2012;859076.
Sugimachi K, Matsumura T, Hirata H, Uchi R, Ueda M, Ueo H, et al.
Identification of a bona fide microRNA biomarker in serum exosomes that
predicts hepatocellular carcinoma recurrence after liver transplantation. Br J
Cancer. 2015;112(3):532–8.
Zhu AX. Systemic therapy of advanced hepatocellular carcinoma: how
hopeful should we be? Oncologist. 2006;11:790–800.
Sun JH, Luo Q, Liu LL, Song GB. Liver cancer stem cell markers: progression
and therapeutic implications. World J Gastroenterol. 2016;22(13):3547–57.
Malik B, Nie D. Cancer stem cells and resistance to chemo and radio
therapy. Front Biosci. 2012;4:2142–9.
Chiba T, Iwama A, Yokosuka O. Cancer stem cells in hepatocellular
carcinoma: therapeutic implications based on stem cell biology. Hepatol
Res. 2016;46(1):50–7.
Schwarz-Cruz-y-Celis Á, Meléndez-Zajgla J. Cancer stem cells. Rev Invest
Clínica. 2011;63(2):179–86.
Kim WT, Ryu CJ. Cancer stem cell surface markers on normal stem cells.
BMB Rep. 2017;50(6):285–98.
Lee TK, Cheung VC, Ng IO. Liver tumor-initiating cells as a therapeutic target
for hepatocellular carcinoma. Cancer Lett. 2013;338(1):101–9.
Liu R, Shen Y, Nan KJ, Mi BB, Wu T, Guo JY, et al. Association between
expression of cancer stem cell markers and poor differentiation of
hepatocellular carcinoma. Medicine. 2015;94(31).
Chen Y, Yu D, Zhang H, He H, Zhang C, Zhao W, et al. CD133(+)EpCAM(+)
phenotype possesses more characteristics of tumor initiating cells in
hepatocellular carcinoma Huh7 cells. Int J Biol Sci. 2012;8(7):992–1004.
Tojyo Y, Morita T, Nezu A, Tanimura A. Key components of store-operated
Ca2+ entry in non-excitable cells. J Pharmacol Sci. 2014;125(4):340–6.
Hogan PG, Rao A. Store-operated calcium entry: mechanisms and
modulation. Biochem Biophys Res Commun. 2015;460(1):40–9.
Smyth JT, Hwang SY, Tomita T, DeHaven WI, Mercer JC, Putney JW.
Activation and regulation of store-operated calcium entry. J Cell Mol Med.
2010;14(10):2337–49.
Putney JW. The physiological function of store-operated calcium entry.
Neurochem Res. 2011;36(7):1157–65.
Zhan ZY, Zhong LX, Feng M, Wang JF, Liu DB, Xiong JP. Over-expression of
Orai1 mediates cell proliferation and associates with poor prognosis in human
non-small cell lung carcinoma. Int J Clin Exp Patho. 2015;8(5):5080–8.
Wu ZS, Qing JJ, Xia YX, Wang K, Zhang F. Suppression of stromal interaction
molecule 1 inhibits SMMC7721 hepatocellular carcinoma cell proliferation
by inducing cell cycle arrest. Biotechnol Appl Bioc. 2015;62(1):107–11.
Yang N, Tang Y, Wang F, Zhang H, Xu D, Shen Y, et al. Blockade of storeoperated ca(2+) entry inhibits hepatocarcinoma cell migration and invasion
by regulating focal adhesion turnover. Cancer Lett. 2013;330(2):163–9.
Xie J, Pan H, Yao J, Zhou Y, Han W. SOCE and cancer: recent progress and
new perspectives. Int J Cancer. 2016;138(9):2067–77.
Xia JL, Wang HQ, Huang HX, Sun L, Dong ST, Huang N, et al. Elevated Orai1
and STIM1 expressions upregulate MACC1 expression to promote tumor
cell proliferation, metabolism, migration, and invasion in human gastric
cancer. Cancer Lett. 2016;381(1):31–40.
Motiani RK, Hyzinski-Garcia MC, Zhang X, Henkel MM, Abdullaev IF, Kuo YH,
et al. STIM1 and Orai1 mediate CRAC channel activity and are essential for
human glioblastoma invasion. Pflug Archiv Eur J Phy. 2013;465(9):1249–60.
Chen YF, Chiu WT, Chen YT, Lin PY, Huang HJ, Chou CY, et al. Calcium store
sensor stromal-interaction molecule 1-dependent signaling plays an
important role in cervical cancer growth, migration, and angiogenesis. Proc
Natl Acad Sci USA. 2011;108(37):15225–30.
Venkatachalam K, van Rossum DB, Patterson RL, Ma HT, Gill DL. The cellular
and molecular basis of store-operated calcium entry. Nat Cell Biol. 2002;
4(11):E263–72.
Karacicek et al. BMC Cancer
(2019) 19:751
32. Prevarskaya N, Skryma R, Shuba Y. Ion channels in Cancer: are Cancer
hallmarks Oncochannelopathies? Physiol Rev. 2018;98(2):559–621.
33. Vashisht A, Trebak M, Motiani RK. STIM and Orai proteins as novel targets
for cancer therapy. A review in the theme: cell and molecular processes in
Cancer metastasis. Am J Physiol Cell Physiol. 2015;309:C457–C69.
34. Chen W, Dong J, Haiech J, Kilhoffer MC, Zeniou M. Cancer stem cell
quiescence and plasticity as major challenges in Cancer therapy. Stem Cells
Int. 2016;2016:1740936.
35. Zui P, JianJie MA. Open sesame: treasure in store-operated calcium entry
pathway for cancer therapy. Sci China Life Sci. 2015;58(1):48–53.
36. Xu XL, Xing BC, Han HB, Zhao W, Hu MH, Xu ZL, Li JY, Xie Y, Gu J, Wang Y,
Zhang ZQ. The properties of tumor-initiating cells from a hepatocellular
carcinoma patient's primary and recurrent tumor. Carcinogenesis. 2010;
31(2):167–74.
37. El Boustany C, Bidaux G, Enfissi A, Delcourt P, Prevarskaya N, Capiod T.
Capacitative calcium entry and transient receptor potential canonical 6
expression control human hepatoma cell proliferation. Hepatology. 2008;
47(6):2068–77.
38. Wen L, Liang C, Chen E, Chen W, Liang F, Zhi X, et al. Regulation of multidrug resistance in hepatocellular carcinoma cells is TRPC6/calcium
dependent. Sci Rep. 2016;6:23269.
39. Jardin I, Rosado JA. STIM and calcium channel complexes in cancer.
Biochim Biophys Acta. 2016;1863(6 Pt B):1418–26.
40. Soboloff J, Spassova MA, Tang XD, Hewavitharana T, Xu W, Gill DL. Orai1
and STIM reconstitute store-operated calcium channel function. J Biol
Chem. 2006;281(30):20661–5.
41. Scrimgeour N, Litjens T, Ma L, Barritt GJ, Rychkov GY. Properties of Orai1
mediated store-operated current depend on the expression levels of STIM1
and Orai1 proteins. J Physiol. 2009;587(Pt 12):2903–18.
42. Yen M, Lewis RS. Numbers count: how STIM and Orai stoichiometry affect
store-operated calcium entry. Cell Calcium. 2019;12(79):35–43.
43. Selli C, Erac Y, Tosun M. Simultaneous measurement of cytosolic and
mitochondrial calcium levels: observations in TRPC1-silenced hepatocellular
carcinoma cells. J Pharmacol Toxicol Methods. 2015;72:29–34.
44. Tang BD, Xia X, Lv XF, Yu BX, Yuan JN, Mai XY, et al. Inhibition of Orai1mediated ca(2+) entry enhances chemosensitivity of HepG2
hepatocarcinoma cells to 5-fluorouracil. J Cell Mol Med. 2017;21(5):904–15.
45. Huang Y, Zhou Y, Wong HC, Chen Y, Chen Y, Wang S, et al. A single EFhand isolated from STIM1 forms dimer in the absence and presence of
Ca2+. FEBS J. 2009;276(19):5589–97.
46. Chen YF, Chen YT, Chiu WT, Shen MR. Remodeling of calcium signaling in
tumor progression. J Biomed Sci. 2013;20:23.
47. Soboloff J, Spassova MA, Dziadek MA, Gill DL. Calcium signals mediated by
STIM and Orai proteins--a new paradigm in inter-organelle communication.
Biochim Biophys Acta. 2006;1763(11):1161–8.
48. Xu Y, Zhang S, Niu H, Ye Y, Hu F, Chen S, et al. STIM1 accelerates cell
senescence in a remodeled microenvironment but enhances the epithelialto-mesenchymal transition in prostate cancer. Sci Rep. 2015;5:11754.
49. Takebe N, Miele L, Harris PJ, Jeong W, Bando H, Kahn M, et al. Targeting
notch, hedgehog, and Wnt pathways in cancer stem cells: clinical update.
Nat Rev Clin Oncol. 2015;12(8):445–64.
50. Li L, Bhatia R. Stem cell quiescence. Clin Cancer Res. 2011;17(15):4936–41.
51. Moore N, Lyle S. Quiescent, slow-cycling stem cell populations in cancer: a review
of the evidence and discussion of significance. J Oncol. 2011;2011:396076.
52. Vaidya A. The quintessential quiescence of cancer stem cells: a struggle
towards better treatment. JCMT. 2016;2:242–4.
53. Takeishi S, Nakayama KI. To wake up cancer stem cells, or to let them sleep,
that is the question. Cancer Sci. 2016;107(7):875–81.
54. Wang J, Shen J, Zhao K, Hu J, Dong J, Sun J. STIM1 overexpression in
hypoxia microenvironment contributes to pancreatic carcinoma
progression. Cancer Bio Med. 2019;17(1):100–8.
55. Wang JY, Sun J, Huang MY, Wang YS, Hou MF, Sun Y, et al. STIM1
overexpression promotes colorectal cancer progression, cell motility and
COX-2 expression. Oncogene. 2015;34(33):4358–67.
56. Yang YJZ, Wang B, Chang L, Liu J, Zhang L, Gu L. Expression of STIM1 is
associated with tumor aggressiveness and poor prognosis in breast cancer.
Pathol Res Prac. 2017;9(213):1043–7.
57. Housman G, Byler S, Heerboth S, Lapinska K, Longacre M, Snyder N, et al.
Drug resistance in cancer: an overview. Cancers. 2014;6(3):1769–92.
58. Fletcher JI, Haber M, Henderson MJ, Norris MD. ABC transporters in cancer:
more than just drug efflux pumps. Nat Rev Cancer. 2010;10(2):147–56.
Page 10 of 10
59. Wang B, Yang H, Huang YZ, Yan RH, Liu FJ, Zhang JN. Biologic
characteristics of the side population of human small cell lung cancer cell
line H446. Chin J Cancer. 2010;29(3):254–60.
60. Hu L, McArthur C, Jaffe RB. Ovarian cancer stem-like side-population cells
are tumourigenic and chemoresistant. Br J Cancer. 2010;102(8):1276–83.
61. Adhikari AS, Agarwal N, Wood BM, Porretta C, Ruiz B, Pochampally RR, et al.
CD117 and Stro-1 identify osteosarcoma tumor-initiating cells associated
with metastasis and drug resistance. Cancer Res. 2010;70(11):4602–12.
62. Jin Y, Bin ZQ, Qiang H, Liang C, Hua C, Jun D, et al. ABCG2 is related with
the grade of glioma and resistance to mitoxantone, a chemotherapeutic
drug for glioma. J Cancer Res Clin Oncol. 2009;135(10):1369–76.
Publisher’s Note
Springer Nature remains neutral with regard to jurisdictional claims in
published maps and institutional affiliations.