Activation and function of receptor tyrosine kinases in human clear cell renal cell carcinomas
Bạn đang xem bản rút gọn của tài liệu. Xem và tải ngay bản đầy đủ của tài liệu tại đây (4.57 MB, 13 trang )
Zhang et al. BMC Cancer
(2019) 19:1044
/>
RESEARCH ARTICLE
Open Access
Activation and function of receptor tyrosine
kinases in human clear cell renal cell
carcinomas
Qing Zhang1, Jian-He Liu2, Jing-Li Liu1, Chun-Ting Qi1, Lei Yan1, Yu Chen1 and Qiang Yu1*
Abstract
Background: The receptor tyrosine kinases (RTKs) play critical roles in the development of cancers. Clear cell renal
cell carcinoma (ccRCC) accounts for 75% of the RCC. The previous studies on the RTKs in ccRCCs mainly focused on
their gene expressions. The activation and function of the RTKs in ccRCC have not been fully investigated.
Methods: In the present study, we analyzed the phosphorylation patterns of RTKs in human ccRCC patient
samples, human ccRCC and papillary RCC cell lines, and other kidney tumor samples using human phospho-RTK
arrays. We further established ccRCC patient-derived xenograft models in nude mice and assessed the effects of
RTKIs (RTK Inhibitors) on the growth of these cancer cells. Immunofluorescence staining was used to detect the
localization of keratin, vimentin and PDGFRβ in ccRCCs.
Results: We found that the RTK phosphorylation patterns of the ccRCC samples were all very similar, but different
from that of the cell lines, other kidney tumor samples, as well as the adjacent normal tissues. 9 RTKs, EGFR1–3,
Insulin R, PDGFRβ, VEGFR1, VEGFR2, HGFR and M-CSFR were found to be phosphorylated in the ccRCC samples. The
adjacent normal tissues, on the other hand, had predominantly only two of the 4 EGFR family members, EGFR and
ErbB4, phosphorylated. What’s more, the RTK phosphorylation pattern of the xenograft, however, was different from
that of the primary tissue samples. Treatment of the xenograft nude mice with corresponding RTK inhibitors
effectively inhibited the Erk1/2 signaling pathway as well as the growth of the tumors. In addition, histological
staining of the cancer samples revealed that most of the PDGFRβ expressing cells were localized in the vimentinpositive periepithelial stroma.
Conclusions: Overall, we have identified a set of RTKs that are characteristically phosphorylated in ccRCCs. The
phosphorylation of RTKs in ccRCCs were determined by the growing environments. These phosphorylated/
activated RTKs will guide targeting drugs development of more effective therapies in ccRCCs. The synergistical
inhibition of RTKIs combination on the ccRCC suggest a novel strategy to use a combination of RTKIs to treat
ccRCCs.
Keywords: Receptor tyrosine kinases (RTKs), Activation and function, Clear cell renal cell carcinomas (ccRCCs),
Targeted therapy, PDGFRβ, Stroma cells
* Correspondence:
1
Shanghai Institute of Materia Medica, Chinese Academy of Sciences, 555
Zuchongzhi Road, Room 2-224, Shanghai 201203, China
Full list of author information is available at the end of the article
© The Author(s). 2019 Open Access This article is distributed under the terms of the Creative Commons Attribution 4.0
International License ( which permits unrestricted use, distribution, and
reproduction in any medium, provided you give appropriate credit to the original author(s) and the source, provide a link to
the Creative Commons license, and indicate if changes were made. The Creative Commons Public Domain Dedication waiver
( applies to the data made available in this article, unless otherwise stated.
Zhang et al. BMC Cancer
(2019) 19:1044
Background
Kidney cancers are common in developed countries and are
notoriously difficult to be treated. Ninety percent of kidney
cancers are renal cell carcinomas (RCCs) which originate
from tubular structures of the kidney. They are subdivided
into clear cell carcinoma (ccRCC), papillary carcinoma, chromophobe, and oncocytoma. The remaining 10% are transitional cell carcinomas, which are derived from cells lining
the renal pelvis and ureter [1, 2]. Standard treatments for
RCCs are surgery (partial or total nephrectomy) for localized
kidney cancer, targeted therapies and immunotherapies for
metastasized cancer. Seventy-five percent of the RCCs are
ccRCCs which are poorly sensitive to traditional chemotherapy. Targeted therapies are also limited by the lack of knowledge of genetic mutations in the ccRCC cells.
The receptor tyrosine kinases (RTKs) are a large family of
transmembrane receptors with 58 members in human [3].
The ligand-induced dimerization of the RTKs lead to phosphorylation/activation of the receptors as well as the downstream signaling molecules [4, 5]. RTKs play critical roles in
the development of many diseases, especially cancer. Dysregulations of the RTK signaling through point mutation,
gene amplification, overexpression, chromosomal alterations, and/or constitutive activation are key factors in
oncogenesis [4, 6–11]. However, the activation and function
of the RTKs in ccRCC have not been fully investigated.
Previous studies in ccRCCs have mainly focused on
RTKs gene expressions [12, 13]. No genetic mutations of
RTKs have been reported in the ccRCCs. The only molecular mechanism related to RTKs in ccRCCs is dysregulation of the pVHL/HIF axis [14, 15], which drives
expression of VEGF and PDGFβ and, hence, activation
of their receptors VEGFR2 and PDGFRβ [16–20]. Therefore, current treatments for ccRCCs are mostly antiangiogenic tyrosine-kinase inhibitors (TKIs) targeting
VEGFR, which include pazopanib, sunitinib, axitinib, sorafenib, and bevacizumab [21, 22].
In the present study, we analyzed the phosphorylation/activation/ patterns of RTKs in 10 ccRCC patient samples, 4
RCC cell lines, and 4 other kidney tumor samples. Our data
revealed that multiple RTKs were activated in the ccRCCs
and the phosphorylation patterns of the RTKs in the ccRCC
patients were similar to each other but different from adjacent normal tissues and the other kidney tumors. Treatments with a combination of RTK inhibitors based on their
phosphorylation patterns in the ccRCC-derived xenografts
effectively inhibited the cancer cell growth. These data suggest an effective therapeutic strategy to treat ccRCC patients.
Page 2 of 13
University School of Medicine, China. The 10 ccRCC
patients were five males and five females (Table 1). The
mean age at diagnosis was 65 ± 9. The patient information of 3 other kidney cancer samples and 1 benign renal
tumor sample are in Table 2. After surgical resection,
tissue samples were lysed in lysis buffer (R&D Sytems,
AYR001B) for protein lysates on the ice or fixed in neutral buffered formalin (10%) for histology staining, or immediately processed to establish ccRCC patient-derived
xenograft models in nude mice.
Cell lines
786–0(CRL-1932), A-498(HTB-44), ACHN(CRL-1611), and
Caki-1(HTB-46) cell lines were obtained from ATCC. 786–0
and Caki-1 cell lines were derived from human primary
ccRCC. A-498 and ACHN cell lines were derived from human primary papillary RCCs. 786–0 and ACHN cells were
cultured in RPMI 1640 Medium (Gibco) with 10% FBS
(Gibco). A498 cells were cultured in Dulbecco’s Modification
of Eagle’s Medium (Gibco) with 10% FBS. Caki-1 cells were
cultured in McCoy’s 5A Medium (Sigma) with 10% FBS.
HE staining
Fixed tissues were dehydrated using grades of ethanol
(70, 80, 90, 95, and 100%). Dehydration was followed by
clearing the samples in two changes of xylene. The samples were then impregnated with two changes of molten
paraffin wax, embedded, and blocked out. The tissue
sections (7 μm) were stained with hematoxylin-eosin by
standard procedures. Stained sections were observed and
photographs were taken using a Leica microscope.
RTK phosphorylation/activation profiling
Human phospho-RTK arrays (R&D Systems,
AYR001B) were used according to the manufacturer’s instructions. Briefly, a total of 5 mg protein
lysates of in vitro cultured cells, or 10 mg protein
lysates of clinical samples and mouse xenografts
were diluted in the kit-specific dilution buffer and
Table 1 Patient information of renal cell carcinoma (RCC)
No.
Age
Histopathology
Stage
RE0370
72
Clear cell RCC
II
RE0380
56
Clear cell RCC
I~II
RE0390
73
Clear cell RCC
II
RE0400
77
Clear cell RCC
II
RE0410
67
Clear cell RCC
II~III
RE0440
66
Clear cell RCC
II
Methods
RE0450
53
Clear cell RCC
I
Collection of primary kidney tumors
RE0480
54
Clear cell RCC
II
RE0490
56
Clear cell RCC
II
RE0510
77
Clear cell RCC
II
The renal tissue specimens were collected in compliance
with local ethics regulations at the Department of Urology, Xin Hua Hospital Affiliated to Shanghai Jiao Tong
Zhang et al. BMC Cancer
(2019) 19:1044
Page 3 of 13
Table 2 Patient information of the other kidney cancers and a
benign renal tumor
No.
Age
Histopathology
RE0020
59
Papillary RCC
RE0150
55
Oncocytoma
RE0210
52
Renal pelvic carcinoma
RE0500
52
Cystic nephroma
incubated with blocked membranes overnight. The
membranes were washed and incubated with antiphospho-tyrosine-HRP antibody for 2 h. The membranes were washed and exposed to chemiluminescent reagent. The arrays were photographed using
Image Station 4000MM PRO system (Carestream). The
pixel densities of various spots were collected and quantified with its software. The average signal (pixel density) of
the pair of duplicate spots was determined for each RTK.
A signal from the PBS negative control spots was used as
a background value. And signals of reference spots in the
corners were used for normalization among different arrays. Phospho-RTK relative value was calculated according
to the following formula: Phospho-RTKx relative value = (
INTx-INTnc)/(INTref-INTnc). INTx is the pixel density
of RTKx, INTnc is the pixel density of background,and
INTref is the density of reference spots.
Western blotting
Proteins were separated by SDS-PAGE and transferred to a
nitrocellulose membrane. The membrane was blocked in TBS
containing 0.1% Tween 20 (TBST) and 5% nonfat milk for 1 h
at room temperature and then incubated overnight in TBST
containing 5% bovine serum albumin and primary antibodies.
Membranes were then washed with TBST and incubated with
horseradish peroxidase-conjugated secondary antibody for 1 h,
and immune complexes were detected by immobilon Western
chemiluminescent HRP substrate (WBKLS0500, Millipore).
Primary antibodies are anti-phospho-EGFR (#3777), antiEGFR (#4267), anti-phospho-PDGFRβ (#3161), anti-PDGFRβ
(#3169), anti-phospho-InsulinRβ (#3024), anti-InsulinRβ
(#3025), anti-phospho-VEGFR2 (#2474), anti-VEGFR2
(#9698), anti-phospho-Met (#3077), anti-Met (#3148), antiphospho-Akt (#4060), anti-phospho-Erk1/2 (#4370). All antibodies were purchased from Cell Signaling Technology. The
membranes were photographed using Azure Biosystems
(c300) and were quantified using its software (Analysis Toolbox). The density ratio of interest proteins to GAPDH or βActin were calculated.
Xenograft models and treatment
The female BALB/c nude (nu/nu) mice were purchased
from Beijing Vital River Laboratory Animal Technology Co.,
Ltd. and used for implantation at the age of 6–8 weeks. They
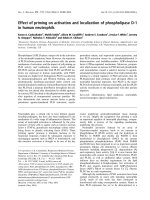
Fig. 1 A gross presentation and HE staining of a representative ccRCC total nephrectomy sample and its adjacent tissue. a. A typical gross
presentation of ccRCC with a bright yellow color. b. The adjacent normal tissue. c. HE staining of a section of the ccRCC with transparent empty
cytoplasm and well-defined cell borders. d. HE staining of a section of the adjacent tissue with normal glomerulus, proximal convoluted tubules,
and distal convoluted tubules. Scale bars represent 100 μm
Zhang et al. BMC Cancer
(2019) 19:1044
Page 4 of 13
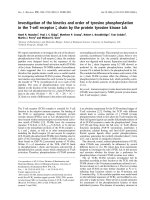
Fig. 2 Patterns of phospho-RTK in 10 pairs of human ccRCCs and adjacent tissues. Each RTK was in duplicate. Positive control spots are located
on the top left, top right, and bottom left of each array. (1. EGFR; 2. ErbB2; 3. ErbB3; 4. Insulin R; 5. HGFR (Met); 6. PDGFRβ; 7. M-CSFR; 8. VEGFR1; 9.
VEGFR2; 10. ErbB4)
were maintained under specific pathogen-free conditions,
and food and water were supplied ad libitum. Housing and
all procedures were performed according to protocols approved by the Ethics Committee of Shanghai institute of
materia medica. Subcutaneous xenografts were established
by injection of 5× 10⁶ cells or one piece (2mm3) tumor per
mouse to right flank. Tumor formation was monitored each
week. Each subcutaneous tumor was measured using a caliper, and tumor volumes were calculated as follows: 0.5×
length× width2. Nude mice with ccRCC patient-derived xenografts of approximately 100 mm3 were allocated randomly
into 4 experimental groups and orally treated with 3 mg/kg/
d Crizotinib (n = 6), 30 mg/kg/d Lapatinib (n = 6), combination of Crizotinib and Lapatinib(n = 6), or vehicle (n = 6) for
21 days. Mice were euthanized in a CO2 chamber for 2 h
after the last treatment. Crizotinib and Lapatinib were purchased from Selleck Chemicals.
Immunofluorescence staining
Cryosections were blocked in PBS containing 5% normal
donkey serum for 2 h at room temperature. Sections
were incubated over night at 4 °C with the primary antibodies against PDGFRβ (ab32570, rabbit Anti-PDGF Receptor beta antibody, 1:50, Abcam), Pan-Keratin (#4545,
mouse anti-pan-keratin antibody,1:50, CST), Vimentin
(sc-7557, goat anti-vimentin antibody, 1:50, Santa Cruz).
After washed with PBS three times, the sections were incubated for 1 h at room temperature with Alexa Fluor
594-labeled donkey anti-rabbit IgG (A21207,1:400, Invitrogen), Alexa Fluor 488-labeled donkey anti-mouse IgG
Zhang et al. BMC Cancer
(2019) 19:1044
Page 5 of 13
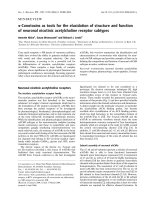
Fig. 3 The relative levels of the phospho-RTKs in human ccRCCs and adjacent tissues. The phospho-RTK levels were measured using the human
phospho-RTK array kit. P < 0.05 (*), P < 0.01 (**), and P < 0.001(***) vs. adjacent tissues of clear cell RCC. Data were represented as mean ± SEM
(A21202,1:400, Invitrogen) and Alexa Fluor 555-labeled
rabbit anti-goat IgG (A21431,1:400, Invitrogen). Sections
were washed three times in PBS, followed by mounting
tissue with Dako fluorescence mounting medium. Photographs were taken using a Leica DMi8.
Statistical analysis
Data were represented as mean ± SEM. T test was used
in human phospho-RTK studies. Two-way ANOVA with
Tukey post hoc test was used in mouse xenograft treatment studies. Statistical significance was established for
P < 0.05, P < 0.01, and P < 0.001.
Results
Pathological examination of the ccRCCs and their
adjacent tissues
To examine the histopathology of the kidney tumors, HE staining was performed. Gross examination of the resected tumor samples revealed that
the ccRCCs were all bright yellow in color, due to
their intracellular lipid accumulation (Fig. 1a). In
contrast, the adjacent normal tissues of the ccRCCs
showed normal flesh color (Fig. 1b). In HE staining
sections, the ccRCC cells showed transparent and
empty (water clear) cytoplasm with well-defined cell
Zhang et al. BMC Cancer
(2019) 19:1044
Page 6 of 13
Fig. 4 Western blotting analyses of the tissue lysates of the human ccRCCs (Ca) and adjacent tissues (Ad). Tissues were lysed and protein was
analyzed by Western blotting using antibodies as indicated. GAPDH and β-Actin antibodies were used as loading controls
borders (Fig. 1c). The nuclei of ccRCCs were round.
Architecturally, the ccRCCs displayed compactalveolar or acinar growth patterns. The small nests
were surrounded by a well-developed network of
thin-walled vessels. An abundance of extravasated
red blood cells were observed in the tumors. The
glomerulus, proximal convoluted tubules, and distal
convoluted tubules in the cortex of the kidney could
be seen in adjacent tissues (Fig. 1d).
The phosphorylation patterns of the RTKs in the ccRCC
patient-derived tumors were similar
To understand the expression and phosphorylation of the
RTKs in the ccRCCs, we analyzed 10 pairs of primary ccRCCs
and their adjacent non-tumor kidney tissues using human
phospho-RTK arrays which evaluate the relative phosphorylation levels of 49 receptor tyrosine kinases (Additional file 1:
Fig. S1). 9 RTKs (EGFR1–3, Insulin R, PDGFRβ, VEGFR1,
VEGFR2, HGFR, and M-CSFR) were found to be phosphorylated in the ccRCC samples (Fig. 2 and Fig. 3). Comparing to
their adjacent normal tissues, Insulin R, HGFR, PDGFRβ, MCSFR, VEGFR1, and VEGFR2 were specific to the ccRCCs.
Among them, the phosphorylation levels of Insulin R,
PDGFRβ, VEGFR1, and VEGFR2 were significantly increased
in all the ccRCC samples. The phosphorylation levels of
HGFR (spot #5) and M-CSFR (spot #7) varied among the
samples. HGFR was highly phosphorylated in RE0370 and
RE0410 samples while M-CSFR was highly phosphorylated in
Zhang et al. BMC Cancer
(2019) 19:1044
Page 7 of 13
Fig. 5 Patterns of the phospho-RTKs in the human ccRCC (a) and papillary RCC (b) cell lines. EGFR (1) and HGFR (2) were all activated in the four
RCC cell lines
RE0370, RE0440, and RE0450 samples. This RTKs activation
patterns of ccRCCs were different from that of their paired adjacent tissues in which only the EGFR family members, particularly EGFR and ErbB4, were significantly phosphorylated.
These findings were further verified by Western blotting analyses. The phosphorylation levels of Insulin Rβ (Tyr1150/
1151), PDGFRβ (Tyr751), VEGFR2 (Tyr996), and HGFR (Met
Tyr1234/1235) were found to be increased in the tumor tissues in comparison to the paired adjacent tissues (Fig. 4). In
addition, the protein levels of some of the RTKs (Insulin Rβ,
PDGFRβ, VEGFR2, or Met) were also increased in certain tumors. The protein expression patterns of PDGFRβ and
VEGFR2 in tumors were also different from their adjacent tissues (Fig. 4a, d).
The RTK phosphorylation patterns of ccRCC patient-derived
tumors were different from that of human ccRCC cell lines,
papillary RCC cell lines, and other kidney tumor samples
To determine whether the RTK phosphorylation patterns in the ccRCCs are specific, we evaluated the
RTK phosphorylation patterns in 2 ccRCC cell lines,
2 papillary RCC cell lines and 4 other types of kidney
tumor samples. The RTK phosphorylation patterns of
the four human RCC cell lines were similar with each
other (Fig. 5). The EGFR family and HGFR were
highly phosphorylated in all the four cell lines. In
contrast, the RTK phosphorylation patterns of the
four other types of tumor samples, namely a papillary
RCC (RE0020), an oncocytoma (RE0150), a renal pelvic carcinoma (RE0210), and a cystic nephroma
(RE0500), were different from each other and were
also different from that of the ccRCCs, except EGFR,
which was highly phosphorylated in all samples
(Fig.6). ErbB4, Insulin R, and IGF-1R were phosphorylated in the papillary RCC (RE0020), Mer (Axl family)
was phosphorylated in the oncocytoma (RE0150), and
HGFR, PDGFRα, and PDGFRβ were phosphorylated
in the renal pelvic carcinoma (RE0210, Fig.6). In the
benign renal tumor, namely the cystic nephroma sample (RE0500), only EGFR was phosphorylated (Fig.6).
These data demonstrated that the RTK phosphorylation patterns of the ccRCCs were specific.
The RTK phosphorylation pattern of the ccRCC sample in
the xenograft was different from that of the primary
samples
In order to treat the tumors with tyrosine kinase inhibitors based on their RTK phosphorylation patterns, we
Zhang et al. BMC Cancer
(2019) 19:1044
Page 8 of 13
Fig. 6 Patterns of phospho-RTKs in the other kidney cancer samples and the benign renal tumor. The relative levels of the phospho-RTKs were
calculated and presented under each array blot
tried to establish tumor xenograft models using the
patient-derived tumor samples as well as the cancer cell
lines. Thirty-five tissue pieces from the 10 samples of
the ccRCCs were subcutaneously implanted into 35
nude mice. Only one xenograft (RE0410) grew successfully. We then analyzed the RTK phosphorylation pattern of this ccRCC explant. The RTK phosphorylation
pattern of the xenograft was different from its original
primary sample (RE0410). Only the phosphorylation of
EGFR family (EGFR, ErbB2 and ErbB3) and HGFR were
maintained at high levels while that of the other RTKs
decreased (Fig.7a). In contrast to the poor tumorigenicity of the ccRCC samples from patients, the established cell lines of ccRCC and papillary RCC were
highly tumorigenic. Both EGFR and HGFR remained
phosphorylated in all four of the cell line-derived
xenograft samples, although their phosphorylation
levels decreased in vivo (Fig.7b, c). These data
demonstrated that the RTK phosphorylation patterns
in the xenografts changed and the success rate of
subcutaneous grafting of ccRCC samples was low in
nude mice.
Combination of TKIs synergistically inhibited the growth
of ccRCCs in vivo
Phospho-RTK array of the ccRCC explants from the
xenograft mice showed that three of the EGFR family
members and the HGFR were highly phosphorylated in
the xenograft tumors. We therefore used the RTK inhibitors
targeting EGFR family and HGFR to treat the ccRCC xenograft nude mice. As shown in Fig. 8a, the change of body
weight in treatment groups was similar with that in vehicle
group. The EGFR inhibitor lapatinib or the HGFR inhibitor
crizotinib alone slightly inhibited the tumor growth (Fig.8b).
In comparison, the combination of the two inhibitors was
much more efficient than the single treatment to inhibit the
Zhang et al. BMC Cancer
(2019) 19:1044
Page 9 of 13
Fig. 7 Patterns and quantitation of the phospho-RTKs in the xenograft mice of 1 patient-derived ccRCC sample (RE0410, a), 2 human ccRCC (b)
and 2 papillary RCC (c) cell lines
tumor growth (Fig. 8b). The average inhibition rate of crizotinib, lapatinib, or a combination of them on the ccRCC
were 38.24 ± 22.40%, 35.43 ± 37.15%, and 62.79 ± 21.95% respectively (Fig. 8c, d).
To understand the effects of the combination treatment at
the molecular level, we examined the effects of crizotinib, lapatinib, or the combination of them on the phosphorylation/activation of their target proteins and their downstream
signaling molecules Erk1/2 and Akt. As shown in Fig. 8e and
f, the combination treatment synergistically inhibited the
phosphorylation of Met, EGFR, and Erk1/2. These data suggested that a combination treatment of the RTK inhibitors
based on the RTK phosphorylation patterns synergistically
inhibited the RTK-mediated signaling and the tumor growth.
PDGFRβ was expressed in the periepithelial stroma cells
PDGFRs are usually expressed in stroma cells. To understand the function of the PDGFRβ in the ccRCCs, we
analyzed the expression of PDGFRβ in the patientderived ccRCCs and their adjacent tissues. The PDGFRβ
was mainly expressed in glomerulus in the tumor adjacent tissues (Fig. 9a). In the ccRCC tumor tissues,
PDGFRβ was present in the vimentin-positive stroma
cells surrounding the tumor islands and blood vessels
(Fig. 9b, c). But the keratin-positive epithelial cells were
mainly localized in the tumor islands which were
PDGFRβ-negative (Fig. 9b, c). These results suggest that
the PDGFRβ expressing cells were periepithelial stroma
cells in the ccRCCs.
Zhang et al. BMC Cancer
(2019) 19:1044
Page 10 of 13
Fig. 8 Combination of TKIs synergistically inhibited human ccRCC growth in vivo. a and b. The body weights and tumor volumes during the
drug treatment. The ccRCC xenograft nude mice were treated with vehicle, crizotinib (Cri), lapatinib (Lap), or combination of them for 21 days.
Tumors were excised and photographed at the end of treatments. c. The tumor weights at the end of treatment. D. Tumors from ccRCC
xenograft nude mice. e. Western blotting analyses of P-Met, P-EGFR, P-Erk1/2 and P-Akt levels of the tumors. The numbers underneath the groups
represent the serial number of mice. Tumor lysates were processed for Western blot analyses and probed with the indicated antibodies. f. The
ratios of protein phosphorylation levels relative to GAPDH. P < 0.05 (*), P < 0.01 (**), and P < 0.001(***) vs. vehicle group. Drug combination group
was compared with the crizotinib group or lapatinib group (P < 0.05, #). Data were represented as mean ± SEM
Discussion
We identified 9 RTKs that were significantly phosphorylated in the primary ccRCC samples and 6 of which, Insulin R, HGFR, PDGFRβ, M-CSFR, VEGFR1, and VEGFR2,
were specific to the ccRCCs samples comparing to their
adjacent normal tissues. More importantly, the phosphorylation patterns of the RTKs in the ccRCC patient samples
were similar among each other. It is therefore possible
that the activation of the 6 ccRCCs-specific RTKs are important for the formation and growth of the ccRCCs. Our
data are consistent with previous studies on the expressions and roles of RTKs in ccRCCs. There were several reports demonstrated VEGF/VEGFR activation and HGFR
upregulation in patients with ccRCCs [12, 17–20, 23, 24].
The M-CSFR activation we observed in the ccRCC samples may be due to increases and activations of the tumorassociated macrophages in ccRCCs [25–27]. The role of
Insulin R in ccRCCs is unclear [28]. There was a report
showing that the expressions of Insulin R were similar in
ccRCCs and their adjacent normal tissues, but the
Zhang et al. BMC Cancer
(2019) 19:1044
Page 11 of 13
Fig. 9 Immunostaining for PDGFRβ (red), Vimentin (red) and Keratin (green) in a pair of human ccRCC tissues. Cell nucleus was stained blue by DAPI.
a. Human ccRCC adjacent tissue (scale bars = 50 μm). b. Human ccRCC tissue (scale bars = 50 μm). c. Human ccRCC tissue (scale bars = 25 μm). Arrows
indicate PDGFRβ positive cells surrounding the tumor islands (*) in the ccRCC tissue. # indicates glomerulus and + indicates blood vessel
phosphorylation of the Insulin R was not analyzed in this
report [29]. Our data demonstrated that the Insulin R was
significantly phosphorylated in the ccRCC samples, but
not in the adjacent normal tissues, suggesting that Insulin
R may have a role in promoting ccRCC cell growth. However, it was also reported that Insulin R expression correlated
with a lower Fuhrman nuclear grade and better patient prognosis [29]. Further studies are needed to clarify the roles of
Insulin R in ccRCCs. None the less, these data suggest that
the 6 specifically activated RTKs in the ccRCCs may be important targets for the treatment of ccRCCs.
Among the 6 specifically activated RTKs, HGFR and
Insulin R were reported to be mainly expressed in the
ccRCC epithelial cells [23, 24, 29]. The M-CSF R seems
to be expressed in the tumor-associated macrophages
[25–27] while the VEGFRs were likely expressed in the
blood vessel endothelial cells. The PDGFRβ was found
to be mainly expressed within the periepithelial stroma
in the ccRCC samples in our study. Similar expression
patterns of PDGFRβ were found in breast, prostate, pancreatic, gastric, and oral squamous cell carcinoma cancer
cells [30–32]. More importantly, high PDGFRβ expression in fibroblast-rich stroma is commonly associated
with poor prognosis [33, 34]. These data suggest that the
RTKs in the ccRCC stroma cells may also be abnormally
activated to support the growth of the cancer cells. Thus,
targeting the activated RTKs in both the cancer epithelial cells and the surrounding stroma cells that associated with poor prognosis may be a primary choice for
treating the ccRCC patients.
It is unclear what caused the activation of the RTKs in
the ccRCCs. The behavior of the ccRCCs in the xenograft mice, however, indicated that majority of the 9
RTKs might be activated by their corresponding growth
factors in the tumor environments. When the cancer
cells were implanted into a new environment in the
xenograft mice, most of the cancer cells failed to grow,
likely because of lack of necessary growth factors to activate the RTKs. The only ccRCC sample that did grow in
the xenograft mouse had different RTK phosphorylation
patterns from that of the original sample. In addition,
the four cancer cell lines, when implanted into the xenograft mice, also showed similar RTK phosphorylation
patterns as the primary cancer sample, but different
from that of the in vitro growing cells. All these data
suggest that the RTK phosphorylation patterns of the
cancer cells are not cell autonomous, but rather are determined by their growing environments.
Although we could not reproduce the same RTK
phosphorylation patterns of the ccRCC primary cancer
Zhang et al. BMC Cancer
(2019) 19:1044
samples in the xenograft models, the treatment of the
tumor cells in the xenograft mice with a combination of
the RTKIs, based on the RTK phosphorylation patterns,
successfully inhibited the tumor cell growth, suggesting
that the RTK phosphorylation pattern-guided treatment
of cancers is an effective therapeutic strategy.
Conclusions
In summary, we have identified a set of RTKs that are characteristically phosphorylated in ccRCCs. The phosphorylation of the RTKs and the growth of the ccRCCs were
determined by the growing environments of the ccRCCs.
Treatment of the ccRCC xenograft mouse with a combination of RTKIs based on the RTK phosphorylation pattern
of the ccRCC in the new environment synergistically inhibited the growth of the ccRCC. These data suggest a novel
strategy to use a combination of RTKIs to treat ccRCCs.
Additional file
Additional file 1: Figure S1. Schematic illustration of the RTK array
from the R&D Systems. (TIF 2291 kb)
Abbreviations
ccRCCs: Clear cell renal cell carcinomas; EGFR: Epidermal growth factor
receptor; HGFR: Hepatocyte growth factor receptor; IGF-1R: Insulin-like
growth factor 1 receptor; M-CSFR: Macrophage colony-stimulating factor receptor; PDGFR: Platelet-derived growth factor receptor; RTKIs: Receptor
tyrosine kinase inhibitors; RTKs: Receptor tyrosine kinases; VEGFR: Vascular
endothelial growth factor receptor
Acknowledgements
Not applicable.
Authors’ contributions
QZ and QY contributed to conception and design of all the experiments, analyses
and interpretations of the data, writing and revision of the manuscript; J-HL provided
all samples and clinical data of the patients; J-LL and QZ performed the PhosphoRTK analyses; C-TQ, LY, YC and QZ performed animal experiments, HE staining, and
Western Blotting; QZ performed the immunofluorescence experiments. All authors
have read and approved the manuscript.
Funding
This work was supported in part by the China National Key Research and
Development Program (2018YFC1705505) and the National Natural Science
Foundation of China (no.81673465) in the design of the study and the
analysis of data.
Availability of data and materials
The datasets used and/or analyzed during the current study are available
from the corresponding author on reasonable request.
Ethics approval and consent to participate
The clinical samples were obtained from patients undergoing surgical
resection at the Department of Urology, Xin Hua Hospital Affiliated to
Shanghai Jiao Tong University School of Medicine, China. All the
experiments were approved by the Ethics Committee of Xin Hua Hospital
Affiliated to Shanghai Jiao Tong University School of Medicine, China.
Written informed consents were obtained from the patients. Samples were
confirmed to be tumor or normal based on pathological assessment.
All the protocols of the animal experiments were approved by the Ethics
Committee of Shanghai Institute of Materia Medica, and the research
complied with the Guide for the Care and Use of Laboratory Animals.
Page 12 of 13
Consent for publication
Not applicable.
Competing interests
The authors declare that they have no competing interests.
Author details
1
Shanghai Institute of Materia Medica, Chinese Academy of Sciences, 555
Zuchongzhi Road, Room 2-224, Shanghai 201203, China. 2The Department of
Urology, Xin Hua Hospital Affiliated to Shanghai Jiao Tong University School
of Medicine, 1665 Kongjiang Road, Shanghai, China.
Received: 14 January 2019 Accepted: 13 September 2019
References
1. Cohen HT, McGovern FJ. Renal-cell carcinoma. N Engl J Med. 2005;353(23):
2477–90.
2. Shaw G. The silent disease. Nature. 2016;537(7620):S98–9.
3. Robinson DR, Wu YM, Lin SF. The protein tyrosine kinase family of the
human genome. Oncogene. 2000;19(49):5548–57.
4. Lemmon MA, Schlessinger J. Cell signaling by receptor tyrosine kinases. Cell.
2010;141(7):1117–34.
5. Maruyama IN. Mechanisms of activation of receptor tyrosine kinases:
monomers or dimers. Cells. 2014;3(2):304–30.
6. Haglund K, Rusten TE, Stenmark H. Aberrant receptor signaling and
trafficking as mechanisms in oncogenesis. Crit Rev Oncog. 2007;13(1):39–74.
7. Gross S, Rahal R, Stransky N, Lengauer C, Hoeflich KP. Targeting cancer with
kinase inhibitors. J Clin Invest. 2015;125(5):1780–9.
8. Motallebnezhad M, Aghebati-Maleki L, Jadidi-Niaragh F, Nickho H, SamadiKafil H, Shamsasenjan K, Yousefi M. The insulin-like growth factor-I receptor
(IGF-IR) in breast cancer: biology and treatment strategies. Tumour Biol.
2016;37(9):11711–21.
9. Zhang XY, Zhang PY. Receptor tyrosine kinases in carcinogenesis. Oncol
Lett. 2016;12(5):3679–82.
10. Salgia R. MET in lung cancer: biomarker selection based on scientific
rationale. Mol Cancer Ther. 2017;16(4):555–65.
11. Bradley CA, Salto-Tellez M, Laurent-Puig P, Bardelli A, Rolfo C, Tabernero J,
Khawaja HA, Lawler M, Johnston PG, Van Schaeybroeck S. Targeting c-MET
in gastrointestinal tumours: rationale, opportunities and challenges. Nat Rev
Clin Oncol. 2017.
12. Behbahani TE, Thierse C, Baumann C, Holl D, Bastian PJ, von Ruecker A,
Müller SC, Ellinger J, Hauser S. Tyrosine kinase expressiong profile in clear
cell renal cell carcinoma. World J Urol. 2012;30(4):559–65.
13. Thomasson M, Hedman H, Ljungberg B, Henriksson R. Gene expression
pattern of the epidermal growth factor receptor family and LRIG1 in renal
cell carcinoma. BMC Res Notes. 2012;5:216.
14. Cancer Genome Atlas Research Network. Comprehensive molecular
characterization of clear cell renal cell carcinoma. Nature. 2013;499(7456):43–9.
15. Von Roemeling CA, Marlow LA, Radisky DC. Functional genomics identifies
novel genes essential for clear cell renal cell carcinoma tumor cell
proliferation and migration. Oncotarget. 2014;5(14):5320–34.
16. Sourbier C, Srivastava G, Ghosh MC, Ghosh S, Yang Y, Gupta G, Degraff W,
Krishna MC, Mitchell JB, Rouault TA, Linehan WM. Targeting HIF2α
translation with Tempol in VHL-deficient clear cell renal cell carcinoma.
Oncotarget. 2012;3(11):1472–82.
17. Shen C, Kaelin WG Jr. The VHL/HIF axis in clear cell renal carcinoma. Semin
Cancer Biol. 2013;23(1):18–25.
18. Smaldone MC, Maranchie JK. Clinical implications of hypoxia inducible
factor in renal cell carcinoma. Urol Oncol. 2009;27(3):238–45.
19. Baldewijns MM, van Vlodrop IJ, Vermeulen PB, Soetekouw PM, van Engeland
M, de Bruïne AP. VHL and HIF signalling in renal cell carcinogenesis. J
Pathol. 2010;221(2):125–38.
20. Raval RR, Lau KW, Tran MG, Sowter HM, Mandriota SJ, Li JL, Pugh CW,
Maxwell PH, Harris AL, Ratcliffe PJ. Contrasting properties of hypoxiainducible factor 1(HIF-1) and HIF-2 in von Hippel-Lindau-associated renal
cell carcinoma. Mol Cell Biol. 2005;25(13):5675–86.
21. Porta C, Giglione P, Paglino C. Targeted therapy for renal cell carcinoma:
focus on 2nd and 3rd line. Expert Opin Pharmacother. 2016;17(5):643–55.
22. Zhi WI, Kim JJ. An update on current management of advanced renal cell
cancer, biomarkers, and future directions. Ann Cancer Res. 2014;1(2):1–10.
Zhang et al. BMC Cancer
(2019) 19:1044
23. Macher-Goeppinger S, Keith M, Endris V, Penzel R, Tagscherer KE, Pahernik S,
Hohenfellner M, Gardner H, Grullich C, Schirmacher P, Roth W. Met expression
and copy number status in clear-cell renal cell carcinoma: prognostic value
and potential predictive marker. Oncotarget. 2017;8(1):1046–57.
24. Gibney GT, Aziz SA, Camp RL, Conrad P, Schwartz BE, Chen CR, Kelly WK,
Kluger HM. c-Met is a prognostic marker and potential therapeutic target in
clear cell renal cell carcinoma. Ann Oncol. 2013;24(2):343–9.
25. Bonelli S, Geeraerts X, Bolli E, Keirsse J, Kiss M, Pombo Antunes AR, Van
Damme H, De Vlaminck K, Movahedi K, Laoui D, Raes G, Van Ginderachter
JA. Beyond the M-CSF receptor - novel therapeutic targets in tumorassociated macrophages. FEBS J. 2018;285(4):777–87.
26. Komohara Y, Hasita H, Ohnishi K, Fujiwara Y, Suzu S, Eto M, Takeya M.
Macrophage infiltration and its prognostic relevance in clear cell renal cell
carcinoma. Cancer Sci. 2011;102(7):1424–31.
27. Van Overmeire E, Stijlemans B, Heymann F, Keirsse J, Morias Y, Elkrim Y, Brys
L, Abels C, Lahmar Q, Ergen C, Vereecke L, Tacke F, De Baetselier P, Van
Ginderachter JA, Laoui D. M-CSF and GM-CSF receptor signaling
differentially regulate monocyte maturation and macrophage polarization in
the tumor microenvironment. Cancer Res. 2016;76(1):35–42.
28. Solarek W, Czarnecka AM, Escudier B, Bielecka ZF, Lian F, Szczylik C. Insulin
and IGFs in renal cancer risk and progression. Endocr Relat Cancer. 2015;
22(5):R253–64.
29. Lkhagvadorj S, Oh SS, Lee MR, Jung JH, Chung HC, Cha SK, Eom M. Insulin
receptor expression in clear cell renal cell carcinoma and its relation to
prognosis. Yonsei Med J. 2014;55(4):861–70.
30. Paulsson J, Ehnman M, Östman A. PDGF receptors in tumor biology:
prognostic and predictive potential. Future Oncol. 2014;10(9):1695–708.
31. Paulsson J, Sjöblom T, Micke P, Pontén F, Landberg G, Heldin CH, Bergh J,
Brennan DJ, Jirström K, Ostman A. Prognostic significance of stromal
platelet-derived growth factor beta-receptor expressionin human breast
cancer. Am J Pathol. 2009;175(1):334–41.
32. Kartha VK, Stawski L, Han R, Haines P, Gallagher G, Noonan V, Kukuruzinska
M, Monti S, Trojanowska M. PDGFRβ is a novel marker of stromal activation
in oral squamous cell carcinomas. PLoS One. 2016;11(4):e0154645.
33. Jain RK. Molecular regulation of vessel maturation. Nat Med. 2003;9:685–93.
34. Floege J, Eitner F, Alpers CE. A new look at platelet-derived growth factor in
renal disease. J Am Soc Nephrol. 2008;19(1):12–23.
Publisher’s Note
Springer Nature remains neutral with regard to jurisdictional claims in
published maps and institutional affiliations.
Page 13 of 13


![Báo cáo khóa học: Selective release and function of one of the two FMN groups in the cytoplasmic NAD + -reducing [NiFe]-hydrogenase from Ralstonia eutropha pptx](https://media.store123doc.com/images/document/14/rc/gg/medium_ggg1394180403.jpg)