Effect of income on consumption of different food commodities across different groups of households of Tamil Nadu, India
Bạn đang xem bản rút gọn của tài liệu. Xem và tải ngay bản đầy đủ của tài liệu tại đây (573.64 KB, 9 trang )
Int.J.Curr.Microbiol.App.Sci (2017) 6(3): 2256-2264
International Journal of Current Microbiology and Applied Sciences
ISSN: 2319-7706 Volume 6 Number 3 (2017) pp. 2256-2264
Journal homepage:
Original Research Article
/>
Effect of Income on Consumption of Different Food Commodities across
Different Groups of Households of Tamil Nadu, India
K. Thomas Felix*, P. Naveen Kumar and D. David Rajasekar
Department of Agricultural Economics, Tamil Nadu Agricultural University,
Coimbatore-641003, India
*Corresponding author
ABSTRACT
Keywords
Consumption,
Food expenditure,
Households,
Tamil Nadu and
Engel function.
Article Info
Accepted:
24 February 2017
Available Online:
10 March 2017
Food has been a basic part of our existence and food nourishes the body. The study was
based on the secondary data collected from NSSO household consumer expenditure survey
(unit level data) 68th round was used to extract the necessary data required for the study.
The results of the study revealed that the share of per capita monthly food expenditure to
total monthly consumption expenditure for cereals, pulses, edible oils and beverages were
falling over years in rural and urban households, whereas, there was an increase in the
share of per capita monthly expenditure of meat, milk, vegetables, fish, egg, fresh fruits,
dry fruits and spices in rural and urban households of Tamil Nadu. The Engel curves
showed that the share of per capita monthly expenditure on cereals, vegetables and spices
to total monthly food expenditure were decreasing across 12 fractile income groups and
the share of expenditure on milk, egg, fish, meat, beverages, fruits and edible oil were
increasing across different income groups. The share of per capita monthly expenditure on
nuts was remaining constant across different income groups both in rural and urban
households and the share of expenditure on pulses was decreasing across different income
groups in rural households, while it was increasing across income groups in urban
households.
Introduction
Food has been a basic part of our existence
and food nourishes the body. Food may be
viewed as anything eaten or drunk, which
meets the needs for energy, building,
regulation and protection of the body. In
short, food is the raw material from which our
bodies are made. Intake of the right kind and
amount of food can ensure good nutrition and
health, which may be evident in our
appearance, efficiency and emotional
wellbeing. According to the report of Global
Footprint Network (2012), if the current
population and consumption trends continue,
humanity will need the equivalent of two
earths to support it by 2030. The world
currently produces enough food for its
citizens (FAO, 2011). However, food demand
is only met in the aggregate, as there are
profound disparities in access to food across
geographic regions and across the spectrum of
incomes at both the household and country
levels. Kumar et al., (2011) examined the
food demand in India in the context of a
structural shift in the dietary pattern of its
population. The results had reinforced the
hypothesis of a significant diversification in
2256
Int.J.Curr.Microbiol.App.Sci (2017) 6(3): 2256-2264
the dietary pattern of households in recent
years and found stark differences in the
consumption pattern across different income
quartiles. The analysis of annual growth rates
on area, production and productivity of food
crops in Tamil Nadu over decades revealed
that there was a significant decline in the area
from 1.96 percent in 1961-70 to -0.91 percent
in 2001-2010. Productivity of food grains
showed a positive growth and it increased
from 2.67 percent in 1961-70 to 6.72 percent
in 2001-2010. The Tamil Nadu government
has fixed a production target of 120 lakh
tonnes of food grains in 2013. However,
Tamil Nadu achieved a food grain production
of 110.65 lakh tonnes (LT) in 2013-14. It may
be due to shortfall of 33 percent in the NorthEast monsoon rains and the food grain
production is expected to surpass 110 lakh
metric tonnes in 2013-2014. Taking into
consideration the above facts, the present
study was undertaken to analyse the effect of
income on consumption of different food
commodities across different groups of
households of Tamil Nadu.
Materials and Methods
Engel’s consumption function: Linear Engel
relationships may reflect the non-homothetic
consumer preferences. As the high-income
consumers may prefer to spend large portion
of their income on high value food
commodities such as meat, fish, milk, nuts
and fruits a log-log form of the Engel
equation was framed, which allows the
income elasticity to vary across the different
income classes:
random disturbance term. The parameters αi,
γi, ui are to be estimated. Where αi is the
constant, γi is the expenditure elasticity, ui is
the error term. The Engel function was
estimated by regressing the share of average
monthly per capita consumption expenditure
of different food items to total household food
expenditure share of individual food item on
the per capita monthly income of the
households across 12 fractile groups. After
estimation of the parameters, the predicted
value of wi for food item across different
income groups (12 fractile groups) were
plotted as Engel curves. This study was based
on the secondary data collected from NSSO
household consumer expenditure survey (unit
level data) 68th round was used to extract the
necessary data required for the study.
Results and Discussion
Engel curves - the effect of income on
consumption of different food items in
rural and urban households
Engel functions were fitted for 12 individual
commodity groups both for rural and urban
households by taking share of individual
commodity group in the total budget as
dependent variable and the per capita income
of households across 12 fractile classes as
independent variable. After estimation of the
parameters, the predicted value of Wi (share
of individual commodity group across 12
fractile income groups were calculated and
plotted as Engel curves for 12 commodity
groups.
The Engel function specified for the study is:
ln wi i i ln yi ui
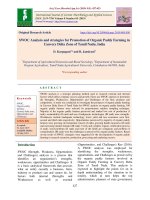
The Engel curves derived for cereals in rural
and urban households are presented as figures
1 and 2.
Where, the dependent variable wi represents
the share of ith commodity in the total budget.
The independent variable yj represents the per
capita income of households, and uij is a
From figures 1 and 2, the share of monthly
expenditure on cereals to total monthly food
expenditure across income groups in rural and
urban households indicated that the
2257
Int.J.Curr.Microbiol.App.Sci (2017) 6(3): 2256-2264
proportion of income allocation on necessary
good such as cereals was high in low income
groups and decreasing continuously across
different income groups in the order of low
income class to high income class. This was
in lines with the theory that income or
expenditure elasticity of necessary goods
would be inelastic in nature. The examination
of shape of the of predicted share of cereals
revealed that the share of cereals was
decreasing steeply in rural households than in
urban households, indicating that income
demand for cereals was more inelastic in rural
households than in urban households
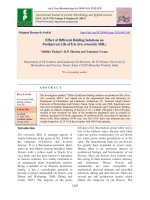
different income groups, proving the theory
that normal and superior goods would have
elastic income demand. The examination of
shape of the of predicted share of milk
revealed that the line was increasing steeply
for urban households than in rural households,
indicating that income demand for milk was
more elastic in urban households than in rural
households.
Engel curve for edible oil in rural and
urban households of Tamil Nadu
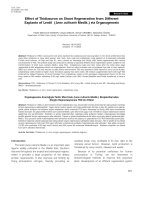
From figures 3 and 4, the share of monthly
expenditure on pulses to total monthly food
expenditure across income groups in rural and
urban households indicated that the
proportion of income allocation on pulses was
decreasing across different income groups in
rural households, while proportion of income
allocation on pulses was increasing across the
across different the income groups in urban
households. This elastic income demand for
pulses in urbanities may be due to the shift to
high valued and highly priced pulses and
pulse based processed products in their
consumption pattern. The expected inelastic
demand was proved in the case of rural
households where, there was a reduction in
the share of expenditure with the increase in
income.
From figures 7 and 8, the share of monthly
expenditure on milk to total monthly food
expenditure across income groups in rural and
urban households indicated that the
proportion of income allocated on milk which
is a normal good was increasing across
different income groups, proving the theory
that normal and superior goods would have
elastic income demand. The share of monthly
expenditure on edible oil to total monthly
food expenditure across income groups in
rural and urban households indicated that the
proportion of income allocated on edible oil
which is a normal good was increasing across
different income groups, proving the theory
that normal and superior goods would have
elastic income demand. The examination of
shape of the of predicted share of edible oil
revealed that it was increasing steeply for
urban households than in rural households,
indicating that income demand for edible oil
was more elastic in urban households than in
rural households.
Engel curve for milk in rural and urban
households of Tamil Nadu
Engel curve for meat in rural and urban
household of Tamil Nadu
From figures 5 and 6, the share of monthly
expenditure on milk to total monthly food
expenditure across income groups in rural and
urban households indicated that the
proportion of income allocated on milk which
is a normal good was increasing across
From figures 9 and 10, the share of monthly
expenditure on meat to total monthly food
expenditure across income groups in rural and
urban households indicated that the
proportion of income allocated on meat which
is a normal good was increasing across
Engel curve for pulses in rural and urban
households of Tamil Nadu
2258
Int.J.Curr.Microbiol.App.Sci (2017) 6(3): 2256-2264
different income groups, proving the theory
that normal and superior goods would have
elastic income demand.
The examination of shape of the predicted
share of meat revealed that the line was
increasing steeply for urban households than
in for rural households, indicating that income
demand for meat was more elastic in urban
households than in rural households.
Engel curve for fish in rural and urban
households of Tamil Nadu
From figures 11 and 12, the share of monthly
expenditure on fish to total monthly food
expenditure across income groups in rural and
urban households indicated that the
proportion of income allocated on fish which
is a normal good was slightly increasing
across different income groups, proving the
theory that normal goods would have elastic
income demand. The examination of shape of
the of predicted share of fish revealed that the
line was increasing slightly for both rural and
urban households, indicating that income
demand for fish was relatively elastic in both
rural and urban households.
Engel curve for eggs in rural and urban
households of Tamil Nadu
From figures 13 and 14, the share of monthly
expenditure on eggs to total monthly food
expenditure across income groups in rural and
urban households indicated that the
proportion of income allocated on eggs,
which is a normal good was slightly
increasing across different income groups,
proving the theory that normal and superior
goods would have elastic income demand.
The examination of shape of the of predicted
line of share of eggs revealed that the line was
increasing slightly for both rural and urban
households, indicating that income demand
for eggs was relatively elastic in both rural
and urban households.
Engel curve for vegetables in rural and
urban households of Tamil Nadu
From figures 15 and 16, the share of monthly
expenditure on vegetables to total monthly
food expenditure across income groups in
rural and urban households indicated that the
proportion of income allocation on inferior
good such as vegetables was high in low
income groups and decreasing continuously
across different income groups in the order of
low income class to high income class. This
was in line with the theory that income or
expenditure elasticity of necessaries would be
in elastic in nature. The examination of shape
of the of predicted share of vegetables
revealed that the line was decreasing steeply
for rural households than in urban households,
indicating that income demand for vegetables
was more inelastic in rural households than in
urban households
2259
Int.J.Curr.Microbiol.App.Sci (2017) 6(3): 2256-2264
2260
Int.J.Curr.Microbiol.App.Sci (2017) 6(3): 2256-2264
2261
Int.J.Curr.Microbiol.App.Sci (2017) 6(3): 2256-2264
Engel curve for fruits in rural and urban
households of Tamil Nadu
From figures 17 and 18, the share of monthly
expenditure on fruits to total monthly food
expenditure across income groups in rural and
urban households indicated that the
proportion of income allocated on fruits
which is a normal good was slightly
increasing across different income groups,
proving the theory that normal goods would
have elastic income demand. The examination
of shape of the predicted share of fruits
revealed that the line was increasing slightly
for both rural and urban households,
indicating that income demand for fruits was
relatively elastic in both rural and urban
households.
Engel curve for dry fruits and nuts in rural
and urban household of Tamil Nadu
From figure 19 and 20, the share of monthly
expenditure on dry fruits and nuts to total
monthly food expenditure across income
groups in rural and urban household indicated
that the proportion of income allocated on dry
fruits and nuts was more or less remaining
2262
Int.J.Curr.Microbiol.App.Sci (2017) 6(3): 2256-2264
constant, indicating a constant income
demand. The examination of shape of the of
predicted share of dry fruits and nuts revealed
that the line was remaining constant for both
rural and urban households, indicating that
income demand for dry fruits and nuts was
relatively constant both in rural and urban
households.
Engel curve for spices in rural and urban
households of Tamil Nadu
From figures 21 and 22, the share of monthly
expenditure on spices to total monthly food
expenditure across income groups in rural and
urban households indicated that the
proportion of income allocation on necessary
good such as spices was high in low income
groups and decreasing continuously across
different the income groups in the order of
low income class to high income class. This
was in line with the theory that income or
expenditure elasticity of necessary goods
would be positive but inelastic in nature.
The examination of shape of the of predicted
share of spices revealed that the line was
decreasing steeply in urban households than
in rural households, indicating that income
demand for spices was more inelastic in urban
households than in rural households.
Engel curve for beverages in rural and
urban households of Tamil Nadu
From figures 23 and 24, the share of monthly
expenditure on beverages to total monthly
food expenditure across income groups in
rural and urban households indicated that the
proportion of income allocated on beverages
which is a normal good was slightly
increasing across different income groups,
proving the theory that normal goods would
have elastic income demand. The examination
of shape of the predicted share of beverages
revealed that the line was increasing slightly
for both rural and urban households,
indicating that income demand for beverages
was elastic in both rural and urban
households.
In conclusion the analysis of Engel curve and
the behaviour of predicted share the of
expenditure of food groups for change in
household income across 12 fractile income
groups indicated that share of expenditure on
cereals, vegetables and spices were
decreasing across the income groups both in
rural and urban areas; the share of expenditure
on pulses was decreasing across the income
groups in rural and increasing across the
income groups in rural urban areas and the
share of expenditure on milk, egg, fish, meat,
beverages, fruits, nuts and edible oil were
increasing across the income groups both in
rural and urban areas of Tamil Nadu, which
indicated that the household food demand in
terms of share of expenditure varied across
different food groups and also across regions
in terms of urban and rural households in
Tamil Nadu.
Acknowledgement
My words are weak to express my
indebtedness to my Chairman, Dr. D. David
Rajasekar,
Professor,
Department
of
Agricultural Economics, Tamil Nadu
Agricultural University, Coimbatore. Grace of
almighty has always been felt in having given
me this unique, dexterous personality to guide
and inspire me with his soft, sincere, valuable
suggestions, to pen this thesis. I owe him a lot
for ever.
References
Abdul, A.A., Gabrel, D., Sadiqy, A. Moblazi,
L.F. and Unoruoyiza, M.M. 2015.
Lumbosacral epidural analgesia with
ketamine alone with combination with
xylazine in dogs. Int. J. Vet. Sci., 4(3):
2263
Int.J.Curr.Microbiol.App.Sci (2017) 6(3): 2256-2264
111-117.
Aithal, H.P., Amarpal, Singh, G.R. 1998.
Epidural use of ketamine for
hindquarter analgesia in dogs. Indian J.
Animal Sci., 68(6): 554.
Amarpal, Aithal, H.P., Kinjavdekar, P. and
Singh, G.R. 1997. Clinical effects of
epidural ketamine and pethidine in
dogs. 21 Annual Congress of I.S.V.S.,
Palampur, Abstract no. 30.
Atalan, G., Uzun, M., Demirkan, I., Yildiz, S.,
and Cenesiz, M. 2002. Effect of
Medetomidine-Butorphanol-Ketamine
Anaesthesia and Atipamezole on Heart
and Respiratory Rate and Cloacal
Temperature of Domestic Pigeons. J.
Vet. Med., A 49(6): 281-285.
Booth, N.H. 1981. Veterinary Pharmacology
and Therapeutics, 4th edn., ed. by L.
Mayer Jones, Nicholas H. Booth, W.
Both, Leslie E. McDonald. Oxford and
IBH Published Co. New Delhi, Bombay
and Calcuta, 436-445.
Cousins, M.J. and Mather, L.E.
1984.
Intrathecal and epidural administration
of opioids. Anesthesiol., 61(3): 276-310.
De Rossi, R., Sampaio, B.F.B., Varela, J.V.
and Junqueira, A.L. 2004. Perineal
analgesia and hemodynamic effects of
the
epidural
administration
of
meperidine or hyperbaric bupivacaine in
conscious horse. Canadian Vet. J.,
45(1): 42-47.
DeRossi, R., Benites, A.P., Ferreira, J.Z.,
Neto, J.M. and Hermeto, L.C. 2009.
Effects of lumbosacral epidural
ketamine and lidocaine in xylazinesedated cats. J. S. Afr. Vet. Assoc., 80:
79-83.
Erol, I.M., Özdogan, L., Örnek, D., Tas, V.,
Kalaycı, D., Barçın, S., Sahin, F., Erk,
G. and Dikmen, B. 2014. Effect of
ketamine on the quality of anesthesia
and postoperative analgesia in epidural
anesthesia. JECM, 6: 83-89.
Folts J.D., Afonso, S. and Rowe, G.G. 1975.
Systemic and coronary haemodynamic
effects
of
ketamine
in
intact
anaesthetized and unanaesthetized dogs.
Br. J. Anaesth., 47(6): 686-94.
Freeman, J. 1962. Survival of bled dogs after
halothane and ether anaesthesia. Br. J.
Anaesth., 34: 832
Geddes, L.A., Combs, W. and Denton, W.
1980. Indirect mean arterial pressure in
the anaesthetized dog. Am. J. Physiol.,
238: 664-666.
How to cite this article:
Thomas Felix, K., P. Naveen Kumar and David Rajasekar, D. 2017. Effect of Income on
Consumption of Different Food Commodities across Different Groups of Households of Tamil
Nadu, India. Int.J.Curr.Microbiol.App.Sci. 6(3): 2256-2264.
doi: />
2264