A comparative analysis of genetic diversity in chrysanthemum (Dendranthema grandiflora Tzvelec) cultivars based on RAPD and ISSR markers
Bạn đang xem bản rút gọn của tài liệu. Xem và tải ngay bản đầy đủ của tài liệu tại đây (418.5 KB, 10 trang )
Int.J.Curr.Microbiol.App.Sci (2017) 6(3): 2134-2143
International Journal of Current Microbiology and Applied Sciences
ISSN: 2319-7706 Volume 6 Number 3 (2017) pp. 2134-2143
Journal homepage:
Original Research Article
/>
A Comparative Analysis of Genetic Diversity in Chrysanthemum
(Dendranthema grandiflora Tzvelec) Cultivars based on
RAPD and ISSR Markers
P. Lalitha Kameswari* and A. Girwani
Floricultural Research Station, Dr.YSR Horticultural University, Hyderabad- 500030, India
*Corresponding author
ABSTRACT
Keywords
Dendranthema
grandiflora T.,
genetic diversity,
molecular markers,
RAPDs, ISSRs,
comparision.
Article Info
Accepted:
20 February 2017
Available Online:
10 March 2017
Two molecular techniques, RAPD and ISSR were used to study the genetic relatedness in
37 genotypes of chrysanthemum. With 27 RAPDs and 10 ISSRs, a total of 271 and 107
polymorphic bands were generated accounting to 97.4% and 93.86% polymorphism
respectively. Both kinds of markers could able to distinguish all the genotypes. Based on
RAPD, ISSR and combination of RAPD and ISSR markers, dendrograms were constructed
according to Jaccard’s Coefficient of similarity. Though the results obtained from cluster
analysis based on RAPD and ISSR data sets were different, the genotypes Snow Cem and
Ratlam Selection; Akitha and Shintome as well were clustered in one group in both the
clusters indicating the efficiency of two systems. This was also reflected in the correlation
coefficient calculated based on similarity matrices of RAPD and ISSR by using Mantel
test. Although the value of correlation coefficient between RAPD and ISSR markers was
significant as r = 0.3906, indicating that there is a faint concordance between RAPDs and
ISSRs. This inferred that the two sets of markers explore genetic variation differently
among the chrysanthemum genotypes. The data generated in the present investigation
provide information useful not only for selection programmes for further improvement of
chrysanthemum, but also for the establishment of relationship among genotypes
worldwide.
Introduction
Chrysanthemum (Dendranthema grandiflora
Tzvelec), a herbaceous perennial flowering
plant has been much loved by the people
world-wide as a cut flower. It is one of the
oldest cultivated flower crop which plays a
significant role in the culture and life of
people. Today Chrysanthemums can be found
with most of the colours of the spectrum and
the pot-mum production has become the most
profitable
form
of
commercial
Chrysanthemum growing. Economy of space,
time, material, etc. has made this style of
growing very promising
and an excellent range of colour, form, long
lasting quality of blooms and ease in handling
make them most popular. Because of its
multifarious traditional uses, the crop has its
own commercial value and a good number of
varieties have been released.
The commonly grown Chrysanthemums are
hexaploids with average number of 54
chromosomes (Wolff, 1996). The modern,
large, double and exquisitely flowered
cultivars owe their origin to relatively small,
single and non attractive types. This great
2134
Int.J.Curr.Microbiol.App.Sci (2017) 6(3): 2134-2143
transformation is the result of centuries of
natural cross pollination, spontaneous and
intentional hybridization coupled with
mutation, chromosomal differentiation and
polyploidy (Nazeer and Khashoo, 1982).
Most extensive work has been done for
developing novel Chrysanthemum genotypes
through induced mutation using physical and
chemical mutagens (Broetjes and Van Harten,
1978).
Materials and Methods
Since most of the ornamental plant
improvement programs concentrate on
aesthetic qualities such as flower and plant
characteristics, the genetic base of the modern
cultivars is becoming more and more narrow.
Coupled with global marketing and adoption
of these cultivars worldwide, many heir loom
varieties of these crops are being replaced by
modern narrow genetic base cultivars,
resulting in continuous loss of our traditional
cultivars.
Hence,
characterization
of
germplasm is essential to provide information
on the traits of accessions assuring the
maximum utilization of the germplasm
collection for the benefit of end user. The
assessment
of
diversity
based
on
morphological parameters has been often
constrained by lack of precise data on
distinguishable morphological characters and
their weakness of environmental influence.
With the advent of molecular biology
techniques, DNA based markers played a
significant role in the identification and
characterization of germplasm. The first study
on the identification of Chrysanthemums with
the application of RAPD markers was carried
out by Wolff and Peters-Van Rijn
(1993).Considering the potentials of the DNA
marker based genetic diversity analysis, the
present study aimed to evaluate the usefulness
of molecular markers viz. RAPD and ISSRs,
in assessing and analysing the nature and the
extent of genetic diversity among the
genotypes of Chrysanthemum.
DNA Isolation
Plant Material
The plant material used for the study
consisted of 37 genotypes of Chrysanthemum
listed in Table 1, collected from germplasm
block of Chrysanthemum belonging to
Floricultural Research Station, Rajendranagar,
Hyderabad.
Total genomic DNA was extracted from
fresh, young leaves of Chrysanthemum
following the standard CTAB method (Cetyl
Trimethyl Ammonium Bromide) with minor
modifications (Murray and Thompson, 1980).
RNA was removed by digesting with RNaseA
(10 mmol dm-3). Purity of DNA was assessed
electrophoretically on 0.8% agarose gel
stained with ethidium bromide in comparison
with standard DNA ladders and the
concentration and quality of DNA was also
estimated spectrophotometrically by using
Nano Drop spectrophotometer at 260 nm. The
template DNA samples were diluted to make
the working solutions of 5ng/µl for PCR
analysis.
RAPD PCR – amplification
Total 124 primers (Operon, USA) were
screened out of which 27 decamers belonging
to OPE, OPH, OPI, OPF, OPG, OPK, OPJ,
OPL and OPM series were selected for PCR
amplification of genomic DNA of
Chrysanthemum genotypes. List of primers
used in the study was furnished in Table 2.
The RAPD reaction mixture consisted of 5 ng
of template DNA, 1x PCR buffer (10 mMTris
pH 9.0, 50 mMKCl, 1.5 mM MgCl2), 100
mM of each of the four dNTPs, 0.4 mM of
RAPD primer and 0.3 Units of TaqDNA
polymerase (Bangalore Genei, India) in a
2135
Int.J.Curr.Microbiol.App.Sci (2017) 6(3): 2134-2143
reaction volume of 10 µl. Amplifications were
carried out in a Gene Amp 9700 thermal
cycler (Perkin Elmer Applied Biosystems)
with initial denaturation at 940 C for 3
minutes followed by 45 cycles of1 min at 920
C, annealing temperature of 370C for 30 sec
and primer extension at 720C for 2 min and
final extension at 720C for 7 min. The PCR
amplified
products
were
separated
electrophoretically on 1.0% agarose gels. The
gel images were recorded using the Alpha
Innotech Fluorchem gel documentation
system and the sizes of amplification products
were determined by comparison to Eco RI
and Hind III double digest (Bangalore Genei,
India) as molecular weight standard. The
reproducibility of the amplification was
confirmed by repeating each experiment two
times.
Data Analysis
Ambiguous bands that could not be easily
distinguished were not scored (Williams et
al., 1990). A clear band was scored as ‘1’ and
‘0’ for the absence of band for each primer.
Jaccard’s similarity coefficient (J) was used to
calculate similarity between pairs of
genotypes where, J = nx,y / (nt - nz), nx,y is
the number of bands common to genotype A
and genotype B; the total number of bands
present in all samples and nz the number of
bands not present in A and B but found in
other samples. Cluster analysis was
performed on molecular similarity matrices
using the Unweighted Pair Group Method
using Arithmetic means (UPGMA) algorithm,
from which dendrograms depicting similarity
among genotypes were drawn and plotted
using NTSYS-pc. 2.1 Software (Rohlf, 2000).
ISSR PCR – amplification
Results and Discussion
A set of 46 UBC primers (UBC primer set
No. 9, University of British Columbia,
Canada) were screened out of which 10
primers were used for ISSR amplification
(Table-3).The PCR reaction was carried out in
a total volume of 10 μl containing 1.0 µl of 5
ng template DNA, 1.0 µl of 1x PCR buffer
(10 mMTris pH 9.0, 50 mMKCl, 1.5 mM
MgCl2), 0.2 µl of 25 mM MgCl2, 0.6 µl of
200 mM of each of the four dNTPs, 1.0 µl of
0.4 mM ISSR primer and 0.2 µl of 0.6 UTaq
DNA polymerase (Bangalore Genei, India).
PCR amplifications were performed in a Gene
Amp 9700 thermal cycler (Perkin Elmer
Applied Biosystems) with initial denaturation
at 940 C for 4 minutes followed by 35 cycles
of30 sec at 920 C, 1 min at annealing
temperature of 450C (+/- 50C) for 1 min and
primer extension at 720C for 1 min and final
extension at 720C for 7 min. The amplified
products were resolved on 1.7% gel and
documented in a gel documentation system
(Alpha Innotech Flourchem).
RAPD Analysis
A total of 278 amplified fragments were
scored with 27 selected RAPD primers, out of
which 271 were found to be polymorphic
(97.4%)(Table-2). The number of DNA
fragments amplified per primer ranged from 7
(OPE-15, OPG- 9, OPG-16, OPH-13, OPH20) to 17 (OPK-19) with a mean value of 10.3
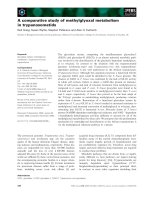
bands per primer. The amplification products
obtained with primer OPE-18 are illustrated
in Fig 1.The amplicon sizes ranged from 350
bp to 3500 bp. All the primers except OPE14, OPE-15, OPE-18, OPF-3, OPF-5 and
OPI-18
gave
highest
polymorphism
(100%).The high polymorphism observed in
the present study confirms much diversity
existing within this germplasm. The total
number of amplified fragments generated per
primer had no correlation with proportion of
polymorphic bands. Similar pattern was
observed by Williams et al., (1993). Genetic
similarity based on Jaccard’s coefficient
2136
Int.J.Curr.Microbiol.App.Sci (2017) 6(3): 2134-2143
revealed considerable level of diversity
among the genotypes under the study. The
similarity index varied from 0.174 to 0.600
with an average of 0.387 among the group of
genotypes.
The genotypes Ratlam Selection and Snow
Cem were found to be most genetically
similar (60.0%) followed by Akitha and
Shintome with 55.3% and Terry and Salora
with 55.1%. On contrary, Aparajitha and
Lilith were found to be the least genetically
similar (17.4%).All the remaining ones
exhibited diverse intermediate levels of
similarity. The derived UPGMA dendrogram
resulted in eleven clusters at a genetic
similarity coefficient of 0.23 with Chandrika
and Aparajitha at the extreme ends of the
dendrogram (Fig 2).The reason for the
separation of these genotypes as individual
clusters may be due to their different genetic
backgrounds. All the 37 genotypes were
grouped into four major clusters of which
three genotypes were grouped in cluster I,
five genotypes in cluster II, nineteen
genotypes in cluster III, three genotypes in
cluster IV and seven minor clusters with one
genotype each in cluster V (Arka Ravi), VI
(Meera), VII (Asha), VIII (Silper), IX
(Autumn Joy), X (Lilith) and cluster XI
(Chandrika).
ISSR Analysis
Among forty six ISSR primers used in the
preliminary analysis, only ten primers
generated the scorable PCR products. A total
of 114 bands were produced, of which 107
bands were polymorphic, accounting for
93.86% polymorphism (Table-3).
Table.1 List of genotypes used for molecular studies in Chrysanthemum
S.No.
1
2
3
4
5
6
7
8
9
10
11
12
13
14
15
16
17
18
19
Name of the genotype
Aparajitha
Punjab Gold
CO-3
Raichur
Silper
Yellow Gold
Punjab Anuradha
Rekha
Chandrika
Snow Cem
Meera
Shaffoli
Terry
Shintome
Arka Ravi
Ratlam Selection
Neelima
Flirtation
Mother Teresa
2137
S.No.
20
21
22
23
24
25
26
27
28
29
30
31
32
33
34
35
36
37
Name of the genotype
Autumn Joy
Anjali
Akitha
PAU-B-107
Farr
Jaya
Harvest House
Lilith
Asha
Pusa Centenary
Salora
IIHR-13
Basanthi
Red Stone
Geetanjali
Red Gold
Kalyani Mauve
Local Button
Int.J.Curr.Microbiol.App.Sci (2017) 6(3): 2134-2143
Table.2 Details of RAPD primers used in Chrysanthemum
S.
No.
RAPD
primer
Nucleotide
sequence(5'-3')
Number
of bands
1
OPE-14
TGCGGCTGAG
10
Total no. of
polymorphic
bands
9
Percentage
polymorphism
(100%)
90.00
Size of
amplified
product(bp)
450-3300
2
OPE-15
ACGCACAACC
7
6
85.71
830-2000
3
OPE-16
GGTGACTGTG
11
11
100.0
420-2600
4
OPE-18
GGACTGCAGA
11
10
90.90
600-3300
5
OPE-19
ACGGCGTATG
12
12
100.0
440-3000
6
OPF-3
CCTGATCACC
9
8
88.89
500-2200
7
OPF-5
CCGAATTCCC
8
7
87.50
750-3000
8
OPF-19
CCTCTAGACC
10
10
100.0
450-2500
9
OPG-9
CTGACGTCAC
7
7
100.0
750-2000
10 OPG-16
AGCGTCCTCC
7
7
100.0
800-1600
11 OPG-19
GTCAGGGCAA
11
11
100.0
350-2027
12 OPH-13
GACGCCACAC
7
7
100.0
600-3000
13 OPH-16
TCTCAGCTGG
11
11
100.0
350-1900
14 OPH-17
AAGCAGCAAG
11
11
100.0
400-2000
15 OPH-20
CACCGTTCTG
7
7
100.0
420-2000
16 OPI-6
AAGGCGGCAG
14
14
100.0
560-2000
17 OPI-18
TGCCCAGCCT
12
10
83.33
600-3500
18 OPI-19
AATGCGGGAG
12
12
100.0
450-2200
19 OPI-20
AAAGTGCGGG
11
11
100.0
450-2500
20 OPJ-14
CACCCGGATC
13
13
100.0
350-2000
21 OPJ-15
TGTAGCAGGG
13
13
100.0
564-3000
22 OPM-10
TCTGGCGCAC
9
9
100.0
500-1900
23 OPK-8
GAACACTGGG
11
11
100.0
750-2200
24 OPK-18
CCTAGTCGAG
9
9
100.0
550-3300
25 OPK-19
CACAGGCGGA
17
17
100.0
450-2500
26 OPL-1
GGCATGACCT
8
8
100.0
450-2200
27 OPL-18
ACCACCCACC
10
10
100.0
600-2000
Source: Operon Technologies, INC. 1000 Atlantic Avenue Suite 108,
2138
Alameda, CA
Int.J.Curr.Microbiol.App.Sci (2017) 6(3): 2134-2143
Table.3 Details of ISSR primers and amplified bands of all the DNA samples as obtained from
thirty seven genotypes of Chrysanthemum
S.
No
Primer
Annealing
temperature
(0C)
DNA
repeats
No. of
total
bands
Polymorphic
bands(%)
Size range of
amplified
product(bp)
1
808
520C
(AG)8C
15
15(100%)
250-1550
810
0
50 C
(GA)8T
8
8(100%)
220-1800
812
0
50 C
(GA)8A
9
9(100%)
400-1400
825
0
50 C
(AC)8T
7
5(71.43%)
400-1400
836
0
53 C
(AG)8YA
11
10(90.91%)
250-2000
840
0
53 C
(GA)8YT
12
12(100%)
300-2000
842
0
55 C
(GA)8YG
12
12(100%)
420-1900
8
846
0
53 C
(CA)8RT
12
11(91.67%)
400-2000
9
855
530C
(AC)8YT
13
11(84.62%)
250-1600
857
0
(AC)8YG
15
14(93.33%)
220-1550
114
107
2
3
4
5
6
7
10
55 C
Note : Y = Pyrimidine (C or T) and R = Purine (A or G)
Fig.1 RAPD profile of 37 genotypes of Chrysanthemum with primer OPE-18
Amplicon size ranged from 600bp to 3300bp. M- marker, EcoR1- Hind III double digest of ג
DNA; NC- negative control (no DNA), 1-37 represent the genotypes. Refer table 1 for identity
code of these cultivars
2139
Int.J.Curr.Microbiol.App.Sci (2017) 6(3): 2134-2143
Fig.2 Dendrogram generated using UPGMA analysis showing the genetic relationship among
Chrysanthemum genotypes using RAPD data
I
II
III
IV
VVI
VII
VIII
IXX
XI
2140
Int.J.Curr.Microbiol.App.Sci (2017) 6(3): 2134-2143
Fig.3 Dendrogram generated using UPGMA analysis showing the genetic relationship among
Chrysanthemum genotypes using ISSR data
I
II
III
IV
V
VI
VII
VIII
IX
X
2141
Int.J.Curr.Microbiol.App.Sci (2017) 6(3): 2134-2143
Fig.4 Dendrogram generated using UPGMA analysis showing the genetic relationship among
Chrysanthemum genotypes using RAPD + ISSR data
I
II
III
IV
V
VI
VII
VIII
IX
X
XI
The number of bands varied from 7(ISSR825) to 15(ISSR-808 and ISSR-857)
depending on the primer with a mean value of
11.4 bands per primer. The amplicon sizes
obtained with the ISSR primers ranged from
220bp to 2000bp. The percentage of
polymorphism exhibited by ISSR primers
ranged from71.43% (ISSR-825) to 100%
(ISSR-808, 810, 812, 840 and 842).The
genetic similarity matrix ranged from 0.275 to
0.775 with an average of 0.525. The lowest
similarity index (0.275) was scored between
Autumn Joy and Flirtation that seem to be
most divergent cultivars. The genotypes
Geetanjali and Red Stone exhibiting the
highest similarity index value of 0.775, are
the most similar cultivars. The derived
UPGMA dendrogram (Fig 3) exhibits ten
clusters and the pattern revealed that, cluster
IV was the largest one consisting of 11
genotypes followed by cluster III with six
genotypes. Cluster V included five genotypes,
cluster VIII with four genotypes, cluster I and
II with three genotypes each, cluster VI with
two genotypes and cluster VII, IX and X with
one genotype each.
RAPD and ISSR Polymorphism
The RAPD data was combined with ISSRs in
order to precise the relationships between the
cultivars studied and a total of 378
polymorphic bands were generated. The
similarity coefficients ranged from 0.243 to
0.629 with a mean similarity index of 0.436.
The genotypes Snow Cem and Ratlam
2142
Int.J.Curr.Microbiol.App.Sci (2017) 6(3): 2134-2143
Selection were almost similar with highest
similarity index of 0.629 registered between
them. The genotypes Autumn Joy and
Basanthi showed lowest similarity index of
0.243. The dendrogram generated (Fig 4)
illustrates the divergence among the
genotypes. The grouping from combined
analysis was similar in composition to that of
RAPD. The results obtained from cluster
analysis based on RAPD and ISSR data sets
were different which was also reflected in the
correlation coefficient value of r = 0.3906 by
using Mantel test. This inferred that the two
sets of markers explore genetic variation
differently. According to the results, both the
marker techniques could satisfactorily detect
the
genetic
variation
and
thereby
demonstrates the usefulness of these markers
for further use in germplasm characterization
of cultivars, including legal issues like
assessing infringements on plant breeders
rights.
References
Broetjes, C. and Van Harten, A.M. 1978.
Application of mutation breeding
methods in the improvement of
vegetatively propagated crops. An
Interpretative
literature
review,
Elsevier, Amsterdam.
Murray, M. and Thompson, W. 1980. The
isolation of high weight plant DNA,
Nucleic Acids Res., 8: 4321-4325.
Nazeer,
M.A.
and
Khashoo,
R.N.
1982.Cytogenetical
evaluation
of
garden Chrysanthemum, Curr. Sci., 51:
583-585.
Rohlf, F.J. 2000. NTSYS-pc: Numerical
Taxonomy and Multivariate Analysis
System. Version 2.1 Exceter Software,
New York, USA.
Williams, G.K., Kubelik, A.R., Livak, K.L.,
Rafalski, J.A. and Tingey, S.V. 1990.
DNA polymorphisms amplified by
arbitrary primers are useful as genetic
markers. Nucleic Acids Res., 18: 65316535.
Williams, G.K., Hanafey, M.K., Rafalski, J.A.
and Tingey, S.V. 1993. Genetic analysis
using randomly amplified polymorphic
DNA markers. Methods in Enzymol.,
218: 704-741.
Wolff, K. 1996. RAPD analysis of reporting
and chimerism in Chrysanthemum,
Euphytica, 89: 159-164.
Wolff, K. and Peters-Van Rijn, J. 1993. Rapid
detection of genetic variability in
Chrysanthemum (D. grandiflora T.)
using random primers, Heredity, 71:
335-341.
How to cite this article:
Lalitha Kameswari, P., and Girwani, A. 2017. A Comparative Analysis of Genetic Diversity in
Chrysanthemum (Dendranthema grandiflora Tzvelec) Cultivars based on RAPD and ISSR
Markers. Int.J.Curr.Microbiol.App.Sci. 6(3): 2134-2143.
doi: />
2143