A study of nitrous oxide emission from rice fields in Tarai region of Uttarakhand, India
Bạn đang xem bản rút gọn của tài liệu. Xem và tải ngay bản đầy đủ của tài liệu tại đây (282.77 KB, 8 trang )
Int.J.Curr.Microbiol.App.Sci (2017) 6(4): 423-430
International Journal of Current Microbiology and Applied Sciences
ISSN: 2319-7706 Volume 6 Number 4 (2017) pp. 423-430
Journal homepage:
Original Research Article
/>
A Study of Nitrous oxide Emission from Rice Fields in
Tarai Region of Uttarakhand, India
P.P. Singh1, Rashmi Pawar2 and R. Meena3*
1
2
Deptartment of Agromateorology, JNKVV, Jabalpur (M.P.), India
Department of Horticulture, G.B. pant University of Agriculture and Technology, Pantnagar,
Uttarakhand, India
3
Department of Soil Science and Agricultural Chemistry, Institute of Agricultural Sciences,
Banaras Hindu University, Varanasi- 221 005 (U.P.), India
*Corresponding author
ABSTRACT
Keywords
Oxide flux, Growth
stages, Rice crop,
Methane emission,
Nitrous oxide
emission.
Article Info
Accepted:
02 March 2017
Available Online:
10 April 2017
A study was conducted at Crop Research Center of G.B. pant University of Agriculture
and Technology, Pantnagar in Tarai region of Uttarakhand, India to quantify nitrous oxide
emission from rice fields due to the addition of different organic amendments and
inorganic fertilizers. The average nitrous fluxes for rice were 0.57, 1.87, 2.37, 3.52 and
1.27 mg m-2 h-1 from control with crop, farmyard manure (FYM), green manure (GM),
straw amendments and sulphur fertilizers, respectively. Among different growth stages of
rice transplanting to tillering growth stage nitrous oxide flux was maximum in straw
amendment, 5.79 mg m-2 h-1 while lowest in control 0.53 mg m-2 h-1. After that, during
tillering highest flux was 3.58 mg m-2 h-1, with lowest in control 0.79 mg m-2 h-1. During
reproductive to ripening growth stage nitrous oxide flux was highest in straw amendments,
2.72 mg m-2 h-1, followed by GM amendments, 2.47 mg m-2 h-1, FYM amendments, 1.47
mg m-2 h-1, sulphurus fertilizers 0.95 mg m-2 h-1, and the lowest was in control with crop,
0.35 mg m-2 h-1. Lastly ripening to maturity growth stage nitrous oxide flux was highest in
GM amendments, 1.69 mg m-2 h-1, followed by FYM amendments, 1.18 mg m-2 h-1, straw
amendments, 0.42 mg m-2 h-1, sulphurus fertilizer, 0.43 mg m-2 h-1, and the lowest was in
control with crop, 0.38 mg m-2 h-1. The results indicated that nitrous oxide emission was
enhanced by undecomposed organic amendments (straw and green manure) as compared
to well-decomposed organic amendments (farmyard manure) and sulphurus fertilizers.
Introduction
Nitrous oxide is an important green house gas
and its concentration in atmosphere was
estimated as 2.6810-2 mL L-1 around 1750. It
has increased by about 17% as a result of
human alterations in the global N cycle
(IPCC, 2001). Nitrous oxide has much greater
global warming potential than CO2. When
N2O reaches the stratosphere, most of it is
converted to N2 through photolytic reaction
that converts O3 into O2 thereby causing the
stratosphere to lose some of its shielding
properties against
ultra violet
rays
(Schlesinger, 1997). Nitrous oxide forms in
soils primarily during the process of
gentrification (Robertson and Tiedje, 1987)
and, to a lesser extent, during nitrification
423
Int.J.Curr.Microbiol.App.Sci (2017) 6(4): 423-430
(Tortoise and Hutchinson, 1990). Global
annual N2O emissions from agricultural soils
have been estimated to range between 1.9 and
4.2 Tg N, with about half arising from
anthropogenic sources (IPCC, 2001). The
major factor controlling the flux of N2O are
partial oxygen pressure, soil water status and
flooding chemical status of the soil and land
use. Nitrous oxide emission of paddy fields at
different location in Taiwan was found
between 0.20 to 0.17 mg m-2 in second crop
season. Nitrous oxide emission in first crop
season was higher than those in the second
crop season because of intermittent irrigation
and high temperature at the later growth
stage.
Rice field preparation and transplanting
Materials and Methods
Gas samples were collected by closed
character technique described by Hutchinson
and Mosier (1981). Boxes made of acrylic
sheets, having dimensions of 50x30x100cm
were used for taking the gas samples from
plots. An aluminum channel was pre inserted
in the field and water was filled in channel,
whenever the chamber was placed for
collecting the samples to make the set airtight.
One mediflex three ways top cock (Eastern
Medikit Ltd., India) was fitted at the top of
chamber to collect gas samples. Three
replicate gas samples were taken from each
plot. Height of the headspace was taken for
flux calculation.
Harrowing was done twice with the help of
harrow and puddling was done with the help
of tractor- mounted puddler to prepare the
field for rice transplanting. Twenty one days
old seedling of rice variety pant Dhan-4 were
transplanting at the rate of 2 seedlings per hill.
The spacing among hills was 10x20cm. Half
dose of nitrogen as per treatment and full dose
of phosphorous and potassium were applied
as basal dressing during field preparation and
pudding and mixed well in the soil remaining
half of nitrogen was applied
Collection of gas sample
The experiment was conducted in Kharif
season on the Haldi loam soil, which is
derived from calcareous alluvium from
Shiwalik Mountains. The water table is
shallow. The physico-chemical properties of
soil are given in Table 1.
Layout and treatment
The experiment was conducted with five
treatments and four replications in
randomized block design. The treatments
were T1- Control with, T2- 100% NPK +
FYM, T3- 100% NPK + GM, T4- 100% NPK
+ Straw and T5- 100% NPK + Sulphur. FYM
and GM mean farmyard manure and green
manure, respectively. The 100% NPK
recommended dose for rice was 150:60:40 kg
ha-1. The nitrogen provided by FYM, GM and
Straw was subtracted from 150 kg N and
remaining nitrogen was applied through urea.
The nitrogen content of organic amendments
is given in table 2. In treatment T5, NPK were
given through sulphur containing fertilizers
like ammonium sulphate, single super
phosphate and potassium sulphate and
through, zinc sulphate.
Analysis of gas sample
The concentration of nitrous oxide was
estimated through ECD (Electron Capture
Detector), fitted with Porapak N stainless
steel column. The temperature for column,
injector and detector were kept at 45,120 and
300 0C, respectively and the pressure of
carrier gas (nitrogen) was 5.0 kg/ cm2. The
peak area was measured with microprocessor
controlled
Nucon
5765
series
gas
chromatograph with integrator connected to
computer. Pre-calibrated standards of nitrous
424
Int.J.Curr.Microbiol.App.Sci (2017) 6(4): 423-430
oxide (Scott specialty gas standard, imported
and supplied by M/S Sigma- Aldrich) was
used. The area of standard nitrous oxide peak
was used to calculate the nitrous oxide
concentration in the unknown gas sample
peaks.
Change in Concentration in time t
=
(Ct-Co) ppmv
Measurement of nitrous oxide flux
=
(Ct-Co)AH mL.
When t is in minutes then flux (F)
=
[{Ct-Co)AH]/(At)mLm-2min-1
=
(Ct-Co) µ L/L
Volume of N2O emitted in time t
=
(Ct-Co) 111000AHL.
Standard curves were made from the standard
samples of know concentrations. Then gas
samples gas of unknown concentrations were
injected and the peak areas were noted. Using
the peak area value and the standard, the
concentrations values were taken. To measure
flux, the chamber fixed at the experimental
site and the change in concentrations in the
chamber so formed, with time, was
determined by taking triplicate gas samples
from the chamber headspace by syringe and
transported them to the laboratory for
analysis.
=
If Y
=
Ct-Co H t
Then flux nitrous oxide
=
Y 44/22400 gm-2 min-1
Because 1 mL of nitrous oxide
=
44/22400g
=
Y44/22400100060 mg m-2
-1
h
Hence, F
=
Calculation of nitrous oxide flux
Ct-Co H117.857 mg m-2 h-1t
Results and Discussion
The nitrous oxide flux (F) was calculated
using the following equation (Mitra et al.,
1999).
F=
Y mL m-2 min-1
Nitrous oxide flux measurement was carried
out up to eighty- two days after transplanting
and started from ten days after transplanting
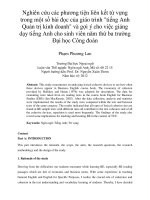
of rice. The data on nitrous oxide emission are
presented in table 3. The Nitrous oxide
emission over the seventy two days period
from rice crop was 109.1, 355.6, 450.9,668.5
and 242.2 g ha-1 in control with crop, 100%
NPK + FYM, 100% NPK +GM, 100% NPK
+ Straw and 100% NPK + Sulphur treatments.
This indicated that highest nitrous oxide
emission was in straw treated plots. This is
because the addition of un-decomposed
organic amendments enhances the nitrous
oxide emission. Different growth stages of
rice also play an important role in the nitrous
oxide emission (Figure 1). It was found that
during tillering stage the nitrous oxide flux
was maximum in straw amendment i.e. 5.79
mg m-2 h-1 followed by GM amendment i.e.
[(C1-CO)/t]H117.85 mg m-2 h-1
Where t is time (minute), initial concentration
(ppmv), Ct is final concentration (ppmv), and
H is height of head space (m). The derivation
of above equation will be as:
Cross sectional area of the chamber
=
A m2
Height of head space
=
Hm
Volume of head space
=
A H m3
N2O concentration at 0 time
=
Co ppmv
N2O concentration after time t
=
Ct ppmv
425
Int.J.Curr.Microbiol.App.Sci (2017) 6(4): 423-430
1.45 mg m-2 h-1, FYM amendment (1.60) mg
m-2 h-1, sulphurus fertilizers oxide emission
during tillering stage is mainly due to higher
vegetative growth of rice crop. Similarly,
panicle initiation stage the nitrous oxide flux
was highest in straw amendment (3.58)
followed GM (2.74), FYM (2.53), sulphurus
fertilizers (1.78) and the lowest in control
with crop (0.79 mg m-2 h-1). During
reproductive stage the nitrous oxide flux was
in highest straw amendments (2.52) followed
by FYM (2.28), GM (2.24) sulphurus
fertilizers (1.47) and lowest was in control
with crop (0.62 mg m-2 h-1) During ripening
stage the nitrous oxide flux was 2.72 mg m-2
h-1 in straw amendment followed by GM
(2.47), FYM (1.47), sulphurus fertilizers
(0.95) lowest was in control with crop
amendment (0.35 mg m-2 h-1) During
maturing stage the highest nitrous oxide flux
was observed in GM amendment (1.69)
followed by FYM (1.18), sulphurus fertilizers
(0.43), straw (0.42) and lowest was in control
with crop i.e., 0.38 mg m-2 h-1.
Table.1 Physico-chemical properties of initial soil
Property
EC (d Sm-1)
Soil pH(1:2)
Organic carbon (%)
Available nitrogen (kg ha-1)
Available phosphorous (kg ha-1)
Available potassoum (kg ha-1)
Soil depth
0-15 cm
0.10
7.74
1.10
172.5
31.4
241.9
15-30 cm
0.11
7.87
0.82
106.6
12.5
156.8
Table.2 Nitrogen content of organic amendments
Organic Amendment
FYM
Green Manure
Wheat Straw
Nitrogen Content(%)
Nitrogen provided to soil
(kg ha-1)
0.50
0.49
0.53
50
49
53
426
Int.J.Curr.Microbiol.App.Sci (2017) 6(4): 423-430
Table.3 Effect of organic and inorganic sources of nutrients on nitrous oxide gas emission from rice field at different stage
Days after Transplanting (DAT)
10
14
18
22
26
30
Average flux up to Tillering stage
34
38
42
46
50
Average flux up to Panicle initiation stage
54
58
62
Average flux up to Reproductive stage
66
70
Average flux up to Ripening stage
74
78
82
Average flux up to Maturity stage
Over all average
T1
(Control with
crop)
0.23
0.76
0.58
0.29
0.76
0.62
0.54
0.57
0.42
1.02
1.28
0.67
0.79
0.65
0.77
0.45
0.62
0.38
0.31
0.35
0.18
0.58
0.39
0.38
0.57
T2
(100%
NPK+GM)
1.12
2.66
2.54
2.23
0.42
0.61
1.60
0.81
1.01
3.31
4.76
2.76
2.53
2.15
2.35
2.34
2.28
1.82
1.12
1.47
1.31
1.4
0.84
1.18
1.87
427
T3
(100%
NPK+GM)
1.33
2.96
2.68
2.70
2.72
2.28
2.45
1.93
1.09
3.87
3.89
2.92
2.74
1.22
2.79
2.71
2.24
2.63
2.31
2.47
1.86
1.64
1.56
1.69
2.37
T4
(100% NPK +
Straw)
1.97
7.36
7.19
7.34
7.10
3.75
5.79
3.41
3.40
4.77
4.66
1.65
3.58
1.63
2.96
2.97
2.52
2.78
2.66
2.72
0.18
0.51
0.56
0.42
3.52
T5
(100% NPK+
Sulphur)
0.56
1.67
1.60
1.50
1.26
1.14
1.29
1.42
1.65
2.07
2.00
1.75
1.78
1.51
1.56
1.35
1.47
1.24
0.65
0.95
0.48
0.6
0.21
0.43
1.27
Int.J.Curr.Microbiol.App.Sci (2017) 6(4): 423-430
428
Int.J.Curr.Microbiol.App.Sci (2017) 6(4): 423-430
At ripening and maturity the higher nitrous
oxide emission in green manure and FYM
treated plots is mainly due to the availability
of more mineralized nitrogen after the
decomposition of this organic amendment.
However, at maturity stage the nitrous oxide
emission in straw treated plot is mainly
because of exhaustion of nitrogen provided by
the straw to the soil. The result showed that
nitrous oxide emission was strongly
influenced by application of chemical
fertilizers (Chen et al., 2002). Seasonal
average fluxes of N2O varied between 0.03
mg N2O-N m−2 d−1 under continuous flooding
and 5.23 mg N2O-N m−2 d−1 under the water
regime of F-D-F-M. Both crop residueinduced CH4, ranging from 9 to 15% of the
incorporated residue C, and N2O, ranging
from 0.01 to 1.78% of the applied N, were
dependent on water regime in rice paddies.
Estimations of net global warming potentials
(GWPs) indicate that water management by
flooding with midseason drainage and
frequent water logging without the use of
organic amendments is an effective option for
mitigating the combined climatic impacts
from CH4 and N2O in paddy rice production
(Zou et al., 2005). The nitrous oxide fluxes
were higher during initiation period of crop
growth the availability of mineral nitrogen
was high. Then, there was a decrease in fluxes
during late tillering stage and early panicle
initiation stage. The nitrous oxide fluxes
increase again when the top dressing of split
dose of fertilizers was done. The nitrous oxide
emission was reduced by use of sulphurus
fertilizers. This was also reported by (Bufogle
et al., 1998). The results also indicated that
nitrous oxide emission was enhanced
undecomposed organic amendment (straw
and green manure) as compared to welldecomposed organic amendment (farmyard
manure) and sulphurus fertilizers. The
additions of split doses of nitrogen also
influenced the nitrous oxide emission.
Therefore, the timing of nitrogen application
should match the periods when plant
requirement of nitrogen is highest. The midseason drainage and the multiple drainage,
with 6.9% and 11.4% reduction in rice yield
respectively, had an average methane
emission per crop 27% and 35% lower when
compared to the local method. Draining with
fewer drain days during the flowering period
was recommended as a compromise between
emissions and yield. The field drainage can be
used as an option to reduce methane and
nitrous oxide emissions from rice fields with
acceptable yield reduction. Mid-season
drainage during the rice flowering period,
with a shortened drainage period (3 days), is
suggested as a compromise between the need
to reduce global warming and current socioeconomic realities (Touprayoon et al., 2005).
Acknowledgement
The authors are thankful to the Head,
Department of Agromateorology, G.B. pant
University of Agriculture and Technology,
Pantnagar, Uttarakhand for providing
necessary facilities to conduct this research
work.
References
Bufogle, A., Bollich, P.K., Kovar, J.L.,
Lindau, C.W. and Macchiavellied, R.E.
1998. Comparison of Ammonium
sulphate and urea as nitrogen sources in
rice production. J. Plant Nutr., 21(8):
1601-1614.
Chen, X., Cabrera, M.L., Zhang, L., Wu, J.,
Shi, X., Yu, W.T. and Shen, S.M. 2002.
Nitrous oxide emission from upland
crops soil systems in northeastern
China. Nutr. Cyc. Agro Eco., 62(3):
241-247.
Hutchinson, G.L. and Mosier, A.R. 1981.
Improved soil cover method for
measurement of Nitrous oxide flux. Soil
sci. Soc. Amer. J., 45: 311-316.
429
Int.J.Curr.Microbiol.App.Sci (2017) 6(4): 423-430
IPCC. Climate change 2001. The scientist
basis. Contribution of working Group I
to the Third Assessment Report of the
Inter-governmental panel on Climate
Change. Cambridge University press
Cambridge.
Mitra, S., Jain, M.C., Kumarm, S.,
Bandyopadhyay, S.K., and Kalra, N.
1999. "Effect of rice culticars on
methane emission". Agri. Eco. Env., 73:
177-183.
Robertson, G.P and J.M. Tiedje. 1987.
Nitrous oxide sources in aerobic soil:
Nitrification, denitrification and other
biological processes. Soil Bio. and
Bioche., 19: 187-193.
Tortoso, A.C. and G.L. Hutchinson. 1990.
Contributions of autotrophic and
heterotrophic nitrifiers to soil NO and
N2O emissions. Applied Env. Micro.,
56: 1799-1805.
Towprayoon, S., Smakgahn, K. and
Poonkaew, S. 2005. Mitigation of
methane and nitrous oxide emissions
from drained irrigated rice fields.
Chemosphere, 59(11): 1547-1556.
Zou, Jianwen, Huang, Yao, Jiang, Jingyan,
Zheng, Xunhua and Sass, Ronald L.
2005. A 3-year field measurement of
methane and nitrous oxide emissions
from ricpaddies in China: Effects of
water regime, crop residue, and
fertilizer
application.
Global
Biogeochemica Cycles, 19: 2.
How to cite this article:
Singh, P.P., Rashmi Pawar and Meena, R. 2017. A Study of Nitrous oxide Emission from Rice
Fields in Tarai Region of Uttarakhand, India. Int.J.Curr.Microbiol.App.Sci. 6(4): 423-430.
doi: />
430