A novel approach to monitoring the efficacy of anti-tumor treatments in animal models: Combining functional MRI and texture analysis
Bạn đang xem bản rút gọn của tài liệu. Xem và tải ngay bản đầy đủ của tài liệu tại đây (7.39 MB, 12 trang )
Meng et al. BMC Cancer (2018) 18:833
/>
RESEARCH ARTICLE
Open Access
A novel approach to monitoring the
efficacy of anti-tumor treatments in animal
models: combining functional MRI and
texture analysis
Ming Meng1, Huadan Xue1, Jing Lei1, Qin Wang1, Jingjuan Liu1, Yuan Li1, Ting Sun1, Haiyan Xu2 and Zhengyu Jin1*
Abstract
Background: The aim of this study was to evaluate the early anti-tumor efficiency of different therapeutic agents
with a combination of multi-b-value DWI, DCE-MRI and texture analysis.
Methods: Eighteen 4 T1 homograft tumor models were divided into control, paclitaxel monotherapy and paclitaxel
and bevacizumab combination therapy groups (n = 6) that underwent multi-b-value DWI, DCE-MRI and texture
analysis before and 15 days after treatment.
Results: After treatment, the tumors in the control group were significantly larger than those in the combination
group (P = 0.018). In multi-b-value DWI, the ADCslow obviously increased in the combination group compared to
that in the others (P < 0.01). The f increased in the control and paclitaxel groups, but the combination group
showed a significant decrease versus the others (P < 0.02). Additionally, in DCE-MRI, the decreasing Ktrans showed an
evident difference between the combination and control groups (P = 0.003) due to the latter’s increasing Ktrans. The
intra-group comparisons of tumor texture in pre-, mid- and post-treatments showed that the entropy had all
significantly increased in all groups (P < 0.01, SSF = 0–6), though the MPP, mean and SD increased only in the
combination group (PMPP,mean,SD < 0.05, SSF = 4–6). Moreover, the inter-group comparisons revealed that the mean
and MPP exhibited significant differences after treatment (Pmean,MPP < 0.05, SSF = 0–3).
Conclusion: All these results suggest some strong correlations among DWI, DCE and texture analysis, which are
beneficial for further study and clinical research.
Keywords: Breast cancer, Neoadjuvant chemotherapy, Functional MRI, Texture analysis, Multiparameter imaging
Background
Functional magnetic resonance imaging (fMRI) has grown
very rapidly because it provides non-invasive and accurate
imaging, especially its ability to discriminate tissue characteristics. Furthermore, using the characteristics of lesions,
fMRI provides real-time and non-destructive measurements of pathological processes in vivo for early diagnosis
and therapy evaluation. The two types of novel fMRI scanning techniques, multi-b-value diffusion-weighted imaging
* Correspondence:
1
Department of Radiology, Chinese Academy of Medical Sciences & Peking
Union Medical College, Peking Union Medical College Hospital, No.1
Shuaifuyuan, Dongcheng District, Beijing 100730, China
Full list of author information is available at the end of the article
(DWI) and dynamic contrast-enhanced MRI (DCE-MRI),
can potentially detect major diseases such as breast cancer.
In general, DCE-MRI has shown high sensitivity in the detection of breast cancer (89–100%) and DWI has shown
utility in predicting proper therapeutic regimens and monitoring responses to treatments [1]. Intra-tumoral vascular
heterogeneity is essential for tumor treatments. Accordingly, antiangiogenic therapy is considered a highly promising new strategy to prevent tumor growth and metastasis.
These two functional MRI techniques are able to measure
the microvascular structure and reflect its permeability [2].
Several qualitative and semiquantitative parameters of
DCE-MRI, ranging from simple semiquantitative inspection
of the time-intensity curves to more sophisticated tracer
© The Author(s). 2018 Open Access This article is distributed under the terms of the Creative Commons Attribution 4.0
International License ( which permits unrestricted use, distribution, and
reproduction in any medium, provided you give appropriate credit to the original author(s) and the source, provide a link to
the Creative Commons license, and indicate if changes were made. The Creative Commons Public Domain Dedication waiver
( applies to the data made available in this article, unless otherwise stated.
Meng et al. BMC Cancer (2018) 18:833
kinetics modeling, can provide information on vascular permeability within the tumor [3]. Additionally, the values of
apparent diffusion coefficient (ADC), which are based on
the relative signal intensity change of the tumor tissue with
increasing b values in multi-b-value DWI, can provide
microstructural information at the cellular level. The
changes in the ADC values correlated inversely with the tissue and cell densities [4, 5]. Therefore, these two imaging
methods can potentially be used to monitor and evaluate
the therapeutic effects of antiangiogenic therapy in the early
stages of treatment.
Recent clinical studies show that bevacizumab, a genetically engineered humanized monoclonal antibody, is very efficient in curing various tumors because of its anti-VEGF
activity. Bevacizumab can specifically combine with VEGF
and impede the binding of VEGF to VEGFR to inhibit new
vascular formation and suppress tumor growth with low
toxicity [6]. As a control, another commonly used chemotherapeutic agent, paclitaxel, can bind to β-tubulin and
stabilize the microtubules to restrain cell mitosis and inhibit
cell proliferation [7]. As noted above, a promising approach
would be to use multi-b-value DWI and DCE-MRI in combination to appraise the anti-angiogenic activity of bevacizumab compared with that of paclitaxel.
To ensure the accuracy of our research, we adopted an
alternative new technique, texture analysis, to analyze and
verify the imaging results. As a new imaging biomarker introduced in oncologic imaging, texture analysis can quantify the regional heterogeneity of a tumor, which is a
recognized feature of malignancy and is associated with
aggressive biology, inferior prognosis and treatment resistance [8]. Therefore, this image processing algorithm can
be used to scan for subtle intra-tumoral anomalies by
assessing the distribution of texture coarseness. The important texture parameters, including mean intensity,
standard deviation of the gray-level histogram distribution, entropy (irregularity of gray-level distribution), skewness (asymmetry of the histogram), and kurtosis (flatness
of the histogram) can reflect diverse information ranging
from anatomical structure to biological function [9]. Previous studies have shown that compared to other imaging
and biological parameters, coarse texture features may reflect the underlying vasculature as defined by CD34 [10].
According to this research, it is of value to perform texture analysis on the functional MRI findings and evaluate
the correlation between the results.
Methods
Animal models
All animal experiments and relevant details were conducted
in accordance with the approved guidelines and were
approved by the committee on Animal Care and Use of
Peking Union Medical College Hospital, Chinese Academy
of Medical Sciences & Peking Union Medical College.
Page 2 of 12
Balb/c-nu mice (female, 6 weeks old, approximately
20 g body weight) were purchased from the Beijing Vital
River Laboratory Animal Technology Co., Ltd. (Beijing,
China). The mice were maintained on sterilized food
and water. The murine breast cancer cell line 4 T1 was
obtained from the Cell Bank of the Chinese Academy of
Science (Beijing, China) and maintained in Dulbecco’s
minimum essential medium (DMEM) supplemented
with 10% fetal bovine serum, penicillin (100 units/ml)
and streptomycin (100 units/ml) and incubated at 37 °C
in a 5% CO2 air environment. The breast tumors in the
Balb/c-nu mice were established by subcutaneous inoculation with 3.5 × 10⁶ 4 T1 cells in 400 μl PBS.
Treatment
The therapy was initiated after the tumors reached approximately 150 mm3 in volume. Then, these 4 T1 breast
tumor homograft-bearing mice were randomized into
three groups: control, paclitaxel monotherapy and combination therapy with antiangiogenic bevacizumab (Avastin, Roche, Switzerland) and paclitaxel. All of the mice
were treated with intraperitoneal injections every three
days. Sterile saline was used in the control group with a
volume of 100 μl, and a dose of 10 mg/kg was used in the
paclitaxel monotherapy group. In the combination therapy
group, the mice were treated with the same dose of
10 mg/kg each [11]. The whole treatment process lasted
for 15 days. This study included 18 mice carrying breast
tumor homografts. All of the mice were scanned immediately prior to the treatment and 15 days after the initiation
of the treatment. All the mice were sacrificed by cervical
dislocation after the last scanning procedure. The tumor
tissues from these three groups were subjected to histopathological analyses of vascularization.
MRI protocol
All MRI examinations were performed on a GE Discovery
MR750 3.0 T horizontal bore superconducting magnet
coupled with a 35 mm diameter small animal coil (GE,
Waukesha, USA). The animals were anesthetized by an intraperitoneal injection of 1% pentobarbital sodium with a
volume of 150 μl. Heartbeats and respiration rates were
monitored during the experimentation. The image acquisition included the routine T2WI, multi-b-value DWI and
DCE-MRI. Multi-b-value DWI was acquired with 11-grade
b values using a spin-echo sequence (0, 20, 50, 100, 200,
400, 600, 800, 1000, 1200, 1500 s/mm2, TR = 2500 ms, TE
= 78 ms, FOV = 50 mm, matrix 64 × 64, slice thickness
1 mm, 11 slices). The DCE-MRI was followed by a
200-phase dynamic series of T1WI 2D FSPGR images with
identical geometry and a temporal resolution of 3 s. To acquire a full range of images, all tumors were imaged with
five coronal slices. Other DCE-MRI parameters were included as follows: TR = 9.7 ms, TE = 3.7 ms, FOV = 50 mm,
Meng et al. BMC Cancer (2018) 18:833
matrix 192 × 96, flip angle 30°, slice thickness 2 mm. An
intravenous bolus dose of 0.1 mmol/kg of Gd-DTPA was
given after the 10th baseline data point through a catheterized tail vein tube.
The relevant parameters were measured after MRI examinations. ADCslow (pure molecular diffusion), ADCfast
(perfusion-related diffusion), and f (perfusion fraction)
were obtained from a bi-exponential IVIM model of
multi-b-value DWI. Pharmacokinetic parameters of CER
(contrast enhancement ratio), Ktrans (transfer rate constant), Kep (reverse rate constant), Ve (extravascular
extracellular volume fraction), fPV (fraction of plasma
volume) and AUC90 (area under curve 90 s) were obtained from a two-compartment model of DCE-MRI.
Texture analysis
Page 3 of 12
staining was performed using rabbit anti-CD31 antibody
(ab28364; Abcam, Cambridge, UK), rabbit anti-CD34 antibody (ab81289; Abcam) and rabbit anti-VEGF antibody
(ab52917; Abcam). All the antibodies were diluted with tris
buffered saline (TBS), which contains 1% bovine serum albumin (BSA). Based on these tests, the microvessel density
(MVD) in these homografts was calculated.
Statistical analysis
Quantitative parameters as described above were acquired from the functional MRI and analyzed in SPSS
20.0. The data under paclitaxel monotherapy and combination therapy were compared with the control condition by an analysis of variance. The correlations between
MRI parameters and pathological features data were analyzed by linear regression.
Differences in the textural feature values before and
after treatment within the control group, the paclitaxel
monotherapy group and the combination therapy group
were tested using the Mann-Whitney U test [15].
All of the tests were two-tailed. P values less than 0.05
were considered statistically significant.
The texture parameters were obtained using the advanced
research software algorithm TexRAD, an image-histogram
technique invented at the University of Sussex (United
Kingdom). From the axial T2 weighted images of all animals, the regions of interest (ROIs) were defined as the
tumor outline in the largest cross-sectional images performed by an experienced radiologist (8 years of experience
in imaging analysis) with manual delineation [12]. The ROI
areas were selected with different spatial scale filter (SSF)
values from 0 to 6 mm to extract MR texture features. SSFs
of 0 and 2 reflect fine texture scales; SSFs of 3, 4, and 5 reflect medium texture scales; and an SSF of 6 reflects a
coarse texture scale. The heterogeneity of these tissues was
indicated by the following histogram parameters: mean intensity (the average value of all pixels in ROI), SD (the degree of dispersion between pixels and mean value in ROI.
A high SD indicates that the data points are spread out over
a large range of values.), entropy (irregularity of pixel intensity distribution in ROI), mean value of positive pixels
(MPP, the average value of all the pixels that greater than
zero), kurtosis (a measure of peakedness and tailedness of
the histogram. The positive kurtosis means a histogram
that is more peaked than a Gaussian (normal) distribution.),
and skewness (a measure of asymmetry of the histogram.
The positive skew means that the tail on the right side is
longer than the left side, otherwise, the reverse.) [9, 13].
These quantitative parameters were associated with tumor
histological features, such as blood and oxygen supply, necrosis, and fibrosis [14].
The baseline tumor volumes in the control, paclitaxel
monotherapy and combination therapy groups were
192.4 ± 47.7 mm3, 263.7 ± 82.8 mm3 and 195.3 ±
85.2 mm3, respectively, with no significant differences
(P = 0.26). Similarly, the growth of 4 T1-tumors in these
three groups showed no conspicuous differences on day 7
after therapy (control, paclitaxel, paclitaxel with bevacizumab: 156.5 ± 48.7%, 119.3 ± 42.0% and 118.7 ± 48.0%, respectively; P = 0.60). However, after 15 days of therapy, the
measurement results showed that tumors in the control
group were significantly larger than in the combination
therapy group. The tumor volumes reached 652.5 ±
142.8 mm3 with no therapy, and the tumor volumes
reached only 416.2 ± 157.5 mm3 with paclitaxel and bevacizumab conjoint therapy (P = 0.018). The mean volume
of the paclitaxel group was 521.2 ± 129.0 mm3. Accordingly, no obvious difference was found between the control and the paclitaxel monotherapy groups (P = 0.177)
and the distinction between the two treatment groups was
less intuitive (P = 0.055) (Fig. 1).
Histopathology
DWI results
All of the animals were euthanized after the last MRI examination. Then, the tumors were separated and the tissues
were fixed by 10% formalin. Paraffin sections (2 mm thick)
were acquired from the 4 T1 breast tumors. In addition,
hematoxylin and eosin staining and immunohistochemical
staining of CD31, CD34 and VEGF tests were performed to
evaluate the neovasculature. The immunohistochemical
The multi-b-value diffusion-weighted imaging (DWI) after
all the treatments showed increasing trends of the
ADCslow value in these three groups, especially a distinct
increase in the combination therapy group (control: 42.17
± 19.0%, paclitaxel: 53.74 ± 24.16%, combined treatment
group: 118.84 ± 47.59%, P = 0.002). There was a significant
difference between the control and the combination
Results
Tumor size measurements
Meng et al. BMC Cancer (2018) 18:833
Page 4 of 12
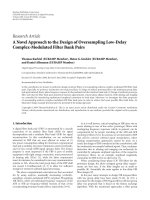
Fig. 1 The tumor growth trends in the three groups. a The axial T2WI images of pre-treatment and after 7- and 15-day treatment with different
therapies. The tumors became larger in the whole process and grew most quickly in the control group, which caused the surrounding organs to
be constricted severely at the end of this trial. However, the combination group showed the slowest growth and the tumors remained relatively
small and shallow in the late phases of treatment. The growth rate in the paclitaxel group was somewhere in the middle. b The percentage
change of the tumor volume. The tumors exhibited nearly linear growth in the control group. There was no significant difference among the
three groups on day 7 after therapy (P = 0.60). However, at the end of treatment, tumor growth was obviously suppressed by paclitaxel with
bevacizumab combined therapy compared to the control group on day 15 (P = 0.018)
treatment groups (P = 0.001), and the same difference was
reflected in the two therapeutic groups (P = 0.008). Regrettably, no conspicuous difference was found between the
control and the paclitaxel monotherapy groups
(P = 0.269). Even more remarkably, the perfusion fraction
(f) values showed the opposite behavior. Growth trends in
f values were observed in the control and paclitaxel
groups (control: 36.72 ± 17.47%; paclitaxel: 52.24 ±
36.35%), but the bevacizumab and paclitaxel combination
group showed a decrease (− 25.12 ± 47.39%) on day 15
after the initiation of therapy. These variable trends caused
remarkable distinctions among the three groups
(P = 0.010). Meanwhile, the statistical differences between
the control and combination therapy groups, as well as
between the two therapeutic groups, were highly significant (P = 0.013, P = 0.005, respectively). There was no significant difference in the f values between the control and
the paclitaxel monotherapy groups (P = 0.671) (Fig. 2).
DCE-MRI results
A comparative analysis of the DCE-MRI results before and
after anti-tumor therapy in the three groups exhibited significant differences. The transfer rate constant (Ktrans) values
in the two therapeutic groups showed a significant decrease,
but the control group showed an increase (paclitaxel:-28.8 ±
20.3%; combined treatment group: − 55.42 ± 30.43%; control:
127.37 ± 76.7%; P = 0.016) on day 15 after treatment. Accordingly, the statistical results were very similar to the DWI
findings. There were significant differences between the control and combination treatment groups (P = 0.003) or between the two therapeutic groups (P = 0.044). No significant
difference was detected in the Ktrans values between the control and the paclitaxel monotherapy groups (P = 0.219). Furthermore, there were no significant differences in the other
parameters among the three groups (Fig. 3).
Texture analysis results
The analysis of tumor texture in pre-, mid- and
post-treatment in these three groups to examine microstructural changes and therapy response revealed that the
entropy values were continuously increasing with or without therapy in the three groups and that all the changes
had statistical significance within the groups (P < 0.01 under
all the SSF values from 0 to 6 mm). In addition, the MPP,
mean intensity and SD values showed the same increasing
tendency only in the combination therapy group for
medium and coarse features (SSF = 4, 5, 6). These differences were statistically significant (PMPP < 0.05, Pmean
< 0.05, PSD < 0.03, respectively) (Table 1).
There were no differences in the mean, SD, entropy or
MPP among the three groups before treatment. With
the implementation of various handling measures, compared to pre-therapy, the mean and the MPP values
under fine and medium features using SSFs of 0, 2 and
3 mm demonstrated significant differences among the
different groups at post-treatment (Pmean < 0.05 and
PMPP < 0.05). However, changes in the other parameters
were not remarkable (Table 2).
Immunohistochemistry results
The histological analysis of the 4 T1 allograft tumors
showed that the combined treatment caused significant
Meng et al. BMC Cancer (2018) 18:833
Page 5 of 12
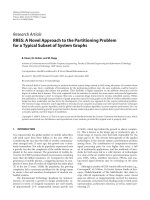
Fig. 2 The multi-b-value DWI results in the three groups. a The DWI and ADC map of pre-treatment and after 7- and 15-day treatment
with different therapies. The subcutaneous tumor (white arrow) was implanted near the bladder (red arrow). As seen from the ADC map,
water molecular diffusion was much lower in the tumors (blue) than in the bladder (red). The tumor region always showed lower
diffusion in the control group. However, after 7 days of anti-tumor therapies, the limitations of water diffusion improved in both the
paclitaxel and the combination groups (the tumor central areas showed a slightly higher green signal). Furthermore, this improvement
was more obvious in the combination group after 15 days of treatment. Meanwhile, marked diversities were observed in ADCslow (b)
and perfusion fraction (f) (c) among the three groups before and after treatment. The changing tendencies were derived from ANOVA,
which reflected the variations after 15 days of treatment according to their own separate patterns
tumor suppression and CD31 immunostaining had a
higher specificity for new vessels than CD34. The quantitative analysis of microvessel density (MVD) was
assessed by CD31 and revealed an obvious decrease in
the combination therapy group after 15 days of treatment, which was in sharp contrast to the other two
groups (combined treat group: − 17.61 ± 23.16% vs. control: 31.39 ± 30.41% vs. paclitaxel: 30.12 ± 27.65%). These
detection results also had significant statistical differences (combination therapy vs. control/paclitaxel: P =
0.007/P = 0.006). Moreover, the same changing trends in
MVD in the control and paclitaxel monotherapy groups
did not cause significant differences (P = 0.907).
The average optical density of VEGF also showed the
same changes among these groups. Through the combined treatment with bevacizumab and paclitaxel, the
VEGF average optical density decreased (− 13.50 ±
57.25%), but the control and paclitaxel monotherapy
groups exhibited increases (14.20 ± 44.41%, 27.50 ±
96.19%, respectively) (Fig. 4).
Correlation analysis results
To further clarify our research, an association study
was performed with the above results. This analysis
involved comparisons of MVD versus DWI/DCE-MRI,
DWI versus DCE-MRI, and texture analysis versus
DWI/DCE-MRI. The correlation coefficient ‘r’ of the
percentage change of MVD versus Ktrans was 0.612
(P = 0.012), that of MVD versus ADCslow was − 0.810
(P = 0.001), that of MVD versus perfusion fraction (f )
was 0.580 (P = 0.019), that of Kep versus ADCfast was
− 0.593 (P = 0.016), that of ADCslow versus entropy
was − 0.503 (P = 0.047), and that of ADCslow versus
MPP was 0.603 (P = 0.013). In addition, MVD was
Meng et al. BMC Cancer (2018) 18:833
Page 6 of 12
Fig. 3 The DCE-MRI results in the three groups. a The Ktrans maps derived from DCE-MRI on pre-treatment and after 15-day treatment in the
three groups. As shown in the pictures, the blood supplies of the tumor margins were more abundant (red/green) than the central parts (blue)
before treatment. Nevertheless, some differences emerged over 15 days of handling. The blood supply was more adequate in the control group,
and the other two groups appeared to have nearly opposite distribution tendencies, especially the combination group. The quantitative analysis
results further confirmed these changes and showed striking differences in Ktransb among the three groups before and after treatment. The
changing tendencies were also derived from ANOVA
positively correlated with the expression of VEGF
(r = 0.563, P = 0.023) (Fig. 5).
Discussion
In this study, we aimed to develop a practical approach
to assessing the efficacy of early anti-tumor therapy. Previous studies have shown that angiogenesis can provide
nutrition and oxygen to the tumor and thus plays a vital
role in tumor progression [16]. Tumors grow exponentially when there is a blood vessel involvement, but they
grow slowly and linearly in an avascular environment
[17]. Therefore, anti-angiogenesis has an irreplaceable
function in oncotherapy, and the antineoplastic agents
that target tumor angiogenesis have become a hot research topic in recent years. As the first drug to be approved by the FDA to inhibit tumor angiogenesis,
bevacizumab is well known for its high affinity in blocking angiogenesis induced by VEGF, which can induce
the proliferation and migration of endothelial cells and
increase the permeability of the microvasculature [18].
Normally, the gold standard for evaluating whether a
drug is successful in inhibiting tumor angiogenesis is the
MVD count. However, it is almost impossible to continuously remove tumor tissue from patients to observe
the real-time efficacy of anti-angiogenesis therapy by calculating the microvessel density in clinical practice. It is
encouraging that our study confirms that this problem
can be solved by a new multi-parameter fusion analysis.
In this preclinical study, we found that many important imaging parameters were sensitive to different
treatments. After the addition of bevacizumab, the
changes in functional MRI and the texture analysis in
the combination therapy group were very significant
and caused a difference in tumor volume compared to
that in the other groups. DWI has great advantages in
reflecting the microstructure of tissues (high b-value)
and the blood perfusion status (low b-value), especially
its crucial parameter ADC [19, 20]. Therefore, if a
treatment works, the cellular integrity will be disrupted, then the ADCslow value, drawn from high
b-value DWI, will rise due to the enhancement of
water diffusion [21], which is supported by our research findings. With the occurrence of necrosis in
tumor central positions, the ADCslow value slightly increased without any therapy in the control group.
However, when angiogenesis is blocked by bevacizumab, the nutrients needed for tumor growth would be
insufficient and the resulting decrease in cell density
would lead to a substantial increase in ADCslow values.
At the same time, the experimental data show that the
inhibition of cell mitosis by paclitaxel induced cell
density reductions that were inferior to bevacizumab,
but the increase in ADCslow was similar to the control
group. Additionally, the f value assessed blood perfusion directly and showed significant differences in low
b-value DWI between the groups. The results
SD
entropy
1195.15 ±
808.31
2075.70 ±
815.16
2589.17 ±
737.94
2982.66 ±
619.22
3390.92 ±
537.48
2
3
4
5
6
1161.66 ±
396.02
1321.09 ±
420.85
1449.94 ±
405.76
1379.17 ±
426.13
1056.11 ±
345.60
289.54 ± 24.82
6.50 ±
0.31
6.51 ±
0.31
6.52 ±
0.32
6.53 ±
0.30
6.48 ±
0.32
6.12 ±
0.18
1506.90 ±
971.82
2180.45 ±
944.57
2703.43 ±
918.57
3076.44 ±
1148.06
3383.79 ±
901.65
2
3
4
5
6
1256.03 ±
624.43
1401.55 ±
733.68
1423.35 ±
694.75
1243.56 ±
484.91
1098.25 ±
196.70
294.36 ± 31.16
6.64 ±
0.21
6.65 ±
0.21
6.66 ±
0.24
6.65 ±
0.21
6.65 ±
0.16
6.20 ±
0.07
3405.85 ±
715.29
3157.93 ±
794.39
2862.68 ±
929.52
2413.68 ±
750.85
1775.18 ±
729.63
1792.59 ±
269.74
3390.92 ±
537.48
3037.58 ±
567.00
2758.20 ±
605.26
2266.05 ±
692.00
1579.19 ±
425.70
1725.70 ±
139.32
MPP
1433.12 ±
720.31
2448.26 ±
419.37
3011.07 ±
359.31
3355.47 ±
524.72
3678.70 ±
683.91
2
3
4
5
6
“*“means P < 0.05
1806.38 ±
205.10
0
1115.19 ±
538.41
1295.85 ±
608.95
1471.26 ±
652.16
1599.97 ±
672.77
1311.13 ±
379.57
312.10 ± 66.52
6.40 ±
0.29
6.40 ±
0.32
6.42 ±
0.29
6.46 ±
0.26
6.43 ±
0.24
6.10 ±
0.20
3680.00 ±
685.25
3395.32 ±
561.31
3154.51 ±
477.70
2821.10 ±
506.02
1894.66 ±
453.57
1806.38 ±
205.10
C. Texture parameters in the combination therapy group
1792.59 ±
269.74
0
B. Texture parameters in the paclitaxel group
1725.70 ±
139.32
0
A. Texture parameters in the control group
mean
SSF Pre-treatment
3136.03 ±
593.59
2965.52 ±
528.24
2785.42 ±
425.84
2488.27 ±
377.97
1854.46 ±
321.90
1678.27 ±
95.64
3396.54 ±
717.25
3063.26 ±
529.59
2668.49 ±
298.86
2140.12 ±
281.63
1425.57 ±
422.54
1720.35 ±
154.36
2816.54 ±
544.16
2304.45 ±
604.56
1816.10 ±
679.22
1331.32 ±
712.57
817.32 ±
638.70
1599.25 ±
90.58
mean
Mid-treatment
763.13 ±
151.67
811.48 ±
135.21
892.06 ±
122.07
1012.94 ±
139.51
955.21 ±
131.04
312.68 ± 59.26
1057.56 ±
423.29
1103.85 ±
390.31
6.99 ±
0.19
6.97 ±
0.16
7.04 ±
0.13
7.09 ±
0.12
7.07 ±
0.14
6.43 ±
0.15
7.27 ±
0.31
7.28 ±
0.30
7.31 ±
0.24
7.32 ±
0.25
1116.57 ±
234.65
1093.71 ±
243.84
7.34 ±
0.26
6.57 ±
0.17
7.21 ±
0.13
7.23 ±
0.12
7.22 ±
0.07
7.21 ±
0.08
7.22 ±
0.11
6.55 ±
0.07
entropy
1195.67 ±
413.08
319.42 ± 95.00
1289.99 ±
452.01
1317.59 ±
488.49
1243.09 ±
352.48
1111.32 ±
122.70
1138.52 ±
313.80
311.06 ± 29.68
SD
3136.03 ±
593.58
2965.52 ±
528.24
2788.44 ±
422.44
2504.52 ±
373.95
1927.35 ±
338.02
1678.27 ±
95.64
3396.54 ±
717.25
3075.22 ±
541.38
2681.39 ±
299.52
2226.54 ±
155.82
1799.71 ±
207.05
1720.35 ±
154.36
2883.07 ±
518.08
2556.24 ±
476.15
2121.33 ±
504.72
1649.98 ±
518.25
1373.25 ±
305.27
1599.25 ±
90.58
MPP
4154.52 ±
361.67
3867.23 ±
421.55
3433.14 ±
429.29
2791.28 ±
384.04
1910.08 ±
315.32
1884.06 ±
121.01
3718.2 ±
673.68
3509.64 ±
706.55
3136.81 ±
686.17
2542.73 ±
582.90
1732.09 ±
387.71
1723.30 ±
132.64
3444.29 ±
569.76
3032.57 ±
522.03
2524.37 ±
430.15
1955.66 ±
266.91
1351.10 ±
94.28
1658.22 ±
148.93
mean
Post-treatment
entropy
7.56 ±
0.11
7.51 ±
0.15
7.51 ±
0.12
7.49 ±
0.13
7.53 ±
0.10
7.58 ±
0.29
7.59 ±
0.26
7.56 ±
0.23
7.52 ±
0.22
7.55 ±
0.26
1163.57 ±
163.15
1251.75 ±
188.81
1308.58 ±
164.02
1334.57 ±
134.55
1212.64 ±
200.58
7.42 ±
0.17
7.43 ±
0.17
7.46 ±
0.16
7.48 ±
0.16
7.45 ±
0.15
375.78 ± 41.57 6.68 ±
0.11
1204.06 ±
274.35
1268.90 ±
275.16
1184.75 ±
233.59
1054.99 ±
156.52
1072.68 ±
138.56
343.89 ± 33.77 6.71 ±
0.08
1108.20 ±
113.03
1072.23 ±
139.86
987.92 ±
144.55
962.22 ±
103.47
1028.40 ±
141.74
341.60 ± 39.17 6.74 ±
0.05
SD
Table 1 The intra-group comparisons of texture parameters in the control, paclitaxel and combination therapy groups
4154.52 ±
361.67
3867.23 ±
421.55
3446.67 ±
417.53
2893.49 ±
361.47
2081.77 ±
351.62
1884.06 ±
121.01
3718.2 ±
673.68
3513.13 ±
703.86
3145.29 ±
677.08
2557.25 ±
575.12
1867.67 ±
304.82
1723.30 ±
132.64
3444.29 ±
569.76
3032.57 ±
522.03
2533.12 ±
419.03
1997.08 ±
237.50
1537.98 ±
79.00
1658.22 ±
148.93
MPP
P value
0.002*
0.002*
0.001*
0.001*
0.005*
0.005*
0.005*
0.006*
0.008*
0.005*
0.002*
0.003*
0.002*
0.030* 0.001*
0.064
0.143
0.878
0.691
0.651
0.914
0.932
0.185
0.733
0.403
0.179
0.045* 0.024* 0.001*
0.025* 0.023* 0.001*
0.045*
0.034*
0.050
0.164
0.630
0.055
0.691
0.482
0.566
0.914
0.970
0.970
0.164
0.185
0.230
0.196
0.677
0.330
entropy MPP
0.031* 0.002*
0.733
0.105
SD
0.029* 0.019* 0.001*
0.318
0.368
0.055
0.691
0.566
0.595
0.619
0.595
0.970
0.134
0.141
0.228
0.196
0.651
0.330
mean
Meng et al. BMC Cancer (2018) 18:833
Page 7 of 12
Meng et al. BMC Cancer (2018) 18:833
Page 8 of 12
Table 2 Comparisons among the three groups pre-, mid- and post-treatment
SSF
Pre-treatment (P value)
Mid-treatment (P value)
Post-treatment (P value)
mean
SD
entropy
MPP
mean
SD
entropy
MPP
mean
SD
entropy
MPP
0
0.892
0.283
0.524
0.892
0.326
0.817
0.419
0.326
0.049*
0.315
0.389
0.049*
2
0.863
0.526
0.336
0.574
0.031*
0.651
0.110
0.049*
0.110
0.264
0.263
0.041*
3
0.673
0.724
0.518
0.342
0.026*
0.649
0.099
0.043*
0.056
0.068
0.925
0.049*
4
0.621
0.975
0.328
0.574
0.060
0.124
0.057
0.080
0.056
0.077
0.473
0.056
5
0.692
0.975
0.369
0.557
0.127
0.199
0.065
0.194
0.098
0.182
0.480
0.098
6
0.557
0.924
0.357
0.557
0.326
0.173
0.131
0.392
0.338
0.422
0.235
0.338
“*“means P < 0.05
contrasted with ADCslow and antiangiogenic therapy
resulted in a significant decrease in the f value 15 days
after therapy initiation, but the other two groups
showed an opposite trend. Moreover, the changes in
the f value exhibited a close association with MVD, but
the changes in ADCslow were strongly negatively correlated with microvessel counts. The very meaningful
relevance of DWI parameters and histological results
are fully consistent with earlier studies showing that
DWI can be used to monitor the early therapeutic effects of vascular targeting agents [22].
DCE-MRI is the most common technique for
non-invasive evaluations of tissue blood perfusion and is
a valid method for monitoring the effectiveness of a variety of treatments by tracking the pharmacokinetics of
Gd-DTPA [23]. The most commonly used parameter to
reflect the vascular permeability and the blood flow rate
and volume is Ktrans. Combined with other parameters,
such as Kep, Ktrans can reflect the degree of angiogenesis
in tumors to a certain extent [24, 25]. Our study showed
that high Ktrans values appeared with the growth of tumors in the control group. This finding is diametrically
Fig. 4 Immunohistochemical results (× 200) with CD31 and VEGF stains of control, paclitaxel- and combination-treated tumors after 15 days of
treatment. The target substances were dyed brownish yellow. Both microvessel density (MVD) assessed by CD31 and the optical density of VEGF
were obviously lower in the combination therapy group than in the other two groups
Meng et al. BMC Cancer (2018) 18:833
Page 9 of 12
Fig. 5 These linear maps can be used to directly reflect the correlation between the various parameters. Significant positive and linear
correlations existed between MVD vs. Ktrans, perfusion fraction (f) and VEGF. However, MVD and ADCslow were negatively correlated. In
addition, ADCslow values were significantly negatively correlated with entropy but positively correlated with MPP. There was also a strong
correlation between the radiographic parameters of multi-b-value DWI and DCE-MRI, such as the inverse relationship between ADCfast and Kep
opposite to the growth situation in the two therapy
groups as the Ktrans values were constantly dropping.
The increase in Ktrans values indicated increases in
tumor blood perfusion and high capillary permeability
that provided more nutrients for tumor growth and ultimately accelerated the proliferation of tumor cells.
During the late phase of the experiment, the subcutaneous tumor volumes in the control group were significantly larger than in the other two groups, providing
good verification for Ktrans. Additionally, the significantly different downward trends in the two therapy
groups were caused by the different mechanisms of
paclitaxel and bevacizumab. Paclitaxel has a definite
anti-tumor effect by inhibiting the microtubule system.
However, some scholars have confirmed that bevacizumab can improve the delivery and efficacy of paclitaxel
[26]. The suppression of angiogenesis and vascular
permeability by bevacizumab ensures the concentration of paclitaxel. The significant changes in volume,
Ktrans and other imaging parameters in the combination group compared to those in the paclitaxel-alone
group and the control group likely occurred because
the duration of therapy was not long enough to cause
an obvious difference between the paclitaxel monotherapy and the control groups. Encouragingly, the
histological results were consistent with DCE-MRI.
The MVD counts showed a strong positive correlation
with Ktrans. Through treatment with bevacizumab, the
expression of VEGF in the combination group was reduced. In recent years, increasing attention has been
given to Kep, and previous studies have shown that a
high baseline value of Kep corresponds to a high exchange fraction of a drug between the plasma and the
extravascular extracellular space (EES), indicating potentially superior therapy efficacy [27]. Most likely, the
individual differences, tumor cell necrosis, and other
factors caused the contrast agent residue in the interstitial space and led to the error in extravascular extracellular osmotic volume, eventually causing the lack of
significant changes in Kep in our study. On the other
hand, Kep is also significantly affected by Ve, which
may be determined by cell density, cystic degeneration
and tissue reaction, etc. According to Tofts [28], Ve is
not a quite stable factor, because it’s often affected by
the edema surrounding the lesion. Nevertheless, when
we analyzed the correlation between DCE-MRI and
DWI, we found that the Kep was negatively related to
ADCfast , which was drawn from low b-value DWI. Because the ADC value in the Double Exponential Model
mainly reflects the tumor density characteristics, the
increase in tumor density will certainly affect the contrast agent rate of return to the plasma from the EES.
Therefore, it can be concluded from the above analysis
that multi-b-value DWI and DCE are complementary
to each other in the assessment of angiogenic function
and tumor perfusion.
Meng et al. BMC Cancer (2018) 18:833
Although multi-b-value DWI and DCE-MRI have
provided considerable information for monitoring
tumor growth and oncological therapy efficacy, these
two imaging techniques can be affected by many factors, such as the inhomogeneity of the tumor tissues,
artifacts resulting from the subcutaneous tumor model
and motion of the animal during the imaging process
[29]. Additionally, the clinical images have some limitations in reflecting the cellular and molecular characteristics of lesions, such as cell proliferation and
metabolism, necrosis and hypoxia [30]. Recently, a
growing number of studies have attempted to clarify
the measurement of heterogeneity in medical images by
textural analysis, a second-order statistical technique
with parameters derived from the distributions of local
features, which may allow better tissue characterization,
image segmentation, and prediction of therapy response
and survival [31, 32]. Therefore, the major advantage of
this potential tool is that it can maximize the information from clinical images without the need for additional acquisitions [9]. This advantage must be fully
exploited in our research. By measuring the unenhanced T2-weighted MRI, we found that all of the allograft tumor-bearing mice were in the same condition
before treatment, but with treatment and various handling, the entropy values increased significantly in the
three groups under all SSFs. Entropy represents the disorder degree of the pixels in ROI, the higher its value
is, the more is the disorder of tissue. A previous publication showed the severity is associated with the degree
of texture coarseness which was correlated with glucose
uptake measures (obtained from FDG-PET, r = 0.51,
P = 0.03) [33]. It is therefore clear that the increasing
glucose metabolism allowed the growth rate of this
4 T1 allograft tumor to increase, which was consistent
with the increasing size of the tumors in all of the mice.
According to Ng et al. [34], the heterogeneity of tumor
tissues increased with growth. According to Ganeshan
et al. [10] and Henriksson et al. [30], the increased
image heterogeneity within tumors may be associated
with differences in regional tumor cellularity, proliferation, hypoxia, angiogenesis and necrosis. Therefore,
through the effects of anti-angiogenesis and inhibition
of cell mitosis by combined therapy with bevacizumab
and paclitaxel, the microstructures of tumor, including
cells, extracellular matrix and microvasculature, would
be disturbed, generating a series of variations on cellular and molecular levels that are too subtle to detect
using traditional imaging diagnostic techniques. The
persistent variations ultimately led to significant differences in the average value of the pixels within the lesions (mean intensity, P < 0.05) and high dispersion
exists around the mean value (SD, P < 0.03). Because of
the absence of strong and effective chemotherapy,
Page 10 of 12
obvious changes did not appear in the other two groups
after treatment. In a nuclear medicine study, the
scholars found that tumors with more heterogeneous
water distribution (i.e., higher SD and mean value of
positive pixels, MPP) were more glycolytic [35]. This
conclusion was also supported by our empirical evidence. When angiogenesis was blocked by bevacizumab, the reduction in tissue perfusion limited the
oxygen supply to the tumor, which led to significant dependence on energy from glycolysis compared with before treatment (PMPP < 0.05). Another finding that
supports this statement is that the changes in the mean,
SD and MPP all occurred in medium and coarse texture scales, which were more inclined to reflect biological characteristics as genomics analyses based on
the investigation by Chowdhury et al. [35]. Furthermore, the above analyses were applicable to the
comparison among the different groups. The discrepancies on cellular and molecular levels, such as
anti-proliferation, hypoxia, angiogenesis and necrosis
induced by monotherapy and combination therapy,
eventually caused the diversities in anatomical structure
(under fine and medium texture scales) that embodied
the dramatic differences in both the average value of
the pixels (mean, P < 0.05) and the positive pixels (MPP,
P < 0.05) within the tumor region. These major structural changes could be observed in traditional imaging
parameters, as described above. As in our study, textural analysis was not independent; it was closely related to functional magnetic resonance imaging.
Entropy was significantly negatively correlated with
ADCslow (r = − 0.503, P < 0.05). A higher entropy represents increased heterogeneity, which signifies the restriction of water diffusion (lower apparent diffusion
coefficient) to some extent. Surprisingly, the increasing
MPP value was remarkably positively correlated with
ADCslow (r = 0.603, P = 0.013), probably because the
more glycolytic environment (higher MPP) produced
metabolites that increased the permeability of the cell
membrane and facilitated the diffusion of water molecules. However, further confirmation is warranted.
Admittedly, there are several limitations in our
study. The vulnerability of six-week-old nude mice
and other factors led to high mortality during the experiment; thus, the animal tumor model was achieved
in a limited number of mice. In addition, the susceptibility artifacts in DWI at air-soft tissue borders in
the subcutaneous tumor model [29], the motion of
animals during the imaging process, and the fact that
implanted tumors are more homogeneous than primary tumors caused inevitable system errors. In further studies, we will strive to overcome these
limitations and explore more diverse, multimodality
fusion imaging methods.
Meng et al. BMC Cancer (2018) 18:833
Conclusion
This study shows successful monitoring of the early
phases of antiangiogenic therapy using multi-b-value
DWI, DCE-MRI and texture analysis in a preclinical
breast cancer model. Through the integration of multiple parameters, DWI, DCE and TexRad provide
comprehensive and valuable information from biological characteristics to anatomic structures. More
encouragingly, the prominent changes in key parameters before and after treatment both have good correlations and consistencies with histological results. The
three imaging and analytic techniques reinforce each
other and may potentially serve as non-invasive biomarkers for the guidance of treatment algorithms and
in monitoring early responses to anti-angiogenesis
therapy in future clinical trials.
Abbreviations
ADC: Apparent diffusion coefficient; AUC90: Area under curve 90s;
CER: Contrast enhancement ratio; DCE-MRI: Dynamic contrast-enhanced MRI;
DMEM: Dulbecco’s minimum essential medium; DWI: Diffusion-weighted
imaging; IVIM: Intravoxel incoherent motion; MPP: Mean value of positive
pixels; MVD: Microvessel density; ROI: Region of interest; SD: Standard
deviation; SSF: Spatial scale filter; VEGF: Vascular endothelial growth factor;
VEGFR: Vascular endothelial growth factor receptor
Acknowledgements
We would like to appreciate everyone at the Department of Radiology,
Peking Union Medical College Hospital, and Department of Biomedical
Engineering, Institute of Basic Medical Sciences, Chinese Academy of
Medical Sciences & Peking Union Medical College for their selfless help
with this study.
Funding
This paper is supported by Key Projects in the National Science &
Technology Pillar Program during the Twelfth Five-year Plan Period
2012BAI23B06, and National Natural Science Foundation of China under
Grant Nos. 81171390 and 81227901. All funding bodies had no role in
the study design, collection, analysis, interpretation of data, and writing
manuscript.
Availability of data and materials
The datasets used and/or analyzed during the current study are available
from the corresponding author on reasonable request.
Authors’ contributions
MM, JL and HX designed the experiments; MM performed the experiments;
MM analyzed the data and wrote the manuscript; QW, JL, YL and TS
contributed materials and analysis tools and performed statistical analysis; HX
and ZJ devised and oversaw the whole study; ZJ contributed to discussions,
interpretation of the data and revision of the manuscript. All authors
reviewed and approved the final manuscript.
Ethics approval and consent to participate
All animal experiments and relevant details were conducted in accordance
with the approved guidelines and were approved by the committee on
Animal Care and Use of Peking Union Medical College Hospital, Chinese
Academy of Medical Sciences & Peking Union Medical College.
Competing interests
The authors declare that they have no competing interest.
Publisher’s Note
Springer Nature remains neutral with regard to jurisdictional claims in
published maps and institutional affiliations.
Page 11 of 12
Author details
1
Department of Radiology, Chinese Academy of Medical Sciences & Peking
Union Medical College, Peking Union Medical College Hospital, No.1
Shuaifuyuan, Dongcheng District, Beijing 100730, China. 2Department of
Biomedical Engineering, Chinese Academy of Medical Sciences & Peking
Union Medical College, Institute of Basic Medical Sciences, No.5 Dongdan,
Dongcheng District, Beijing 100730, China.
Received: 1 February 2018 Accepted: 19 July 2018
References
1. Fusco R, et al. Integration of DCE-MRI and DW-MRI quantitative parameters
for breast lesion classification. BioMed. Res. Int. 2015;12:237863.
2. Shin HJ, et al. Prediction of low-risk breast cancer using perfusion
parameters and apparent diffusion coefficient. Magn Reson Imaging. 2016;
34:67–74.
3. Brix G, Griebel J, Kiessling F, Wenz F. Tracer kinetic modelling of tumour
angiogenesis based on dynamic contrast-enhanced CT and MRI
measurements. Eur J Nucl Med Mol Imaging. 2010;37(Suppl 1):S30–51.
4. Koo HR, et al. Correlation of perfusion parameters on dynamic contrastenhanced MRI with prognostic factors and subtypes of breast cancers. J
Magn Reson Imaging. 2012;36:145–51.
5. Anderson AW, et al. Effects of cell volume fraction changes on apparent
diffusion in human cells. Magn Reson Imaging. 2000;18:689–95.
6. Presta LG, et al. Humanization of an anti-vascular endothelial growth factor
monoclonal antibody for the therapy of solid tumors and other disorders.
Cancer Res. 1997;57:4593–9.
7. Horwitz SB. Mechanism of action of taxol. Trends Pharmacologicol Sci. 1992;
13:134–6.
8. Goh V, et al. Assessment of response to tyrosine kinase inhibitors in
metastatic renal cell cancer: CT texture as a predictive biomarker. Radiology.
2011;261:165–71.
9. Davnall F, et al. Assessment of tumor heterogeneity: an emerging imaging
tool for clinical practice? Insights Imaging. 2012;3:573–89.
10. Ganeshan B, et al. Non-small cell lung cancer: histopathologic correlates for
texture parameters at CT. Radiology. 2013;266:326–36.
11. Zhu W, Kato Y, Artemov D. Water exchange-minimizing DCE-MRI protocol
to detect changes in tumor vascular parameters: effect of bevacizumab/
paclitaxel combination therapy. MAGMA. 2014;27:161–70.
12. De Cecco CN, et al. Texture analysis as imaging biomarker of tumoral
response to neoadjuvant chemoradiotherapy in rectal cancer patients
studied with 3-T magnetic resonance. Investig Radiol. 2015;50:239–45.
13. Miles KA, Ganeshan B, Hayball MP. CT texture analysis using the filtrationhistogram method: what do the measurements mean? Cancer Imaging.
2013;13:400–6.
14. Sieren JC, et al. Exploration of the volumetric composition of human lung
cancer nodules in correlated histopathology and computed tomography.
Lung Cancer. 2011;74:61–8.
15. Rajkumar V. Texture analysis of (125)I-A5B7 anti-CEA antibody SPECT
differentiates metastatic colorectal cancer model phenotypes and antivascular therapy response. Br J Cancer. 2015;112:1882–7.
16. Hida K, Maishi N, Torii C, Hida Y. Tumor angiogenesis--characteristics of
tumor endothelial cells. Int Clin Oncol. 2016;21:206–12.
17. Folkman J. Tumor angiogenesis: therapeutic implications. N Engl J Med.
1971;285:1182–6.
18. Adams RH, Alitalo K. Molecular regulation of angiogenesis and
lymphangiogenesis. Nat Rev Mol Cell Biol. 2007;8:464–78.
19. Padhani AR, et al. Diffusion-weighted magnetic resonance imaging as a
cancer biomarker: consensus and recommendations. Neoplasia. 2009;11:
102–25.
20. Ludwig JM, Camacho JC, Kokabi N, Xing M, Kim HS. The role of diffusionweighted imaging (DWI) in locoregional therapy outcome prediction and
response assessment for hepatocellular carcinoma (HCC): the new era of
functional imaging biomarkers. Diagnostics. 2015;5:546–63.
21. Nowosielski M, et al. ADC histograms predict response to anti-angiogenic
therapy in patients with recurrent high-grade glioma. Neuroradiology. 2011;
53:291–302.
22. Thoeny HC, et al. Diffusion-weighted MR imaging in monitoring the effect
of a vascular targeting agent on rhabdomyosarcoma in rats. Radiology.
2005;234:756–64.
Meng et al. BMC Cancer (2018) 18:833
23. Padhani AR, Husband JE. Dynamic contrast-enhanced MRI studies in
oncology with an emphasis on quantification, validation and human
studies. Clin Radiol. 2001;56:607–20.
24. Tofts PS, et al. Estimating kinetic parameters from dynamic contrastenhanced T(1)-weighted MRI of a diffusable tracer: standardized quantities
and symbols. J Magn Reson Imaging. 1999;10:223–32.
25. Padhani AR, Miles KA. Multiparametric imaging of tumor response to
therapy. Radiology. 2010;256:348–64.
26. Yanagisawa M, et al. Bevacizumab improves the delivery and efficacy of
paclitaxel. Anti-Cancer Drugs. 2010;21:687–94.
27. Harry VN, Semple SI, Parkin DE, Gilbert FJ. Use of new imaging techniques
to predict tumour response to therapy. Lancet Oncol. 2010;11:92–102.
28. Tofts PS. Modeling tracer kinetics in dynamic Gd-DTPA MR imaging. J Magn
Reson Imaging. 1997;7(1):91–101.
29. Meier R, et al. Multimodality multiparametric imaging of early tumor
response to a novel antiangiogenic therapy based on anticalins. PLoS One.
2014;9:–e94972.
30. Henriksson E, et al. 2-Deoxy-2-[18F] fluoro-D-glucose uptake and correlation
to intratumoral heterogeneity. Anticancer Res. 2007;27:2155–9.
31. Al-Kadi OS, Watson D. Texture analysis of aggressive and nonaggressive
lung tumor CE CT images. IEEE Trans Biomed Eng. 2008;55:1822–30.
32. Parikh J, et al. Changes in primary breast cancer heterogeneity may
augment midtreatment MR imaging assessment of response to
neoadjuvant chemotherapy. Radiology. 2014;272:100–12.
33. Ganeshan B, Abaleke S, Young RC, Chatwin CR, Miles KA. Texture analysis of
non-small cell lung cancer on unenhanced computed tomography: initial
evidence for a relationship with tumour glucose metabolism and stage.
Cancer Imaging. 2010;10:137–43.
34. Ng F, Kozarski R, Ganeshan B, Goh V. Assessment of tumor heterogeneity by
CT texture analysis: can the largest cross-sectional area be used as an
alternative to whole tumor analysis? Eur J Radiol. 2013;82:342–8.
35. Chowdhury R, et al. The use of molecular imaging combined with genomic
techniques to understand the heterogeneity in cancer metastasis. Br J
Radiol. 2014;87:20140065.
Page 12 of 12