Loss of PDPK1 abrogates resistance to gemcitabine in label-retaining pancreatic cancer cells
Bạn đang xem bản rút gọn của tài liệu. Xem và tải ngay bản đầy đủ của tài liệu tại đây (2.19 MB, 15 trang )
Li et al. BMC Cancer (2018) 18:772
/>
RESEARCH ARTICLE
Open Access
Loss of PDPK1 abrogates resistance to
gemcitabine in label-retaining pancreatic
cancer cells
Dandan Li1†, John E. Mullinax2†, Taylor Aiken3,4, Hongwu Xin5, Gordon Wiegand6, Andrew Anderson7,
Snorri Thorgeirsson8, Itzhak Avital9 and Udo Rudloff1*
Abstract
Background: Label-retaining cancer cells (LRCC) have been proposed as a model of slowly cycling cancer stem
cells (CSC) which mediate resistance to chemotherapy, tumor recurrence, and metastasis. The molecular
mechanisms of chemoresistance in LRCC remain to-date incompletely understood. This study aims to identify
molecular targets in LRCC that can be exploited to overcome resistance to gemcitabine, a standard chemotherapy
agent for the treatment of pancreas cancer.
Methods: LRCC were isolated following Cy5-dUTP staining by flow cytometry from pancreatic cancer cell lines. Gene
expression profiles obtained from LRCC, non-LRCC (NLRCC), and bulk tumor cells were used to generate differentially
regulated pathway networks. Loss of upregulated targets in LRCC on gemcitabine sensitivity was assessed via RNAi
experiments and pharmacological inhibition. Expression patterns of PDPK1, one of the upregulated targets in LRCC,
was studied in patients’ tumor samples and correlated with pathological variables and clinical outcome.
Results: LRCC are significantly more resistant to gemcitabine than the bulk tumor cell population. Non-canonical EGF
(epidermal growth factor)-mediated signal transduction emerged as the top upregulated network in LRCC compared
to non-LRCC, and knock down of EGF signaling effectors PDPK1 (3-phosphoinositide dependent protein kinase-1), BMX
(BMX non-receptor tyrosine kinase), and NTRK2 (neurotrophic receptor tyrosine kinase 2) or treatment with PDPK1
inhibitors increased growth inhibition and induction of apoptosis in response to gemcitabine. Knockdown of PDPK1
preferentially increased growth inhibition and reduced resistance to induction of apoptosis upon gemcitabine
treatment in the LRCC vs non-LRCC population. These findings are accompanied by lower expression levels of
PDPK1 in tumors compared to matched uninvolved pancreas in surgical resection specimens and a negative
association of membranous localization on IHC with high nuclear grade (p < 0.01).
Conclusion: Pancreatic cancer cell-derived LRCC are relatively resistant to gemcitabine and harbor a unique
transcriptomic profile compared to bulk tumor cells. PDPK1, one of the members of an upregulated EGF-signaling
network in LRCC, mediates resistance to gemcitabine, is found to be dysregulated in pancreas cancer specimens, and
might be an attractive molecular target for combination therapy studies.
Keywords: Pancreatic cancer, Cancer stem cell, Label-retaining cancer cells (LRCC), PDPK1, Chemoresistance
* Correspondence:
†
Dandan Li and John E. Mullinax contributed equally to this work.
1
Rare Tumor Initiative, Cancer for Cancer Research, National Cancer Institute,
Building 10, Room 2B-38E, Bethesda, MD, USA
Full list of author information is available at the end of the article
© The Author(s). 2018 Open Access This article is distributed under the terms of the Creative Commons Attribution 4.0
International License ( which permits unrestricted use, distribution, and
reproduction in any medium, provided you give appropriate credit to the original author(s) and the source, provide a link to
the Creative Commons license, and indicate if changes were made. The Creative Commons Public Domain Dedication waiver
( applies to the data made available in this article, unless otherwise stated.
Li et al. BMC Cancer (2018) 18:772
Background
Pancreatic ductal adenocarcinoma (PDAC) is an especially lethal disease with 53,070 new cases diagnosed last
year and 41,780 deaths due to disease [1]. Its 5-year survival rate of 5–8% has not substantially changed over the
last three decades and the American Association for
Cancer Research (AACR) estimates pancreas cancer to
rank second in cancer-related mortality in the U. S by
the year 2020 [2]. Despite recent significant advances in
the knowledge of the underlying molecular mechanisms
in PDAC, meaningful long term survival remains elusive
[3]. More than 80% of patients present with locally advanced or distant metastatic disease at time of diagnosis,
which precludes operative extirpation and, therefore the
only modality associated with longer term survival.
These patients are thus relegated to palliative systemic
therapies with the best combination of conventional
cytotoxic chemotherapy for advanced pancreas cancer
conferring a median survival estimate of less than 1 year
[4, 5]. Given the dismal long term survival for the vast
majority of patients with this disease, new therapeutic
approaches in treatment of this disease are needed.
The cancer stem cell (CSC) theory holds that: 1) cancer arises from cells with dysregulated self-renewal
mechanisms; and, 2) cancer is comprised of a heterogeneous mass of cells, a small fraction of which consists of
stem-like progenitor cells that drive tumor growth and
metastasis [6, 7]. The theory itself is a progression of
Knudson’s two-hit hypothesis of carcinogenesis (initiation and promotion), though the origin of the cell
lineage involved with initiation and promotion of
neoplastic growth is different. A detailed pancreas
cancer-specific stem cell phenotype-genotype association
remains elusive, which is, in part, due to the different
standards of definition and isolation of such cells but
also due to an increased recognition of the inherent heterogeneity of the CSC fraction [8–12] While many
groups have described cancer stem cells from multiple
tissue sources using a variety of methods, these reported
methods rely on cell surface moieties as a surrogate for
the identification of these stem cells, but do not necessarily isolate CSCs in a manner reflective of their proposed function and hierarchy [12–15].
Almost 40 years ago ‘mutational selection’ in cancer
was described and followed 3 years later by the first description of label retaining cells (LRC) and the ‘immortal
strand hypothesis’ [16, 17]. Label-retaining cells (LRC)
are associated with populations of cells enriched with
adult tissue stem cells [18–21]. Many solid organ cancers develop in tissues found to harbor LRC and it is increasingly recognized that slowly cycling LRCC exhibit
cancer stem cell and pluripotency traits representing a
distinct subpopulation of the heterogeneous CSC pool
[5, 22–26]. The clinical importance of the LRCC
Page 2 of 15
subpopulation has recently been demonstrated in a sentinel report of repopulation of residual tumors
post-chemotherapy treatment with new cancer cells
from this pool of cells [27]. Other reports have linked
slowly cycling LRCC to disseminated tumor cells (DTC),
relapse, and metastasis in cancer patients [28, 29]. Recently, we demonstrated that label-retaining cancer cells
(LRCC) undergo asymmetric cell division, and represent
a unique subpopulation of tumor-initiating stem-like
cells with pluripotency gene expression profiles [20].
While early reports described fixed cells, which precluded
downstream analysis, we recently published on such a
method for the isolation of live tissue-derived LRC allowing for future assays dependent on live functioning cells.
Using these methods it was shown that LRC do, in fact,
undergo asymmetric cell division with non-random
chromosomal cosegregation (ACD-NRCC) [20, 30].
The identification of LRCs in PDAC [i.e. pancreatic
cancer-derived label retaining cancer cells (LRCC)]
would offer a unique opportunity to study features of
cancer stemness, in particular with regard to identifying
vulnerabilities of this cell population knowledge which
has remained elusive for the design of more effective
therapies in pancreas cancer and drug development in
general. Despite the ability to potentially impact sentinel
events in cancer recurrence and progression, there is significant paucity in the understanding of selective molecular mechanisms in LRCC.
In the following report, we compare the transcriptome of LRCC and non-LRRC in pancreas cancer cell
lines and identify perturbations unique to LRCC. Targeting one of the genes selectively upregulated in
LRCC, 3-phosphoinositide dependent protein kinase-1
(PDPK1), we demonstrate that the phenotype resistance to chemotherapy in pancreatic cancer LRCC can
be abrogated as a potentially novel treatment avenue
against this difficult to treat cell population possibly
guiding novel combination therapies in this lethal
disease.
Methods
Cell culture
The cell lines MiaPaCa2 (ATCC, Manassas, VA, Cat. #
ATCC-CRL-1420), Panc-1 (ATCC, Manassas, VA, Cat. #
ATCC-CRL-1469), and were grown in DMEM medium
supplemented with 10% FBS, 1% PenStrep, and 1%
200 mM L-glutamine (Gibco, Grand Island, NY). The
Nor-P1 (Riken BioResource Research Center, Japan,
Cat.# RBRC-RCB2139) cell line was grown in RPMI
1640 medium supplemented with 10% FBS, 1% PenStrep, and 1% 200 mM L-glutamine (Gibco, Grand Island, NY). Hereafter these media are considered
“standard” media. Serum free media contained all elements with the exception of FBS and antibiotic free
Li et al. BMC Cancer (2018) 18:772
Page 3 of 15
media contained all elements with the exception of
PenStrep.
then immediately analyzed using the BD FACSAria II
instrument.
Isolation of label retaining cancer cells
Cell proliferation and apoptosis assay
Cells were cultured in standard media until 80% confluency. One cell cycle before labeling, the media was
changed to serum free media. Prior to labeling, the cells
were lifted with 0.25% Trypsin (Gibco, Grand Island,
NY) and resuspended in R-buffer (Invitrogen, Grand Island, NY) at a concentration of 5 × 10⁶ cells/100uL.
Cy5-dUTP (GE Healthcare, Piscataway, NJ) was added
at a concentration of 12uL/5 × 106 cells. The cells were
transfected using the Invitrogen Neon Transfection System using 1200 V for 20 milliseconds and 2 pulses. Immediately following transfection, the cells were placed in
antibiotic free media and grown at 37 °C with 5% CO2
for one cell cycle. Following this brief culture, the cells
were again lifted and sorted for Cy5-dUTP purity using
a BD FACSAria II instrument (BD Biosciences, San Jose,
CA). The Cy5-dUTP+ fraction was placed back into culture and expanded for 8 cell cycles, splitting cells at 70%
confluency. Subsequently, the cells were sorted using a
BD FACSAria II instrument (BD Biosciences, San Jose,
CA). The Cy5-dUTP+ cells represent the label retaining
cancer cells and the Cy5-dUTP− cells represent the
non-label retaining cancer cells. Cells were used immediately for downstream analyses.
The IC50 dose of gemcitabine hydrochloride (Gemzar®
Eli Lilly, Indianapolis, IN) was calculated for each cell
line using the CellTiter-Glo® assay (Promega, Madison,
WI), after exposure to a serial dilution of drug in a 96
well plate format for 72 h. Live cells were plated following FACS at a concentration of 3000 cells/well in 100uL
standard media. Following incubation for 24 h at 37 °C
with 5% CO2, the media was changed to standard media
with the addition of the IC50 dose of gemcitabine hydrochloride for the given cell line. After 72 h cell proliferation was assessed using the CellTiter-Glo® assay with
levels of untreated cells normalized to 100%. Additionally, apoptosis was evaluated at the same time using the
Caspase-Glo®3/7 assay (Promega, Madison, WI).
Gene expression analysis
Total RNA was isolated using Arcturus PicoPure RNA
Isolation Kit (LifeTechnologies, Carlsbad, CA). The quality and quantity of RNA was assessed using the Agilent
2100 Bioanalyzer (Agilent Technologies, Wilmington,
DE) and only total RNA with a RIN > 8 was amplified
using the Illumina TotalPrep RNA Amplification Kit
(Life Technologies, Carlsbad, CA). Following amplification of 200 ng total RNA, the biotin-cRNA was loaded
onto an Illumina HT-12v4 BeadChip and data was obtained using the Illumina iScan device (Illumina, San
Diego, CA). Raw data was exported from Illumina
GenomeStudio to Agilent GeneSpring GX v11 for downstream expression analysis. Pathway analysis was performed using Ingenuity Pathway Analysis software.
Results were validated using TaqMan qRT-PCR with
primers specific to the microarray sequences which were
obtained from Genecopoeia (Rockville, MD).
Exposure to gemcitabine following siRNA transfection
Cells were plated at a concentration of 3000 cells/well in
100uL media containing antibiotic free media with the
addition of 0.3 μL RNAi Max transfection agent (Life
Technologies, Carlsbad, CA) and 2 μL of 1 μM siRNA
(GeneSolution, Qiagen, Valencia, CA) reconstituted in
RNase free water. Following transfection for 48 h, cells
were then exposed to gemcitabine hydrochloride for 72 h
and final cell viability and apoptosis were measured using
the CellTiter-Glo® assay and Caspase-Glo®3/7 assay, respectively. Data analysis was performed using GraphPad
Prism6 software. Drug response curves were created using
a four-parameter equation fitting technique.
Tissue microarray (TMA) composition
De-identified cancer tissues were confirmed to be pancreatic ductal adenocarcinomas based on pathology slide
review at the National Cancer Institute. The analytic
dataset included 144 specimens from the Iowa, Hawaii
and Los Angeles Surveillance, Epidemiology, and End
Results (SEER) Residual Tumor Registries pancreatic
cancer tissue microarray (TMA) [31]. An additional
commercial TMA (Biomax) with 40 matched tumor and
normal pancreatic tissue specimens was used to compare PDK1 expression between tumor specimens and
normal pancreatic tissue.
Immunoblot and immunofluorescence analysis
Cell cycle analysis
Live cells were fixed using 70% EtOH following FACS
sorting. The cells were washed twice using PBS and resuspended in 1 mL of staining solution which contained
10 ml of 0.1% (v/v) Triton X-100 (Sigma) in PBS, 2 mg
DNase-free RNase A (Sigma), and 200 μl of 1 mg/ml PI
(Sigma). Cells were incubated at 37 °C for 30 min and
Cancer cells were lysed with M-PER® Mammalian Protein Extraction Reagent (Cat#78501, ThermoScientific,
Waltham, USA) plus Halt™ protease & phosphatase
inhibitor cocktail (Cat#1861284, ThermoScientific,
Waltham, USA). Protein concentration was determined
via BCA analysis kit (ThermoScientific, Waltham, USA).
For immunoblotting, proteins were transferred from 4 to
Li et al. BMC Cancer (2018) 18:772
20% SDS/Polyacrylamide gels to nitrocellulose blotting
papers via the iBlot®2 Gel Transfer Device (LifeTechnologies, Carlsbad, CA). The phospho-PDPK1 Ser241 antibody (Cat#3438), the phospho-AKT Ser473 antibody
(Cat#9271), the AKT antibody (Cat#9272) and β-Actin
antibody (Cat#4970, all Cell Signaling, Danvers, USA)
were applied and bands were visualized via the Odyssey
luminescence scanner (Li-Cor, Lincoln, USA). For immunofluorescence analysis, approximately 50,000 were
centrifuged onto a glass slide with Rotofix 32 A centrifuge (Hettich Lab Technology, Tuttlingen, Germany)
and fixed in 4% paraformaldehyde at 4 °C overnight.
Cells were permeabilized in 0.25% TritonX-100 and
blocked with 5% normal goat serum in PBS at room
temperature in a humidified chamber for 2 h. Slides
were incubated anti-phosphatidylinositol 3,4,5-trisphosphate (PIP3) (Cat#Z-P345, Echelon Biosciences Inc., Salt
Lake City, UT) monoclonal antibodies. Alexa Fluor®
488 goat anti-mouse IgG (H + L) secondary antibody
was then applied for 1 h at room temperature. Slides
were mounted with Vectashield/DAPI (Vector Laboratories, Burlingame, CA). Images were captured using
a Zeiss LSM 510 UV confocal microscope (Zeiss,
Thornwood, NY).
Immunohistochemistry and statistical analysis
Immunohistochemical staining for PDPK1 (HPA027376;
Sigma Aldrich, St. Louis, MO) was performed by NDBio,
Baltimore, MD. PDPK1 expression was evaluated semiquantitatively for expression levels via a four-tier scale
(0 = negative; 1 = background; 2 = positive; 3 = strongly
positive) and for cellular localization as having cytoplasmic PDPK1 expression, membrane PDPK1 expression,
or a combination of both patterns. Evaluation of staining
was carried out in a blinded fashion with respect to outcome and stage.
Statistical analysis
Matched tumor and normal pancreatic tissues were
compared using Wilcoxon matched-pairs signed rank
test. Product-limit survival estimates were plotted using
the Kaplan-Meier method with significance determined
by log-rank test. Comparison of staining pattern (cytoplasmic vs membrane) with respect to histologic grade
was performed using Fisher’s exact test.
Results
Pancreas cancer label retaining cancer cell (LRCC)
isolation
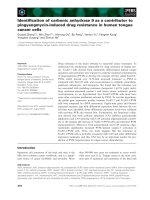
Label retaining cancer cells (LRCC) were isolated from
the cell lines MiaPaCa2, Panc-1, and Nor-P1 following
culture for a period equal to eight doubling times (Fig. 1).
Following this expansion, approximately 0.4% of the cells
would be mathematically expected to retain the label
Page 4 of 15
assuming symmetric division. The proportion of LRCC
exceeded that which would be expected mathematically
(0.4%) with 3.07, 4.30, and 3.55% measured LRCC fraction isolated for MiaPaCa2, Panc-1, and Nor-P1, respectively (p = 0.0119). This significant increase in the
observed compared to the expected proportion of
LRCC is consistent with previous observations of ours
and others of non-stoichiometric division of genetic
material during cell division suggestive of known asymmetric cell divisions of pluripotent cells with stemness
features [20, 30].
Responses to gemcitabine differ in LRCC and bulk cell
population
LRCC, non-label retaining cancer cells (NLRCC), and
unsorted cells were exposed to the previously determined GI50 of gemcitabine of bulk cells of 33 nM (MiaPaCa2), 3 μM (Panc-1) and 3.3 nM (Nor-P1) for a
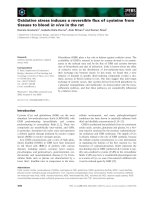
period equal to two doubling times. After normalizing
vehicle-treated cells (VTC) to 100%, relative proliferation after exposure to gemcitabine GI50 of the LRRC
fraction was 103.7% for cell line MiaPaCa2, 88.5% for
Panc-1, and 99.7% for Nor-P1, whereas survival in the
NLRCC fractions decreased to 71.3, 56.6, and 80% compared to vehicle-treated cells (LRCC vs non-LRCC populations in MiaPaCa2 (p < 0.001), Panc-1 (p < 0.01), and
Nor-P1 (p < 0.05) cells), following treatment with gemcitabine, respectively (Fig. 2a). In line with the genotoxic
activity of gemcitabine, we examined levels of apoptosis
in LRCC and non-LRCC populations as a possible
mechanism of action for the observed difference in response to gemcitabine. Activated caspase 3/7 activity in
the LRCC fraction of MiaPaCa2, Panc-1, and Nor-P1
was measured as 109.4, 127.7, and 181.5% compared to
vehicle-treated control whereas apoptosis in the NLRCC
fraction upon gemcitabine treatment increased to
126.6% (p < 0.05), 160.0% (p < 0.01), and 207.4%
(p < 0.01), respectively (Fig. 2b). Apoptosis levels of
LRCC and NLRCC subpopulations were normalized to
caspase 3/7 levels of vehicle-treated cells.
Resistance to gemcitabine is an indigenous feature of
LRCC
Next, we evaluated the possibility that resistance to gemcitabine might have been a consequence of an increased proportion of LRCC induced by gemcitabine treatment. It has
been shown previously that cytotoxic chemotherapy, including gemcitabine in Panc1 cells, can induce stem cell
fractions, as measured by side population fraction or by
cell surface marker CD133 positive cell populations in pancreas cancer [32, 33]. Cy5+ labelled cells were expanded for
a time period equal to six doubling times, and then treated
with the GI50 dose of gemcitabine for two doubling times
prior to sorting for LRCC and NLRCC. In the case of
Li et al. BMC Cancer (2018) 18:772
Page 5 of 15
Fig. 1 LRCC isolated from pancreatic adenocarcinoma cell lines. Flow cytometry measuring Cy5-dUTP labelled cell fraction (x-axis). The amount of
LRCCs (measured by Cy5-dUTP positive fraction) after multiple passages is higher than mathematically expected for symmetric cell division
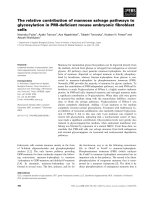
MiaPaCa2 and Panc-1, the average LRCC percentages after
gemcitabine exposure was no different than without gemcitabine exposure (2.0% vs. 3.7%, p = 0.0746) (Fig. 3a).
In order to test the possibility that LRCC are quiescent
relative to NLRCC and consequent decreased number of
cell divisions confers resistance to gemcitabine therapy,
cell cycle analysis of Cy5+ labelled cells were performed
using a propidium iodide (PI) method. FACS analysis of
PI staining revealed no difference in S-phase between
LRCC and NLRCC of the average of the three cell lines
(27.45% vs. 27.05%, p = 0.9247, Fig. 3b). Finally, to evaluate if gemcitabine resulted in slowed division of LRCC
relative to NLRCC, cell cycle analysis was performed following gemcitabine exposure. Following exposure to
GI50 gemcitabine concentrations there was also no difference in S-phase between LRCC and NLRCC (26.05%
vs. 28.35%, p = 0.8006, Fig. 3c), nor was there any difference between the proportion of LRCC in S-phase which
had been exposed to gemcitabine (26.05%) compared to
the proportion of LRCC in S-phase (27.45%, p = 0.8893)
of vehicle treated cells (Fig. 3d). These findings suggest
mechanisms of resistance to gemcitabine are an indigenous feature of LRCC, not due to alterations in cell cycle
progression or proliferation, and, at least initially, not associated with expansion of the LRCC fraction.
Gene expression analysis
We next pursued possible intrinsic mechanisms of resistance inherent to the LRCC population by using a global comparative gene expression approach between the
two cell populations. Unsupervised cluster analysis of
gene expression levels of the LRCC, NLRCC and bulk
cell fractions revealed that the LRCC and bulk fractions
were more similar to each other than the NLRCC fraction for the cell lines Panc-1 and MiaPaCa2 on hierarchical clustering analysis visualized as dendrograms (data
not shown). In each of the cell lines, the LRCC and
NLRCC had the greatest distance between them by IPA
dendrogram measurements considering both lengths of
branches as well as the splits.
Probes representing genes up-regulated and downregulated > 2.0-fold change in the LRCC fraction
compared to the NLRCC fraction were identified. A
Venn diagram analysis was constructed including all
cell lines, which allowed for identification of the
genes commonly up- or down-regulated common to
all three lines. There were 383 probes up-regulated
more than 2.0-fold change in the LRCC compared to
the NLRCC and 432 probes down-regulated more
than 2.0-fold change in the LRCC compared to the
NLRCC.
Li et al. BMC Cancer (2018) 18:772
Page 6 of 15
Fig. 2 Responses in LRCC and NLRCC differ following exposure to gemcitabine. a LRCC resistance as measured by cell proliferation assay (normalized to
vehicle-treated cells (VTC) after treatment with gemcitabine (GI50) for two doubling times in MiaPaCa2, Panc-1, and Nor-P1 cells (*p < 0.05, **p < 0.01,
***p < 0.001; paired t-test). b Activated caspase 3/7 assay measures reduced apoptosis in LRCC population upon exposure to gemcitabine compared
to NLRCC
A
B
C
D
Fig. 3 LRCC resistance is not due to increased proportion of the LRCC fraction or increased quiescence following exposure to gemcitabine. a Flow
cytometry measuring Cy5-dUTP labelled cells (x-axis) are shown. Gemcitabine (at GI50 for individual cell line) was administered after 6 doubling times
and measurements were taken after a total of 8 cycles. b Cell cycle distribution of LRCC and NLRCC cells without gemcitabine treatment, average of
two cell lines of ≥2 independent experiments per cell line are shown. c Cell cycle distribution of gemcitabine treated LRCC and NLRCC cells, average
of two cell lines of ≥2 independent experiments per cell line are shown. d Cell cycle distribution of gemcitabine treated and untreated LRCC cells,
average of two cell lines of ≥2 independent experiments per cell line are shown
Li et al. BMC Cancer (2018) 18:772
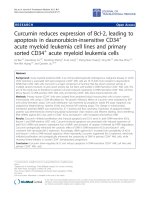
Pathway analysis of the up-regulated genes revealed
enrichment of interactions around the EGF ligand mediated and related pathways as the top enriched network
(Fig. 4a). Three kinases and a synthase were identified in
this network—NOS2A (nitric oxide synthase 2; iNOS,
Entrez ID 4843), NTRK2 (neurotrophic receptor tyrosine kinase 2; TrkB, Entrez ID 4915), PDPK1 (PDK1,
Entrez ID 5170), and BMX (BMX non-receptor tyrosine
kinase; ETK, Entrez ID 660). The average fold change of
up-regulation in the LRCC compared to NLRCC across
the three cell lines for each gene was 6.62, 2.74, 7.22,
and 5.12 for NOS2A, NTRK2, PDPK1, and BMX, respectively). Validation of the microarray data using
qRT-PCR confirmed expression fold change > 2.0 (LRCC
vs. NLRCC) for each gene (NOS2A = 5.6, NTRK2 = 7.2,
PDPK1 = 2.4, BMX = 2.8) initially observed on the
microarray study (Fig. 4b).
Response to gemcitabine following siRNA knockdown of
target genes
Next, to study whether these upregulated genes in the
LRCC population are involved in mediation of response
to gemcitabine, full drug-response curves of gemcitabine
with and without silencing of the four tyrosine kinases
overexpressed in the LRCC fraction were generated.
First, four sequences for each target gene were tested for
effective silencing of target genes confirmed by
qRT-PCR in all cell lines and the two sequences inducing the most efficient loss of mRNA expression (≥88%)
were selected for further studies (Fig. 5a, Additional file 1:
Figure S1A and Additional file 1: Figure S1C). The
reduction of knock-down of PDPK1 was also confirmed
by Western Blot in all three cell lines (Additional file 1:
Figure S1B). Drug response curves with gemcitabine in
Page 7 of 15
MiaPaCa2, Panc-1, and Nor-P1 cells (Fig. 5a and
Additional file 1: Figure S1C) showed increased sensitivities to gemcitabine with IC50s greater than up to
10-fold lower compared to scrambled siRNA control
upon silencing of BMX, NTRK2, and PDPK1. In line
with reduced proliferation, silencing of the 3 genes in
MiaPaCa2, Panc-1, and Nor-P1 cells significantly increased apoptosis upon treatment with gemcitabine (Fig.
5b). In contrast, silencing of iNOS gene did not affect
gemcitabine drug response.
Next, we investigated whether pharmacological inhibition could phenocopy above sensitization findings induced by siRNA silencing and selected PDPK1 as a
major regulator for the activation of AGC kinases
(serine/threonine kinases of the protein kinase A, G, and
C family) and canonical AKT signaling in cancer cells.
To show that LRCC also harbor increased PDPK1 activity, we first compared phospho-PDPK1 in the LRCC vs
NLRCC fractions of the three cell lines next (Fig. 6a). In
line with increased phospho-levels of PDPK1, levels of the
upstream activator of PDPK1, phosphatidylinositol 3,4,5trisphosphate (PIP3), required for membrane lipid binding
and activation of PDPK1 for canonical AKT (AKT Serine/
Threonine Kinase 1) activation was also significantly increased in LRCC vs NLRCC in all three cell lines (Fig. 6b).
Next, we determined drug response profiles to the PDPK1
small molecule inhibitors BX795 and AR-12 in the three
cell lines and selected concentrations of BX795 and AR-12
for gemcitabine combination studies which did not affect
proliferation (Additional file 2: Figure S2). The addition of
PDPK1 blockade increased the growth inhibitory effect of
gemcitabine (Fig. 6c). In addition, the addition of the
PDPK1 inhibitors to gemcitabine significantly increased
the induction of apoptosis (Fig. 6d).
Fig. 4 Differentially regulated genes in LRCCs with potential therapeutic value identified by a) Ingenuity Pathway Analysis (IPA). Only genes with
a fold change > 2 and a FDR < 0.1 were considered, the highest scoring network is shown (genes selected for further analysis are highlighted). b)
Validation of differential gene expression between LRCC and NLRCC cells identified on gene expression arrays by individual qRT-PCR
Li et al. BMC Cancer (2018) 18:772
Page 8 of 15
A
B
Fig. 5 Silencing of BMX, NRTK2, and PDPK1 upregulated in LRCC increases response to gemcitabine in pancreas cancer cells. a anti-BMX, NRTK2
and PDPK1 siRNA leads to increased sensitivity to gemcitabine compared to cells with intact BMX, NRTK2 and PDPK1. Full drug response curves
in MiaPaCa2, Panc-1, and Nor-P1 cells including cells transfected with scramble siRNA and indicated target siRNAs are shown. Gemcitabine
concentration in logM on x-axis. b Induction of apoptosis in MiaPaCa2, Panc-1, and Nor-P1 cells treated with gemcitabine upon silencing of
BMX, NRTK2, or PDPK1 (compared to scramble siRNA cells)
PDPK1/PDK1 knockdown abrogates resistance to
apoptosis in LRCC
To provide support that knockdown of kinases with elevated expression levels in the slowly cycling LRCC fraction was indeed involved in the altered gemcitabine drug
phenotype, we studied the impact of PDPK1 silencing in
the individual LRCC and NLRCC cell subpopulation on
cell growth and induction of apoptosis upon gemcitabine
exposure in the three cell lines next. Following FACS of
Cy5+ cells to separate LRCC and NLRCC, both cell populations were individually transfected with anti-PDPK1
siRNA. Equal knockdown in both cell populations was
confirmed by qRT-PCR and viability and caspase levels
of untreated cells transfected with scramble siRNA was
set to 100%. In the absence of gemcitabine treatment
there was minimal impact of loss of PDKP1 on cell viability or apoptosis levels in untreated cells when compared to cells transfected with scramble siRNA (Fig. 7a
and b). In cells treated with gemcitabine, loss of PDPK1
affected growth of LRCC proportionally significantly
more than the NLRCC fraction (% change compared to
vehicle control cells of LRCC transfected with scramble
siRNA vs PDPK1 siRNA: 80.23% vs 43.32% in MiaPaCa2,
92.28% vs 45.17% in Panc-1, and 77.88% vs 26.57% in
Nor-P1) (Fig. 7a). Similarly, upon loss of PDPK1 gemcitabine, apoptosis levels more in LRCC compared to
NLRCC (% change compared to vehicle control transfected with scramble siRNA vs PDPK1 siRNA: 105.64%
vs 177.69% in MiaPaCa2, 97.32% vs 144.63% in Panc-1,
and 110.26% vs 145.36% in Nor-P1) (Fig. 7b). In
summary, these findings suggest PDPK1 signaling to be
essential in LRCC for the mediation of gemcitabine
resistance.
PDPK1 is dysregulated in pancreatic cancer
To examine if correlative tissue studies on PDPK1 expression in clinical specimens support a role of this enzyme in pancreas cancer biology, we first examined
levels of total PDPK1 expression in tumor versus
matched normal, uninvolved pancreas tissue via IHC on
a total of 40 pancreas cancer specimens. Significantly reduced PDPK1 levels were seen in the tumor specimens
with a ≥ 5-fold reduction of the number of cases staining
2+ and a concomitant increase in the number of cases
who lost PDPK1 or stained weakly positive in the tumors
(Wilcoxon matched-pairs signed rank test; p < 0.0001)
(Fig. 8a and b). We then examined association between
PDPK1 expression levels and pathological variables and
Li et al. BMC Cancer (2018) 18:772
A
Page 9 of 15
B
C
D
Fig. 6 PDPK1 is activated in LRCC and silencing augments response to gemcitabine. a Immunoblots of LRCC and NLRCC fractions from MiaPaCa2,
Panc-1, and Nor-P1 cells probed with anti-phospho PDPK1, anti-phospho AKT. Equal amounts of protein loaded, anti-AKT and β-Actin control on
bottom. b Immunofluoresence of LRCC and NLRCC populations from MiaPaCa2, Panc-1, and Nor-P1 cells measuring anti-phosphatidylinositol 3,4,5trisphosphate levels. Normalized mean of staining intensity for each population shown on the right. c Viability of pancreas cancer cells treated with
gemcitabine alone (blue) or in combination with the PDPK1 inhibitor BX795 (purple) or AR-12 (red). d Induction of apoptosis in pancreas cancer cells
treated with gemcitabine alone or in combination with the PDPK1 inhibitors BX795 and AR-12
clinical outcome including overall survival. There was
no association of overall expression with survival or correlation with one of the pathological variables nuclear
grade, differentiation, or involvement of locoregional
lymph nodes. Since a majority of studies on the potential
role of PI3K-PDPK1-AKT signal transduction in a number of malignancies, including pancreas cancer, found
that activation state measured as phosphorylation rather
than amplification or overall expression levels to be
clinically significant, we re-examined staining pattern of
PDPK1 for membranous vs cytoplasmic staining. For
PDPK1 to be activated by phosphatidylinositol (3,4,5)trisphosphate (PIP3) generated by PI3K, its N-terminal
pleckstrin homology domain provides a lipid-anchoring
part to direct PDPK1 to PI3K-generated PIP3, recruiting
the enzyme to the plasma membrane. Using membrane
recruitment as a measure of PDPK1 activation, we compared membranous versus cytoplasmic staining patterns
with nuclear grade distribution, lymph node involvement, and survival. Only ~ 15% of cases showed membranous staining. Membranous staining was negatively
correlated with high nuclear grade (p = 0.0029, Fig. 8c)
and there was a trend towards improved survival in patients who showed membranous PDPK1 staining in their
surgical or biopsy specimens (Fig. 8d). Membranous
staining was not associated with overall expression
levels. These observed associations of perturbations of
PDPK1 expression patterns in patients’ specimens suggest that PDPK1 regulation might be involved in pancreatic carcinogenesis and pancreas cancer biology.
Discussion
Conventional treatment with systemic cytotoxic chemotherapeutics, which non-specifically targets rapidly dividing cells, is ideally replaced, or supplemented, by therapy
that targets the cells driving recurrence and metastasis—
the primary causes of most cancer-related death for patients afflicted by pancreas cancer [3]. Here we
demonstrate that by inhibiting genes overexpressed in
label-retaining cancer cells, an in vitro model of slowly cycling cells and subpopulation of CSC, can improve response
to the standard cytotoxic chemotherapy with gemcitabine.
Li et al. BMC Cancer (2018) 18:772
Page 10 of 15
A
B
Fig. 7 PDPK1 knockdown decreases resistance to gemcitabine in the LRCC population. a Proliferation of MiaPaCa2, Panc-1, and Nor-P1 cells exposed
to gemcitabine at GI50 concentration for two doubling times and normalized to vehicle-treated when treated with scramble siRNA (left) and PDPK1
siRNA (right) (*p < 0.05, **p < 0.01, ***p < 0.001; paired t-test), and b) induced apoptosis measured by caspase3/7 levels
The rationale of manipulating sub-populations of malignant
cells within a tumor, in particular sub-populations involved
in chemoresistance and metastasis, has recently been
shown in elegant murine models of breast and pancreas
cancer, and could have important implications in the
treatment of patients with cancer [34–36].
While the identification of cancer stem cells in the literature is largely based on cell surface phenotype [12–
14, 37–39], previous work from our group and others
has shown that identification of a population of cells
based on proposed function and hierarchy within a
tumor is possible [19, 40]. Our group has previously
shown that LRCC undergo asymmetric cell division with
non-random chromosomal cosegregation (ACD-NRCC),
which is consistent with the carcinogenesis (initiation
and promotion) portion of the cancer stem cell theory
[18, 20, 41]. Further, LRCC have been shown to be more
tumorigenic, which is consistent with the tumor progression (tumor growth and metastasis) portion of the
cancer stem cell theory [18, 25]. More recently, there
have been more reports on LRCC mediating chemoresistance, early tumor recurrence, and metastasis [29, 42,
43]. However, there has been only one report on slowly
cycling cells in pancreas cancer using the label Dil, and a
surprising paucity on intracellular signaling features
unique to LRCC governing chemoresistance or tumor
initiation [44]. In this report we aimed to assess the possible clinical significance of the LRCC population in
terms of response to gemcitabine, one of the standard
therapies for patients with pancreas cancer. Deriving
LRCC from different pancreatic cancer cell lines we first
showed that LRCC are, in fact, resistant to this’therapeutic’ agent and that decreased rates of apoptosis upon
gemcitabine treatment contributed to gemcitabine resistance phenotype of LRCC. One of the initially vexing
findings was the decreased reduction of NLRCC growth
after gemcitabine administration without a concomitant
increase in the LRCC cells. We attributed this to the
relative short treatment course of two doubling times
possibly too short to detect differences considering the
small number of LRCC but also possibly to a to-date incompletely understood interplay between LRCC and
non-cancer stem cells along the concept of the ‘stem cell
niche’. We speculate that LRCC might feed resistance
signals to the bulk population but as viability and growth
of NLRCC decreases as a consequence of the cytotoxic
treatment ultimately also the pool of stem cells or LRCC
is afflicted. Tumor resistance has then developed when
stem cells recreate the niche, a biological function our
presented in vitro LRCC model with limited gemcitabine
Li et al. BMC Cancer (2018) 18:772
Page 11 of 15
Fig. 8 Comparison of PDPK1 expression in pancreatic tissue microarray. a Representative photomicrographs of pancreatic tissue microarray (TMA)
cores illustrating expression levels of PDPK1 immunohistochemical staining (0,1+,2+,3+) and examples of cytoplasmic and membranous PDPK1
staining (arrows). b Reduced PDPK1 expression levels in tumor specimens compared to matched normal (uninvolved) pancreatic tissue (Wilcoxon
matched-pairs signed rank test; p < 0.0001). c Membranous staining is more frequent in well-differentiated tumors (p = 0.0029, Fisher’s exact test).
d Trend (log-rank test; p = 0.3063) towards improved survival in patients who showed membranous PDPK1 staining
exposure times was not able to measure. Such dynamic
interplay between non-cancer stem cells and cancer stem
cells has now been observed in a number of in vitro
models and early paracrine signaling cues involved in this
crosstalk involve HIFα (hypoxia inducible factors’ α subunits), sonic hedgehog, TGFβ1 (transforming growth factor beta 1), and nodal/activin to name some described
from pancreatic cancer stem cell niche models or, importantly, prostaglandin E2-induced repopulation of the tumor
following chemotherapy treatment from the slowly cycling
CSC as shown in patient-derived xenotransplanted
bladder cancer [27, 45, 46].
In order to investigate differences between the two cell
populations and possibly home in on mechanisms of action governing inherent chemoresistance features of the
LRCC sub-population, we compared transcriptomic profiles of LRCC to the NLRCC population and identified a
top-ranking network by IPA enriched for EGF ligand signaling. Of note, this network is different from the
canonical erb receptor tyrosine kinase signal transduction cascades focusing on immediate EGFR (epidermal
growth factor receptor) or HER2 (human epidermal
growth factor receptor 2) downstream signaling studied
in many cancers and more similar to finding from our
prior work identifying EGF and MET-mediated signaling
as top regulators of cell fate and lineage specific progenitor cell differentiation in the liver [41]. Studies by
Takebe and Jeanes et al. in breast and other solid tumors
on cell differentiation and stemness have also reported
on an intimate role of a more extended, non-canonical
erb signaling network and cancer stemness [47, 48]. We
selected three kinases of the network for further
loss-of-function studies and showed that NTRK2/TrkB,
PDPK1/PDK1, and BMX/ETK were involved in regulation of gemcitabine sensitivity. Individual knockdown of
PDPK1/PDK1 in both the LRCC and NLRCC subpopulations demonstrated that PDPK1/PDK1 inhibition lowered resistance to gemcitabine preferentially in the
Li et al. BMC Cancer (2018) 18:772
LRCC population and less in the NLRCC cells. Loss of
PDPK1 had minimal impact on growth and apoptosis
rates of untreated cells suggesting an essential role of
this regulator in the LRCC population. Along these lines,
recent work has PDPK1 also been implicated in the
regulation of self-renewal, cellular transformation, and
stemness in several diseases including cancer. Of importance, this work identified downstream signaling cascades
regulated by PDPK1 outside the canonical receptor tyrosine kinase, PI3K and AKT-cascade PDKP1 was first described. These include phospholipase C, protein kinase
C, or Hippo signaling governing stemness features
through crosstalk with WNT [wingless-type MMTV
(mouse mammary tumor virus) integration site] or
β-catenin signaling [49–52].
In pancreas cancer, Eser et al. have shown that PDK1
is an essential effector of KRAS, and that an intact
PDK1/PI3K axis is an essential tumor initiating event in
cooperation with KRAS for increased cell plasticity,
acinar-to-ductal metaplasia (ADM), and pancreatic
ductal adenocarcinoma (PDAC) formation [53]. The
pro-tumor function of an intact PI3K/PDPK1 axis reported by Eser and colleagues appears to be at odds with
our findings of decreased PDPK1 expression levels in
tumor tissues, and the associations of membranous
localization with well-differentiated tumors and a trend
towards improved clinical outcome. PDPK1 signals in a
PI3K-depedent manner activating AKT, S6K (ribosomal
protein S6 kinase), and SGK (serum/glucocorticoid regulated kinase) but can also activate PKC and p90RSK independent of PI3K and PIP3-mediated activation. PKC
(protein kinase C) and p90RSK (p90 ribosomal S6 kinase) were found activated by alternative RAS-mediated
signaling pathways independent of PDPK1 in the study
by Eser et al. suggesting a non-essential role of PDPK1
in these tumors [53]. Additionally, downstream PDPK1
canonical signaling measured by phospho-AKT and
phospho-GSK3β (S9) levels was lower in the evolved
pancreas cancers compared to pre-cursor ADM and
PanIN lesions also raising the possibility of the more involved cancers having become independent of the
PDPK1 signaling axis and more driven by signal transduction perturbations of additional pathways acquired
during the later stages of pancreas cancer progression
[53]. Such a hypothesis appears to be in line with the decreased PDPK1 expression levels in the tumor vs
matched clinical specimens on tissue microarray staining. While correlative tissue studies with phospho-AKT
measures have shown the more commonly found negative correlation between increased AKT activation and
clinical outcome, it is possible that there is a subset of
pancreas cancer, similar to studies in non-small cell lung
cancer, where phospho-AKT levels as a measure of
EGFR-PI3K-AKT signaling have been shown to be
Page 12 of 15
associated with improved outcome [54–57]. It is intriguing to speculate that the hypothesis of a greater dependency on PDPK1 signaling in the early
tumor-initiating events of ADM and PanIN formation,
as seen in the transgenic animal studies, versus a later
loss of addiction to canonical PDPK1 signaling and overtake by PDPK1 independent oncogenic events is commensurate with the cancer stem cell hallmark of tumor
initiation by this cell population [12, 53]. Irrespective of
possible differences in PDPK1 function in early vs late or
primary vs metastatic tumors as a possible explanation
of the observed PDPK1 expression pattern on our cancer
tissue microarrays, the association of the heterogeneous
PDPK1 expression pattern with important clinicopathological outcomes appears to be in line with the intratumoral heterogeneity of this regulator found to be
overexpressed and activated in the LRCC vs NLRCC
subpopulations where it is essential for chemoresistance.
On a preclinical level, PDPK1 has shown to confer
oncogenic signaling and CSC renewal. The other targets
derived from the differential gene expression screen in
LRCC vs NLRCC have also been previously linked to
stemness. The Tec kinase BMX non-receptor tyrosine
kinase (BMX) has been shown a tumor promoting role
in gliolastoma multiforme through mediation of
self-renewal and growth, and the neurotrophic tyrosine
receptor kinase 2 (NRTK2) in precursor growth and differentiation [14, 58, 59]. On the other hand, the gene expression differences identified in our in vitro model of
cancer stemness, LRCC vs NRLCC, showed limited
overlap with other in vitro models comparing gene expression and pathway alterations between stem cell and
non-cancer stem cell fractions. For example, similar IPA
network analysis comparing 3D spheroid Panc1 cells,
originally described as the invasive Panc1 cell population, versus 2D monolayer cells resembling non-cancer
stem cells identified as the top differentially regulated
network genes involved in DNA damage repair [60].
When comparing side population versus non-side population bulk cells from patient-derived xenograft models
an extensive network enriched with transcription factors
of pluripotency, cell differentiation, and EMT (epithelial-mesenchymal transition) can be identified [61].
Whether these differences are due to the different platforms or due to the increasingly recognized heterogeneity of different CSC population is currently not known.
The two currently available drug discovery studies performed in pancreas cancer stem cell in vitro models
using either a reporter line for the 26S proteasome activity of pancreas cancer cells or a 3D pancreatic carcinoma
spheroid model yielded drug activities in the 3D CSC
model with inhibition of phosphoinositide 3-kinase signaling, however there was an underrepresentation of selective PDPK1 inhibitors [62, 63].
Li et al. BMC Cancer (2018) 18:772
This study is not without its limitations. First, the isolation of LRCC requires the assumption that all cells
within the Cy5+ labeled population are expanding at the
same rate. Since long term cultured cell lines were used,
this assumption is based on the clonality and homogeneity of these lines. While cells were synchronized via
transfer to serum-free media 24 h prior to labeling we
cannot rule out that present clonal subpopulation with
different growth rates in the used pancreas cancer cell
lines increased the NLRCC subpopulation. However, we
believe this fraction to be small. Second, the apoptosis
experiments upon administration of gemcitabine were
based on the concentration of the drug for 50% of maximal inhibition of cell proliferation, GI50, after two
doubling times (determined individually for each cell
line). This includes experiments on induction of apoptosis upon silencing the genes found to be overexpressed
in the LRCC population. We cannot rule out that the
impact on induction of apoptosis, or silencing of PDPK1
on gemcitabine drug response, might have been higher
or lower either in the LRCC or NLRCC populations
when other concentrations were used. For the presented
in vitro comparisons, it was necessary to establish a consistent cutoff point that allowed for comparisons including downstream evaluation (i.e. qRT-PCR, cell cycle
analysis, FACS) without complete mortality of the cells
after gemcitabine exposure.
Conclusion
In summary, we present in LRCC, an in vitro model
of slowly cycling pancreatic cancer stem cells implicated in chemoresistance and tumor recurrence, the
discovery of novel targets involved in response to
gemcitabine treatment, one of the standard chemotherapy approaches used for pancreas cancer in the
clinic. For decades, chemotherapy regimens have been
based on the cell cycle differential that exists between
normal and malignant tissue. Given the continued
and unchanged dismal prognosis for patients with
pancreas cancer this rationale has proven not specific
enough and not sufficiently efficacious. Here, we have
shown that LRCC harbor distinct transcriptomic profiles involved in mediation of chemoresistance and
that targeting essential regulators of this program in
LRCC can sensitize pancreas cancer cells. These findings offer novel hypotheses for the derivation of effective combination therapy approaches in a disease
void of impactful interventions.
Page 13 of 15
scramble siRNA or anti- BMX, NRTK2 and PDPK1 siRNA (set 1- #1) are
present. B) Protein level of BMX, NRTK2 and PDPK1 of the three cell lines
in immunoblotting. C) anti-BMX, NRTK2 and PDPK1 siRNA (set 2- #2) leads
to increased sensitivity to gemcitabine compared to cells with intact
BMX, NRTK2 and PDPK1. Full drug response curves in MiaPaCa2, Panc-1,
and Nor-P1 cells including cells transfected with scramble siRNA and
indicated target siRNAs (set 2- #2) are shown. (PPTX 652 kb)
Additional file 2: Figure S2. Full drug response curves of the PDPK1
inhibitor BX795 (purple, A) or AR-12 (red, B) in MiaPaCa2, Panc-1, and
Nor-P1 cells. (PPTX 510 kb)
Abbreviations
ACD-NRCC: Asymmetric cell division with non-random chromosomal cosegregation; ADM: Acinar-to-ductal metaplasia; AGC Kinases: serine/threonine
kinases of the protein kinase A, G, and C family; AKT: AKT Serine/Threonine
Kinase 1; BMX: BMX non-receptor tyrosine kinase; CSC: Cycling cancer stem
cells; EGF: Epidermal growth factor; EGFR: Epidermal growth factor receptor;
EMT: Epithelial-mesenchymal transition; HER2: Human epidermal growth
factor receptor 2 (receptor tyrosine-protein kinase erbB-2); HIFα: Hypoxia
inducible factors’ α subunits; LRC: Label retaining cells; LRCC: Label-retaining
cancer cells; NOS2A: NOS2 nitric oxide synthase 2; NTRK2: Neurotrophic
receptor tyrosine kinase 2; P90RSK: p90 ribosomal S6 kinase;
PDAC: Pancreatic ductal adenocarcinoma; PDPK1 (PDK1): 3-phosphoinositide
dependent protein kinase-1; PI: Propidium iodide; PIP3: Phosphatidylinositol
3,4,5-trisphosphate; PKC: Protein kinase C; S6K: Ribosomal Protein S6 Kinase;
SGK: Serum/glucocorticoid regulated kinase; TGFβ: Transforming growth
factor beta; TMA: Tissue microarray; WNT: Wingless-type MMTV (mouse
mammary tumor virus) integration site
Funding
This study was supported, in part, by the Intramural Research Program (IRP)
of the NIH, National Cancer Institute, Center for Cancer Research (ZIA BC
011267) and donations from ‘Running for Rachel’ and the Pomerenk family
via the Rachel Guss and Bob Pomerenk Pancreas Cancer Research Fellowship
to NCI. The funding body had no role in the design of the study and
collection, analysis, and interpretation of data or in writing of the manuscript.
The study was conducted within the mission of the IRP and designed, conducted,
analyzed, and summarized as listed under Authors Contributions. The opinions
expressed in this article are the author’s own and do not reflect the view of the
National Institutes of Health, the Department of Health and Human Services, or
the United States government.
Availability of data and materials
The datasets used and/or analyzed during the current study are available
from the corresponding author on reasonable request.
Authors’ contributions
The study was designed by ST, IA and UR. DL, JM and GW were involved in
isolation of LRCC, determination of LRCC fractions, and cell cycle analysis of
LRCC. DL and JM conducted all the in-vitro drug response experiments, cell
viability, apoptosis, siRNA silencing, and immuno-blotting experiments. Gene
expression microarrays, analysis and bioinformatics were conducted by HW,
JM and AA. Tissue microarray analysis was conducted by TA and DL, who
together with JM compiled all the figures. The manuscript was written by
DL, JM and UR and approved by all co-authors.
Ethics approval
All applicable international, national, and/or institutional guidelines for the
care and use of animals were followed. All animal procedures were
approved by the National Cancer Institute Animal Care and Use
Committee (ACUC) of National Institutes of Health (NIH). No cell lines
in this study required ethics approval for their use. This article does
not contain any studies with human participants performed by any of
the authors.
Additional files
Additional file 1: Figure S1. Confirmation of silencing of BMX, NRTK2,
and PDPK1 mediated by siRNA (set 1- #1) knockdown. A) Expression level
of BMX, NRTK2 and PDPK1 in in MiaPaCa2, Panc-1, and Nor-P1 cells when
Consent for publication
Not applicable.
Competing interests
The authors declare that they have no competing interests.
Li et al. BMC Cancer (2018) 18:772
Publisher’s Note
Springer Nature remains neutral with regard to jurisdictional claims in published
maps and institutional affiliations.
Author details
1
Rare Tumor Initiative, Cancer for Cancer Research, National Cancer Institute,
Building 10, Room 2B-38E, Bethesda, MD, USA. 2Sarcoma Department, Moffitt
Cancer Center, Tampa, FL, USA. 3Thoracic & GI Oncology Branch, Center for
Cancer Research, National Cancer Institute, Bethesda, MD, USA. 4Department
of Surgery, University of Wisconsin School of Medicine and Public Health,
Madison, WI, USA. 5Laboratory of Oncology, Center for Molecular Medicine
and Department of Molecular Biology and Biochemistry, School of Basic
Medicine, Yangtze University, Jingzhou, Hubei, China. 6Flow Cytometry Core,
Hollings Cancer Center, Medical University of South Carolina, Charleston, SC,
USA. 7Gilead Sciences, Foster City, CA, USA. 8Laboratory of Experimental
Carcinogenesis, Center for Cancer Research, National Cancer Institute, NIH,
Bethesda, USA. 9St. Peter’s Hospital, Rutgers University, Robert Wood Johnson
School of Medicine, New Brunswick, NJ, USA.
Received: 11 June 2018 Accepted: 23 July 2018
References
1. Siegel RL, Miller KD, Jemal A. Cancer statistics, 2016. CA Cancer J Clin. 2016;
66:7–30.
2. Rahib L, Smith BD, Aizenberg R, et al. Projecting cancer incidence and
deaths to 2030: the unexpected burden of thyroid, liver, and pancreas
cancers in the United States. Cancer Res. 2014;74:2913–21.
3. Ma J, Jemal A. The rise and fall of cancer mortality in the USA: why does
pancreatic cancer not follow the trend? Future Oncol. 2013;9:917–9.
4. Conroy T, Desseigne F, Ychou M, et al. FOLFIRINOX versus gemcitabine for
metastatic pancreatic cancer. N Engl J Med. 2011;364:1817–25.
5. Von Hoff DD, Ervin T, Arena FP, et al. Increased survival in pancreatic cancer
with nab-paclitaxel plus gemcitabine. N Engl J Med. 2013;369:1691–703.
6. McDermott SP, Wicha MS. Targeting breast cancer stem cells. Mol Oncol.
2010;4:404–19.
7. Kreso A, Dick JE. Evolution of the cancer stem cell model. Cell Stem Cell.
2014;14:275–91.
8. Li C, Heidt DG, Dalerba P, et al. Identification of pancreatic cancer stem
cells. Cancer Res. 2007;67:1030–7.
9. Yachida S, Jones S, Bozic I, et al. Distant metastasis occurs late during the
genetic evolution of pancreatic cancer. Nature. 2010;467:1114–7.
10. Waclaw B, Bozic I, Pittman ME, et al. A spatial model predicts that dispersal
and cell turnover limit intratumour heterogeneity. Nature. 2015;525:261–4.
11. Vicente-Duenas C, Romero-Camarero I, Cobaleda C, et al. Function of
oncogenes in cancer development: a changing paradigm. EMBO J. 2013;32:
1502–13.
12. Hermann PC, Huber SL, Herrler T, et al. Distinct populations of cancer stem
cells determine tumor growth and metastatic activity in human pancreatic
cancer. Cell Stem Cell. 2007;1:313–23.
13. Al-Hajj M, Wicha MS, Benito-Hernandez A, et al. Prospective identification of
tumorigenic breast cancer cells. Proc Natl Acad Sci U S A. 2003;100:3983–8.
14. Bartkowska K, Paquin A, Gauthier AS, et al. Trk signaling regulates neural
precursor cell proliferation and differentiation during cortical development.
Development. 2007;134:4369–80.
15. Shah AN, Summy JM, Zhang J, et al. Development and characterization of
gemcitabine-resistant pancreatic tumor cells. Ann Surg Oncol. 2007;14:
3629–37.
16. Cairns J. Mutation selection and the natural history of Cancer. Nature. 1975;
255:197–200.
17. Potten CS, Hume WJ, Reid P, et al. The segregation of DNA in epithelial
stem cells. Cell. 1978;15:899–906.
18. Xin HW, Ambe CM, Hari DM, et al. Label-retaining liver cancer cells are
relatively resistant to sorafenib. Gut. 2013;62:1777–86.
19. Hari D, Xin H-W, Jaiswal K, et al. Isolation of live label-retaining cells and
cells undergoing asymmetric cell division via nonrandom chromosomal
Cosegregation from human cancers. Stem Cells Dev. 2011;20(10):1649-58.
20. Xin HW, Hari DM, Mullinax JE, et al. Tumor-initiating label-retaining cancer
cells in human gastrointestinal cancers undergo asymmetric cell division.
Stem Cells. 2012;30:591–8.
Page 14 of 15
21. Schillert A, Trumpp A, Sprick MR. Label retaining cells in cancer--the
dormant root of evil? Cancer Lett. 2013;341:73–9.
22. Deleyrolle LP, Harding A, Cato K, et al. Evidence for label-retaining tumourinitiating cells in human glioblastoma. Brain. 2011;134:1331–43.
23. Moore N, Houghton J, Lyle S. Slow-cycling therapy-resistant cancer cells.
Stem Cells Dev. 2012;21:1822–30.
24. Xin HW, Ambe CM, Miller TC, et al. Liver label retaining Cancer cells are
relatively resistant to the reported anti-Cancer stem cell drug metformin. J
Cancer. 2016;7:1142–51.
25. Perego M, Maurer M, Wang JX, et al. A slow-cycling subpopulation of
melanoma cells with highly invasive properties. Oncogene. 2018;37:302–12.
26. Zhang D, Jeter C, Gong S, et al. Histone 2B-GFP label-retaining prostate
luminal cells possess progenitor cell properties and are intrinsically resistant
to castration. Stem Cell Reports. 2018;10:228–42.
27. Kurtova AV, Xiao J, Mo Q, et al. Blocking PGE2-induced tumour repopulation
abrogates bladder cancer chemoresistance. Nature. 2015;517:209–13.
28. Balic M, Lin H, Young L, et al. Most early disseminated cancer cells detected
in bone marrow of breast cancer patients have a putative breast cancer
stem cell phenotype. Clin Cancer Res. 2006;12:5615–21.
29. Morgan TM, Lange PH, Porter MP, et al. Disseminated tumor cells in
prostate cancer patients after radical prostatectomy and without
evidence of disease predicts biochemical recurrence. Clin Cancer Res.
2009;15:677–83.
30. Pine SR, Ryan BM, Varticovski L, et al. Microenvironmental modulation of
asymmetric cell division in human lung cancer cells. Proc Natl Acad Sci U S
A. 2010;107:2195–200.
31. Takikita M, Altekruse S, Lynch CF, et al. Associations between selected
biomarkers and prognosis in a population-based pancreatic Cancer tissue
microarray. Cancer Res. 2009;69:2950–5.
32. Cabarcas SM, Mathews LA, Farrar WL. The cancer stem cell niche--there
goes the neighborhood? Int J Cancer. 2011;129:2315–27.
33. Van den Broeck A, Gremeaux L, Topal B, et al. Human pancreatic
adenocarcinoma contains a side population resistant to gemcitabine. BMC
Cancer. 2012;12:354.
34. Polyak K, Weinberg RA. Transitions between epithelial and mesenchymal states:
acquisition of malignant and stem cell traits. Nat Rev Cancer. 2009;9:265–73.
35. Zheng X, Carstens JL, Kim J, et al. Epithelial-to-mesenchymal transition is
dispensable for metastasis but induces chemoresistance in pancreatic
cancer. Nature. 2015;527:525–30.
36. Fischer KR, Durrans A, Lee S, et al. Epithelial-to-mesenchymal transition is
not required for lung metastasis but contributes to chemoresistance.
Nature. 2015;527:472–6.
37. Dontu G, Al-Hajj M, Abdallah W, et al. Stem cells in normal breast
development and breast Cancer. Cell Prolif. 2003;36:59–72.
38. Korkaya H, Paulson A, Charafe-Jauffret E, et al. Regulation of mammary
stem/progenitor cells by PTEN/Akt/beta-catenin signaling. PLoS Biol. 2009;7:
e1000121.
39. Lapidot T, Sirard C, Vormoor J, et al. A cell initiating human acute myeloid
Leukaemia after transplantation into SCID mice. Nature. 1994;367:645–8.
40. Moore N, Lyle S. Quiescent, slow-cycling stem cell populations in cancer: a
review of the evidence and discussion of significance. J Oncol. 2011;2011.
41. Kitade M, Factor VM, Andersen JB, et al. Specific fate decisions in adult
hepatic progenitor cells driven by MET and EGFR signaling. Genes Dev.
2013;27:1706–17.
42. Fillmore CM, Kuperwasser C. Human breast cancer cell lines contain stemlike cells that self-renew, give rise to phenotypically diverse progeny and
survive chemotherapy. Breast Cancer Res. 2008;10:R25.
43. Roesch A, Fukunaga-Kalabis M, Schmidt EC, et al. A temporarily distinct
subpopulation of slow-cycling melanoma cells is required for continuous
tumor growth. Cell. 2010;141:583–94.
44. Dembinski JL, Krauss S. Characterization and functional analysis of a slow
cycling stem cell-like subpopulation in pancreas adenocarcinoma. Clin Exp
Metastasis. 2009;26:611–23.
45. Sainz B, Alcala S, Garcia E, et al. Microenvironmental hCAP-18/LL-37
promotes pancreatic ductal adenocarcinoma by activating its cancer stem
cell compartment. Gut. 2015;64:1921–35.
46. Carnero A, Lleonart M. The hypoxic microenvironment: a determinant of
cancer stem cell evolution. Inside the Cell. 2016;1:96–105.
47. Takebe N, Warren RQ, Ivy SP. Breast cancer growth and metastasis: interplay
between cancer stem cells, embryonic signaling pathways and epithelial-tomesenchymal transition. Breast Cancer Res. 2011;13:211.
Li et al. BMC Cancer (2018) 18:772
48. Jeanes A, Gottardi CJ, Yap AS. Cadherins and cancer: how does cadherin
dysfunction promote tumor progression? Oncogene. 2008;27:6920–9.
49. Cunningham JT, Ruggero D. New connections between old pathways: PDK1
signaling promotes cellular transformation through PLK1-dependent MYC
stabilization. Cancer Discov. 2013;3:1099–102.
50. Tan J, Li Z, Lee PL, et al. PDK1 signaling toward PLK1-MYC activation confers
oncogenic transformation, tumor-initiating cell activation, and resistance to
mTOR-targeted therapy. Cancer Discov. 2013;3:1156–71.
51. Shahbazian D, Roux PP, Mieulet V, et al. The mTOR/PI3K and MAPK
pathways converge on eIF4B to control its phosphorylation and activity.
EMBO J. 2006;25:2781–91.
52. Fan R, Kim NG, Gumbiner BM. Regulation of hippo pathway by mitogenic
growth factors via phosphoinositide 3-kinase and phosphoinositidedependent kinase-1. Proc Natl Acad Sci U S A. 2013;110:2569–74.
53. Eser S, Reiff N, Messer M, et al. Selective requirement of PI3K/PDK1 signaling
for Kras oncogene-driven pancreatic cell plasticity and cancer. Cancer Cell.
2013;23:406–20.
54. Cicenas J. The potential role of Akt phosphorylation in human cancers. Int J
Biol Markers. 2008;23:1–9.
55. Shah A, Swain WA, Richardson D, et al. Phospho-Akt expression is
associated with a favorable outcome in non-small cell lung cancer. Clin
Cancer Res. 2005;11:2930–6.
56. Schlieman MG, Fahy BN, Ramsamooj R, et al. Incidence, mechanism and
prognostic value of activated AKT in pancreas cancer. Br J Cancer. 2003;
89:2110–5.
57. Yamamoto S, Tomita Y, Hoshida Y, et al. Prognostic significance of activated
Akt expression in pancreatic ductal adenocarcinoma. Clin Cancer Res. 2004;
10:2846–50.
58. Guryanova OA, Wu Q, Cheng L, et al. Nonreceptor tyrosine kinase BMX
maintains self-renewal and tumorigenic potential of glioblastoma stem cells
by activating STAT3. Cancer Cell. 2011;19:498–511.
59. Nikoletopoulou V, Lickert H, Frade JM, et al. Neurotrophin receptors
TrkA and TrkC cause neuronal death whereas TrkB does not. Nature.
2010;467:59–63.
60. Mathews LA, Cabarcas SM, Hurt EM, et al. Increased expression of DNA
repair genes in invasive human pancreatic cancer cells. Pancreas. 2011;
40:730–9.
61. Williams SA, Anderson WC, Santaguida MT, et al. Patient-derived xenografts,
the cancer stem cell paradigm, and cancer pathobiology in the 21st
century. Lab Investig. 2013;93:970–82.
62. Adikrisna R, Tanaka S, Muramatsu S, et al. Identification of pancreatic cancer
stem cells and selective toxicity of chemotherapeutic agents.
Gastroenterology. 2012;143:234–45 e7.
63. Mathews Griner LA, Zhang X, Guha R, et al. Large-scale pharmacological
profiling of 3D tumor models of cancer cells. Cell Death Dis. 2016;7:e2492.
Page 15 of 15