Overview of Vietnam’s economic performance during the first 10 Months
Bạn đang xem bản rút gọn của tài liệu. Xem và tải ngay bản đầy đủ của tài liệu tại đây (192.1 KB, 12 trang )
.VEMR.
Economic UPDATES
� � � �
OVERVIEW OF VIETNAM’S ECONOMIC PERFORMANCE...
ECONOMIC UPDATES
� � � �
Overview of Vietnam’s Economic Performance
during the First 10 Months of 2006
Nguyen Xuan Trinh *
ABSTRACT
This paper focuses mainly on analyzing the country’s economic performance in the first ten months of 2006, focusing on
key indicators such as economic growth, foreign direct investment (FDI), international trade, and the consumer index price
and other indices.
1. Economic growth1
During the first ten months of 2006 Vietnam’s economy continued to record high growth,
which has been recovering since 2001. In the first nine months of 2006, gross domestic product
(GDP), at 1994 prices, was estimated to have increased by 7.84% against the same period of
2005. Agriculture, forestry and fishery increased 3.32%, while the industry and construction
sector as a whole rose by 9.85%, 0.13 percentage points lower than in the same period of 2005
due to a slowdown in construction growth during the nine months. Services rose 8.03%, of
which some sectors with large proportions continued to record growth rates higher than those in
the same period of 2005, such as domestic trade by 8.31%, post and telecommunication and
tourism 10.7%, and public services and national security and defense 7.38%.
The economic structure continued to shift in a positive direction towards industrialization.
The proportion of industry and construction increased from 41.11% of GDP in the first nine
months of 2005 to 41.5% during the first nine months of 2006, services rose from 38.14% to
38.42%, while agriculture, forestry and fishery fell from 20.74% to 20.08%.
*
Dr. Nguyen Xuan Trinh is Vice-President of the Central Institute for Economic Management.
66 Vietnam economic management
review
Number 1 Winter 2006
.VEMR.
Economic UPDATES
OVERVIEW OF VIETNAM’S ECONOMIC PERFORMANCE...
1.1. Agriculture, forestry and fishery production
In the first nine months of 2006, the total output value of the agriculture, forestry and fishery
sector, based on 1994 prices, reached VND130.3 trillion, an increase of 4.2% against the same
period in 2005, of which agriculture recorded VND95.9 trillion, rising by 3.1%, forestry VND4.8
trillion, a 1.1% rise, and fishery VND29.6 trillion, a rise of 8.6%. The proportion of the
agriculture, forestry and aquaculture sector output in the aggregate economic structure fell from
20.74% of GDP in the first nine months of 2005 to 20.08% during the same period this year.
The growth rate in the agriculture, forestry and fishery sector in the first nine months of 2006
is relatively high, but lower than in the same period of 2005. This decline was mainly caused by
a slowdown in agriculture and fishery due to unfavorable weather conditions and pestilence. As
at mid-October, 2.145 million ha of summer and autumn-winter rice was harvested, accounting
for 92% of the total rice cultivation area. According to preliminary estimates, rice productivity in
the summer crop throughout the country fell from 1-3 quintal per ha against the same period of
2005, due to the harmful effects of widespread pestilence and unfavorable weather conditions.
Animal husbandry, meanwhile, suffered from livestock and poultry diseases. As at October 20,
foot-and-mouth disease had become widespread in 25 communes in 15 districts in six provinces.
Inoculation against poultry disease was reinforced in all provinces but remained slow due to
shortages of vaccine. However, livestock herds and poultry flocks continued to rise nationwide.
Forestry achieved solid results, as weather conditions facilitated afforestation. In the first ten
months of 2006, the total area of concentrated forest in the whole country was estimated at
162,300 ha, an increase of 2.8% against the same period of 2005. In addition, the area of
destroyed forest due to harvesting and fire decreased remarkably. In short, the area of destroyed
forest was 4,721.5 ha, 46.8% less than in the same period last year.
Fishery production continued to develop during the first ten months of 2006. Total output of
aquatic products was estimated at 3.045 million tons, 8.2% higher than in the same period of
2005, of which aquaculture output reached 1.343 million tons, an increase of 19.4%, and the
aquatic catch stood at 1.702 million tons, an increase of 0.8%.
1.2. Industrial production
Industrial output played a key role in domestic production growth because it accounts for the largest
share of total economic output. Value in the first ten months of 2006 reached VND 411,627 billion,
16.9% higher than in the same period of 2005. Industrial output value in the non-state sector increased
at the highest rate, by 22.3% against last year, while that of the foreign-invested sector rose 19.5% and
the state-owned enterprise (SOE) sector by 9.3%. In the foreign-invested sector, the output value of oil
and gas fell by 4.9% (mainly due to reductions in average oil prices and Vietnam’s policy of
conserving the country’s natural resources), but output of other industrial products increased by 25.1%.
In terms of the ownership structure, the foreign-invested sector played the most important
role, accounting for approximately 39% of the total industrial output value (Table 1). Even with
crude oil and gas excluded, the sector still accounted for the highest proportion, at 32.86%. The
Number 1 Winter 2006
Vietnam economic management review
67
.VEMR.
Economic UPDATES
OVERVIEW OF VIETNAM’S ECONOMIC PERFORMANCE...
non-state sector recorded the highest growth rate in industrial output but had the lowest
proportion of total industrial output value, at nearly 30%.
Table 1: Value and growth rates of industrial output
in the first 10 months of 2006, by ownership
Share of total
industrial output value
(billion VND)
Compared to
October 2005
(%)
Total output
value
Sector
(%)
1
State-owned enterprises
130,185
9.3
31.6
2
Non-state sector
122,267
22.3
29.7
3
Foreign-invested enterprises
159,175
19.5
38.7
411,627
16.9
100.0
Total
Source: GSO (2006) and author’s calculation.
Some of the main industrial sectors with large proportions of industrial output value
continued to record high and stable growth rates, contributing to the overall high growth rate of
the industry sector in the first ten months compared to the same period last year. For instance, the
share of food and beverage production was 21.4% of industrial output value, an increase of
approximately 17%. Products such as rubber and plastic, and leather and leatherette, had a
smaller share of about 5% of industrial output value but recorded quite high growth rates, of 26%
and more than 18%, respectively (Table 2).
Table 2: Growth rates in industrial output value of key industries
in the first 10 months of 2006 (%)
Industry/product
Share of total industrial
output value (%)
Compared to the same
period of 2005 (%)
1
Food and beverages
21.4
17.0
2
Leather, leatherette
4.7
18.0
3
Wood
2.0
28,8
4
Rubber and plastic
5.2
26.0
5
Metal
4.1
24.0
Source: GSO (2006) and author’s calculation.
While some industries recorded high growth rates, others fell short of achievements in the
same period of 2005, such as crude oil exploitation (falling 8.3%), machinery and equipment
(33.3%), and automobiles (32%).
There were cities and provinces that experienced higher-than-average growth rates in
industrial output (the average being 16.9%) during the first ten months of 2006: Hai Duong
23.6%, Ha Tay 22.5%, Vinh Phuc 21.1%, Dong Nai 20.6%, Binh Duong 19.1%, Quang Ninh
18.1% and Hanoi and Hai Phong 17.6%. Ho Chi Minh City recorded industrial output growth at
68
Vietnam economic management
review
Number 1 Winter 2006
.VEMR.
Economic UPDATES
OVERVIEW OF VIETNAM’S ECONOMIC PERFORMANCE...
a much lower level than these provinces, increasing by 13.2%. Provinces in which the foreigninvested sector recorded the highest growth rates in industrial output were Hai Duong (36%),
Khanh Hoa (31%), Dong Nai and Hanoi (about 30%), and Binh Duong (20.3%).
1.3. Total retail revenues of goods and services
The total retail revenues of goods and services at current prices for the first 10 months were
estimated at VND 470,000 billion, some 20.5% higher than in the same period last year. Retail
revenues of goods and services at current prices of the non-state sector continued to play the
major role, accounting for nearly 85%, with the state sector accounting for only 12.5% and the
foreign-invested sector 2.5%.
The hotels and restaurants sub-sector accounted for a significant proportion of total revenues
and experienced quite high growth. Tourism was also among the sub-sectors with the highest
growth rates, but its proportion of total revenues was very small. The fact that the living
standards of Vietnamese people have improved and Vietnam has become a more attractive
destination2 can be regarded as the key factors behind these achievements. The performance of
the retail revenues of goods and services, by sub-sector, for the first ten months of 2006, is
shown in Table 3.
Table 3: Total retail revenues of goods and services, by sub-sector
in the first 10 months of 2006
Total revenues
(billion VND)
Share
(%)
As compared to the same
period of 2005 (%)
1
Domestic trade
382,965
81.5
19.7
2
Hotels and restaurants
56,808
12.1
21.4
3
Tourism
3,420
0.7
28.7
4
Other services
26,809
5.7
31.2
Total
470,002
100.0
Source: GSO (2006) and author’s calculation.
2. Foreign direct investment
Foreign direct investment (FDI) attraction can rightly be regarded as the highlight in Vietnam’s
economic picture for 2006. As at October 20, 705 foreign invested projects were licensed nationwide
with total registered capital of USD 4.78 billion and additional registered capital of about USD 1.71
billion, bringing total foreign investment to nearly USD 6.5 billion. According to estimates, in 2006 the
total amount of FDI inflow could surpass the record set in 1996 (of USD 8.6 billion)3. The prospect of a
new wave of foreign investment inflow, particularly from Japan and the US, is considered to be very
high, which would contribute to increased foreign investment in Vietnam in the coming years.
By sector, foreign-invested projects licensed during the first ten months of 2006 were mainly
concentrated in the industry and construction sector, with 477 projects worth USD 3.1 billion
and accounting for 65% of total registered capital, followed by services with 32.8% of the total.
Number 1 Winter 2006
Vietnam economic management review
69
.VEMR.
Economic UPDATES
OVERVIEW OF VIETNAM’S ECONOMIC PERFORMANCE...
Sectors with the major share of total registered FDI capital were heavy industry (43.6%), light
industry (15.5%), and transport, postal services and hotels and tourism (nearly 9%) (see Table 4).
Table 4: Top 10 sectors with largest FDI in the first 10 months of 2006
Sector
Number of
projects
Registered capital
(thousand USD)
Share in total
registered capital (%)
1
Heavy Industry
209
2,083,257
43.58
2
Light Industry
209
740,199
15.49
3
Hotels, tourism
9
429,600
8.99
4
Transportation, postal service
15
428,475
8.96
5
Offices, apartments
7
182,146
3.81
6
Services
126
142,366
2.98
7
Construction
34
107,160
2.24
8
Agriculture and forestry
45
102,874
2.15
9
Food processing industry
14
67,360
1.41
10
Culture, health, education
21
54,948
1.15
689
4,338,385
90.76
Total
Source: GSO (2006) and author’s calculation.
Encouragingly, 2006 was the first time that many major hi-tech projects were registered, in
particular those of Microsoft and Intel. Intel raised its investment in Ho Chi Minh City to more
than USD 1 billion. The Meiko Electronic Corporation from Japan signed a contract to build a
factory producing electronic plates and hi-tech products in Ha Tay province, and the UMC
Electronic Company invested in building a factory specializing in the assembly of hi-tech
electronic equipment in Hai Duong province.
Table 5: Top 10 cities and provinces receiving the largest amounts of FDI
in the first 10 months of 2006
Province
70
Number of
projects
Registered capital
(thousand USD)
Share in total
registered capital (%)
1
Ho Chi Minh City
190
1,151,724
24.09
2
Binh Duong
153
666,283
13.94
3
Hanoi
89
530,319
11.09
4
Dong Nai
67
275,330
5.76
5
Hai Phong
27
123,227
2.58
6
Hung Yen
15
70,221
1.47
7
Vinh Phuc
14
61,889
1.29
8
Long An
13
97,500
2.04
9
Bac Ninh
12
50,983
1.07
Vietnam economic management
review
Number 1 Winter 2006
.VEMR.
10
Economic UPDATES
OVERVIEW OF VIETNAM’S ECONOMIC PERFORMANCE...
Binh Phuoc
12
41,649
0.87
Total
592
3,069,125
64.21
Source: GSO (2006) and author’s calculation.
By city and province, the FDI inflow into Ho Chi Minh City lead the way with 190 projects
and 24% of the total registered capital. Binh Duong province followed, with 153 projects and
13.9%, then Hanoi with 89 projects and 11%. Provinces with a high proportion of total registered
capital included Dong Nai, Hai Phong, and Hung Yen, among others. (see Table 5).
By FDI origin, as at October 20, 477 projects from 38 countries and territories had been
granted investment licenses, of which Hong Kong was the biggest investor with registered
capital of USD 833.5 million, accounting for 17.4% of the total. Second place was held by South
Korea, with a 16.2% share of total investment capital. The US ranked third, with 13.3% of the
total. (see Table 6).
Table 6: Top 10 largest investors in the first 10 months of 2006
Country/territory
Number of
projects
Registered capital
(thousand USD)
Share in total
registered capital
(%)
1
Hong Kong
17
833,506
17.44
2
South Korea
180
770,353
16.12
3
The United States
45
635,562
13.30
4
Cayman Islands
2
576,000
12.05
5
Japan
115
556,380
11.64
6
British Virgin Islands
16
319,829
6.69
7
Singapore
41
223,618
4.68
8
Taiwan
103
176,837
3.70
9
The Netherlands
11
90,908
1.90
10
India
5
77,900
1.63
535
4,260,893
89.14
Total
Source: GSO (2006) and author’s calculation.
The remarkable achievements mentioned above are due to many factors. Firstly, Vietnam’s
continued high economic growth rate, its membership of the WTO, and its huge domestic market
with a young population are significant, making the country more attractive to foreign investors.
Secondly, its efforts to improve the investment and business environment and promote investment,
especially the introduction of the Investment Law 2005 and the Enterprise Law 2005, have been
important factors in encouraging foreign investors to invest more in new and additional projects.
Thirdly, since Vietnam occupies an important geo-political position, the surge of investment
inflows from the US, Japan, South Korea is perhaps part of a new strategic direction, including the
investment strategy of trans- and multi-national corporations aiming to increase benefits, spread
investment risk, and restrain the two newly emerging economic powers in the region (China and India).
Number 1 Winter 2006
Vietnam economic management review
71
.VEMR.
Economic UPDATES
OVERVIEW OF VIETNAM’S ECONOMIC PERFORMANCE...
However, the investment environment in Vietnam remains generally unfavorable, making
foreign investors concerned. Key shortcomings include poor infrastructure, an incomplete legal
framework, lack of transparency, cumbersome administrative procedures, and widespread
corruption. Vietnam therefore needs to improve its investment environment to make itself more
attractive.
3. International trade
Vietnam’s international trade sector continued to prosper in 2006. Goods import and export
turnover for the first ten months stood at USD 69.74 billion, a 22.3% increase over the same
period last year, of which export turnover reached USD 32.87 billion, a rise of 24.2%, and
import turnover USD 36.87 billion, an increase of 20.7%. Since goods export turnover was
higher than goods import turnover, the gap between them narrowed. However, the trade deficit
for the first ten months of 2006 was equivalent to that in 2005.
3.1. Goods export turnover
For the first ten months of 2006, goods export turnover increased sharply both in the domestic sector
and the foreign-invested sector. Goods export turnover in the domestic sector recorded USD 3.85 billion,
22.3% higher than in the same period last year. Meanwhile, goods export turnover, excluding crude oil,
in the foreign-invested sector amounted to USD11.91 billion, an increase of 32.4%.
Taking into account the terms of goods exports, Vietnam continued to promote the export of
commodities with high comparative advantage and export potential. Crude oil recorded the highest
value in export turnover during the 10 months, at USD 7.1 billion and increasing by 15.9%. Second
highest was textiles, 27.2% higher than in the same period of 2005 (the value of textiles exported to
large markets like the US increased by 26.5%5, and to the EU by 49% against the same period of
2005). Although Vietnam faced difficulties because of the EU imposing anti-dumping tariffs, the
export value of footwear made by Vietnamese enterprises increased by 19.9% against the same
period in 2005, of which the value of exports to the US market rose by 31%. Table 7 shows the key
export items with the highest export values during the first ten months of 2006.
Table 7: Top ten export goods for the first 10 months of 2006
Key items
72
Export value for first 10
months of 2006
(million USD)
Growth rate as
compared to the same
period of 2005 (%)
1
Crude oil
7,114
15.9
2
Textiles and garments
4,969
27.2
3
Footwear
2,871
19.9
4
Aquaculture products
2,753
23.2
5
Wooden products
1,531
25.6
6
Electronics, computers
1,414
20.2
7
Rice
1,189
-7.8
8
Rubber
1,091
86.3
Vietnam economic management
review
Number 1 Winter 2006
.VEMR.
Economic UPDATES
OVERVIEW OF VIETNAM’S ECONOMIC PERFORMANCE...
9
Coffee
844
37.6
10
Coal
713
37.8
Source: GSO (2006) and author’s calculation.
3.2. Goods import turnover
Goods import turnover for the first ten months of 2006 was estimated at USD 36.87 billion,
an increase of 20.7% compared with the same period of 2005, with that of domestic enterprises
standing at USD 23.34 billion, rising by 20.6%, and that of foreign-invested enterprises USD
13.53 billion, an increase of 20.8%.
For the first ten months of 2006, goods imports mostly included fuel and raw materials, and
machinery and equipment for domestic production and consumption, and they were on the increase.
The import value of petrol rose rapidly due to a sharp increase in petroleum prices in the middle of
the year (although the import volume was less than that of 2005). The import value of machinery
and equipment during the period increased 23% against last year and recorded the highest import
value. The import value of fabric accounted for nearly USD 2.4 billion, rising 22.9%. Nevertheless,
the import of other inputs for textiles and garments and leather products during the 10 months fell
by 12.7%, due to domestically-produced items gradually substituting imported items. The ten goods
with the highest import value for the first ten months of 2006 are listed in Table 8:
Table 8: Top ten import merchandises for the first 10 months 2006
Key items
Import value for first
10 months of 2006
(million USD)
Growth rate as
compared to the same
period of 2005 (%)
1
Machinery, equipment, and accessories
5,315
23.0
2
Petrol, machinery oil
5,124
22.3
3
Steel
2,423
-4.2
4
Garments
2,394
22.9
5
Electronics, computers and accessories
1,653
20.1
6
Garment inputs and leather
1,633
-12.7
7
Plastic
1,540
28.0
8
Chemicals
850
19.8
9
Chemical products
834
22.3
10
Animal feed and related products
671
30.6
Source: GSO (2006) and author’s calculation.
The major import markets for Vietnam were still Asian countries and territories such as Japan,
China, Taiwan, Singapore, and others. For example, the import of machinery and equipment from Japan
amounted to some USD 1 billion, from China USD 798 million, and from Taiwan USD 496 million.
The achievements seen in foreign trade during 2006 can be attributed to the efforts made by
the Vietnamese Government and the enterprises themselves.
Number 1 Winter 2006
Vietnam economic management review
73
.VEMR.
Economic UPDATES
OVERVIEW OF VIETNAM’S ECONOMIC PERFORMANCE...
For the government, 2006 was the first year it carried out renovation of the management and
monitoring in the long-term over the National Trade Promotion Program under Decision No. 279
from the Prime Minister dated 3rd November 2005, making it possible for enterprises to access
the Program and simplifying payment procedures. The state agency governing the program also
became more flexible in working out and adjusting items in the Program. For example, Vietnam
promulgated an import-export mechanism to comply with the principles and regulations of the
WTO under Decree 12/2006/ND-CP dated 23 January 2006, on activities in the purchase and
sale of export-import commodities and assembly activities. To date, this has been the longestterm mechanism, bringing stability in monitoring international trade activities and supporting
enterprises to develop their own strategies.
Enterprises have also made greater efforts and taken a more proactive approach to
international trade activities. Export and import activities were also conducted during the Tet
(new lunar year) holidays. In particular, taking the delivery of goods to customers and the receipt
of payment as a completed task, Vietnamese enterprises have gradually been active in accessing
distribution channels in foreign markets and providing customer care services, making it possible
for exports to be promoted in a sustainable manner over the long-term.
4. Consumer price index
During the first ten months of 2006, the consumer price index (CPI) increased considerably
but at a rate much less than in 2005, even though oil prices rose quite sharply in the first half of
the year. Huge price fluctuations in the world market had a major impact on the prices of
domestic goods and services. Compared to December 2005, the CPI in October 2006 had
increased 5.4%, and 6.7% against October 2005.
Goods and services recording the highest increases in price include food and foodstuffs, at
7.4% and 4.9%, respectively, housing and construction materials 5.6%, and textiles, footwear,
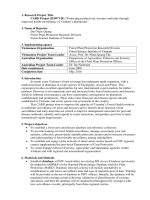
and hats 5% against December 2005 (Figure 1).
Figure 1: CPI growth rate, gold price index and VND/USD exchange rate
in the first ten months of 2006
(Price levels of December 2005=100)
74
Vietnam economic management
review
Number 1 Winter 2006
.VEMR.
Economic UPDATES
OVERVIEW OF VIETNAM’S ECONOMIC PERFORMANCE...
140
135
130
125
120
115
110
105
100
95
90
1//2006
2//2006
3//2006
4//2006
5//2006
6//2006
Consumer price index
Foodstuff
Medicine and health service
Gold index
7//2006
8//2006
9//2006
10//2006
Food
House and construction materials
Post and telecomunication
USD index
Food and foodstuff prices increased primarily because of impacts from natural calamities
(typhoons and floods), and disease (foot-and-mouth disease and diseases caused by pestilence),
and partly because of escalating rice prices in the world market, causing a rise in the rice
wholesale price in the domestic market despite the efforts of the government to stabilize prices,
such as suspending rice exports and selling the national rice reserve in an organized manner.
It is worth noting that since June 2006, postal and telecommunication services fees began to
decrease considerably, at a rate of approximately 2-3%. This shows that opening up the post and
telecommunication services market and allowing competition had a positive effect on reducing fees,
which have long been considered too high compared to those in other countries and territories.
The most outstanding point in 2006 was that gold prices skyrocketed. Compared to December
2005, gold prices surged by a peak rate of 37.6% in May 2006. Such a sudden increase was largely
due to a rise in the world gold prices. Demand for gold to make payments in real estate transactions
have perhaps reduced, because the number of transactions in 2006 may not be as high as that seen 2
or 3 years ago, resulting from many integral parts of the real estate market becoming “frozen”.
Therefore, the demand for gold may not have had a significant impact on domestic gold prices.
The exchange rate (USD/VND) during the first ten months of 2006 increased slightly, at
0.8%. With the surge of capital inflows into Vietnam (via both FDI, as discussed earlier, and
foreign portfolio investment6), keeping the exchange rate fluctuation within a narrow band can
lead to further appreciation of the VND, which is considered to have been significantly
overvalued for many years. This can have an adverse impact on the country’s export
performance in particular and the trade balance in general.
5. Overall assessment and some policy recommendations
In general, Vietnam’s economy continued to record quite high economic growth during the first
ten months of 2006. Estimates are that most of Vietnam’s economic indicators will meet or exceed
targets set for the year. However, there remain many factors that threaten the sustainability of
Number 1 Winter 2006
Vietnam economic management review
75
.VEMR.
Economic UPDATES
OVERVIEW OF VIETNAM’S ECONOMIC PERFORMANCE...
economic growth, such as inefficiency in State investment, a limited pool of quality human resources,
low value-added levels and the poor competitiveness of goods and services. Shortcomings in State
management have also resulted in environmental pollution in many provinces, and social evils remain
serious. The limited capacity of the State apparatus, the slow pace of administrative reform and
rampant corruption have also challenged the sustainability of the country’s economic development.
Vietnam has joined the WTO and made significant commitments to opening up domestic
markets, reducing tariffs and subsidies substantially while competitiveness is still limited. This has
created a great deal of pressure and presented challenges for the economy in the post-WTO period.
It is vital that Vietnam carries out proper reforms to maximize the benefits of WTO accession and
minimize any adverse effects. Recent efforts in anti-corruption by the government are encouraging
but should be continually strengthened. With greater political determination, Vietnam can integrate
effectively into the global economy during the post-WTO period, enhancing the nation and its
industrial competitiveness and guaranteeing the sustainability of economic growth over the longterm. �
Notes
1. Figures in this report were mainly provided by the General Statistics Office (GSO) of Vietnam.
2. The number of foreign tourists visiting Vietnam during the first ten months of 2006 was
estimated at 2.95 million, an increase of 3.6%. This modest growth rate was primarily
attributed to a sharp decrease in the number of Chinese tourists due to internal reasons.
3. According to the Bureau of Foreign Investment at the Ministry of Planning and Investment, as
at 20 November 2006, total FDI inflow (including registered capital and additional capital)
was USD8.274 billion, 47.4% higher than in the same period of 2005 and 31.7% higher than
the targeted USD6.5 billion for the year as a whole.
4. In 2006, Binh Duong province topped the competitiveness rankings at the provincial level,
published by the Vietnam Chamber of Commerce and Industry.
5. During the first eight months of 2006, the export value of Vietnamese goods to the US market was
USD5.56 billion, while goods import value was only USD626 million (New York Times, 2006).
6. In 2006, Vietnam’s stock market developed at a very high rate of growth. The VN-Index
skyrocketed from 304.23 points (12 January 2006) to 809.86 (20 December 2006); the
market’s total capitalization increased from less than VND 10 trillion (USD 629 million) at
end-2005 to VND 137 trillion (about USD 8.6 billion) as at December 12, 2006. The total
value of the informal stock market is estimated to be three or six times higher than that of the
formal market. With the right to possess a high proportion (up to 49%) of total assets of a
shareholding company, and with abundant capital and professionalism, foreign investors have
had a major role in market making and stock transactions (about 30- 40% of daily total stock
turnover) in both the formal and informal stock markets. The booming development of the
stock market has attracted a huge amount of capital into Vietnam.
References
76
Vietnam economic management
review
Number 1 Winter 2006
.VEMR.
Economic UPDATES
OVERVIEW OF VIETNAM’S ECONOMIC PERFORMANCE...
Central Institute for Economic Management (CIEM) (2005), Vietnam Economy in 2005,
Political Theory Publisher, Hanoi.
‘FDI accounted for nearly 8.3 billion USD’. Available on line at:
accessed
in 23 November 2006.
GSO (2006), ‘Socio-Economic performance in October and first 10 months of 2006) (in
Vietnamese) (Tình hình Kinh tế - Xã hội Tháng 10 và 10 tháng năm 2006).
New York Times (www.nytimes.com/2006/10/25/business/worldbusiness/25vietnam.html
accessed in 25 October 2006).
Press Release on statistical data of Vietnam socio-economic indicators in first 9 months of GSO (in Vietnamese)
(Thông cáo Báo chí về số liệu Thống kê Kinh tế - Xã hội 9 tháng năm 2006 của Tổng cục Thống kê).
Province Competitive Index (Available on line at accessed in 20 November 2006).
Websites: www.vir.com.vn, www.vneconomy.com.vn.
Number 1 Winter 2006
Vietnam economic management review
77