Scenarios of meteorological drought in Tien river estuary under the climate change context using the ped index
Bạn đang xem bản rút gọn của tài liệu. Xem và tải ngay bản đầy đủ của tài liệu tại đây (890.58 KB, 10 trang )
HNUE JOURNAL OF SCIENCE
Natural Sciences 2019, Volume 64, Issue 10, pp. 148-157
This paper is available online at
DOI: 10.18173/2354-1059.2019-0084
SCENARIOS OF METEOROLOGICAL DROUGHT
IN TIEN RIVER ESTUARY UNDER THE CLIMATE CHANGE CONTEXT
USING THE PED INDEX
Dao Ngoc Hung1, Nguyen Thanh Luan1, Vu Thi Hang1, Tran Van Thuong2,
Cu Thi Phuong3, Bui Thi Thanh Dung1 and Dang Vu Khac1
1
2
Geography Faculty, Hanoi National University of Education
Geography Faculty, Ho Chi Minh City University of Education
3
Faculty of Planning, Industry and Environment, Australia
Abstract. The article deals with the issues of meteorological drought in the coastal
area of the estuary of the Tien river, including Tien Giang and Ben Tre provinces,
which have favorable climatic conditions for agricultural development. In the
context of climate change, drought often happens, seriously affecting the local
economy. In order to estimate the drought level, scientists have come up with many
approaches to calculate drought indices for different regions and territories around
the world. Based on the natural and socio-economic characteristics of the coastal
area of the estuary of the Tien river, it can be seen that the proposed PED
meteorological index is suitable for estimating meteorological drought in the study
area. Based on emission scenarios 4.5 and 8.5 RCP, this research project
establishes a map of meteorological drought scenarios using multivariate
regression methods, charting methods, maps, and geographic information systems.
The obtained maps show that My Tho City and surrounding areas suffer the highest
drought level, in the future, it can reach medium and high levels.
Keywords: Drought Reconnaissance Index, PED, climate change, Tien River Estuary.
1. Introduction
In the context of climate change, drought often happens, seriously affecting the
local economy. To estimate the drought level, scientists have come up with many
approaches to calculate drought indices for different regions and territories around
the world. Drought can be classified into meteorological, agricultural, and
hydrological drought. Meteorological drought considers a phenomenon of lacking
moisture occurring due to a long period of rainfall less than the average for many years.
Thus the meteorological term is entirely mentioned natural conditions.
Received October 15, 2019. Revised October 22, 2019. Accepted October 29, 2019.
Contact Dao Ngoc Hung, e-mail address:
148
Scenarios of meteorological drought in Tien river estuary under the climate change context…
In the literature, drought indices vary from simple to complex algorithm, built with
different input data, and applied to calculate for different territories. The AAI (Aridity
Anomaly Index) meteorological index uses inputs data such as rainfall, temperature,
potential evaporation, evapotranspiration) to assess drought phenomenon for India
(World Meteorological Organization, 2012). To develop a meteorological drought
scenario, the above indices are not suitable, because climate change scenarios only
provide data on monthly average temperature and rainfall.
In Meteorological Deciles Index, developed by Australian scientists, rainfall is the
input for determining drought index. While the input of the Meteorological
Standardized Precipitation Index (SPI), recommended by the World Meteorological
Organization (World Meteorological Organization, 2012) is also rainfall [1-3].
However, if rainfall is lonely used to build a meteorological drought scenario, the
certainty is not high, because of the increase of temperature in the context of climate
change.
Wherefore Meteorological Drought Index such as Reconnaissance Drought Index
(RDI) [2, 4, 5], Keetch-Byram Drought Index (KBDI) [6], Weighted Anomaly
Standardized Precipitation (WASP) (Lyon, B., 2004), Aridity Index (AI) (Baltas, E.,
2007), Crop Moisture Index (CMI) (Palmer, WC, 1968) [7], Hydro-thermal Coefficient
of Selyaninov (HTC) using both and temperature and rainfall data will be a appropriate
approach to apply in the research topic.
In Southeast Asian countries, the research on meteorological drought also attracts
the interest of many scientists, especially CGIAR Research Center in Southeast Asia
(2016) conducted a direct observation and evaluation on the intensity and frequency of
droughts and saline intrusion in the Mekong Delta.
Thus, it can be seen that there have been many studies in the world working on
drought, using indices, or applying remote sensing images to assess the spatial extent of
drought. The limitation of these studies is that the drought indices have not been used
for appropriate territory, combined with climate change scenarios, remote sensing
images to develop meteorological drought scenarios. But, domestic and international
studies will be an important scientific principle to develop meteorological drouhght
scenarios for the Tien river estuary in the Mekong Delta.
In Vietnam, there have been also many researches relating to drought, a research
project on mapping the frequency of heat and drought in the Northern Delta region [8]
and mapping the frequency of heat and drought in the period of 1971 - 2015 for the
Northern Delta region. The objective of the study is to establish a drought classification
to illustrate and calculate the lack of wastewater in the Ba River basin using three
meteorological drought indices (Standardized rainfall index ( SPI), Drought Index (J)
and PED Index (PED). Doan Quang Tri et al. [9] successfully developed a drought map
of the Ba River basin. However, this study has not developed a drought scenario.
In recent years, there have been many studies on drought in the context of climate
change in the Mekong Delta in general and in Tien Giang and Ben Tre provinces in
particular. For instance, the works of Nguyen Dang Tin et al. [10, 11] have investigated
the current situation and stated the meteorological forecasting process in the Mekong
Delta. The study "Establishing drought maps of the Mekong Delta in the context of
149
D. N. Hung, N. T. Luan, V. T. Hang, T. V. Thuong, C. T. Phuong, B. T. T. Dung, D. V. Khac
climate change" [12] has also produced results of drought maps in the Mekong Delta.
Dao Ngoc Hung et al. [13, 14] developed a drought scenario in Tien Giang province in
the context of climate change. However, the obtained results are still limited, without
the reliability assessment of the research results.
The literature review of former works related to drought and drought scenario
shows that several existing issues have not been studied in-depth and have not been
thoroughly addressed as follows:
- Studies for other territories are not appropriate for the specific territory.
- Studies in the specific territory have not yet selected the drought index in
accordance with its natural characteristics.
- The previous research on the meteorological drought scenario of the Dao Ngoc
Hung [14] has just studied in Tien Giang province at an early stage and has not
evaluated the confidence of the obtained results.
Therefore, it is necessary to research to select suitable meteorological drought
indices according to the natural and socio-economic characteristics of Tien river estuary
area. The obtained results will be a prerequisite for sustainable socio-economic
development of the coastal areas of the estuary of the Tien river.
2. Content
2.1. Method and data
2.1.1. Method
* Data collection and processing method
In the process of developing a meteorological scenario in the Tien estuary area, it is
very important to collect relevant documents and data. Besides, this study requires a
continuous series of data for 40 years of different meteorological stations to ensure the
reliability of assessment, which is a principle for establishing the meteorological
drought scenario in the study area. The collected documents and data comprise of:
Statistics data for the period of 1978 - 2017 such as: temperature and rainfall of 2
meteorological stations My Tho and Ba Tri located in the study area, together with 8
surrounding meteorological stations; Climate change scenario with emissions levels of
8.5 and 4.5; Natural, socio-economic data. After collecting from various sources, data
have been processed and standardized to synchronize into a database.
* Estimating meteorological drought by PED index method
To estimate drought, the Ped's index [7] will be calculated:
(1)
where T and P are the difference in air temperature and precipitation related to a
specified time.
and
are standard deviations of air temperature and precipitation,
respectively. Target thresholds corresponding to climatic conditions are given in Table 1.
150
Scenarios of meteorological drought in Tien river estuary under the climate change context…
Table 1. Classification by PED index
PED
Drought characteristics
<0
Humidity
0 – 0.5
Normal
0.5 – 1
Start drought
1 – 1.5
Slightly drought
1.5 – 2
Medium drought
2 – 2.5
Quite high drought
2.5 – 3
Drought
>3
Severe drought
The power of this drought assessment method is that it is easily calculated using
temporal data series of temperature and rainfall. This input will be suitable for
developing a meteorological drought scenario in our study area.
* Multivariate regression method
To develop the meteorological drought scenario of the study area, the authors have
built a multivariate regression equation to evaluate the dependence of the drought index
on temperature and rainfall. The current drought situation in the period of 1978 - 2017
at the meteorological stations has been calculated and obtained results are applied to
solve the equation:
(2)
Based on equation (2), we determine the meteorological drought scenario for the
study area using climate change and sea-level rise scenario built in 2016 by the Vietnam
Ministry of Natural Resources and Environment [15].
* Diagrams, maps, and geographic information systems (GIS) method
In this study, the authors use charts in one hand to show the differentiation of data,
trend lines of temperature, rainfall, and PED index. On the other hand, GIS technology
is used to interpolate discontinuous data and then build drought iso-line maps for the
study area.
2.1.2. Data used
To conduct this study, the authors used several layers of data including:
The monthly average temperature and rainfall data for the period of 1978 - 2017 are
collected from the Meteorological and Hydrological Data Center.
151
D. N. Hung, N. T. Luan, V. T. Hang, T. V. Thuong, C. T. Phuong, B. T. T. Dung, D. V. Khac
Temperature and rainfall data for the periods of 2016 - 2035, 2046 - 2065 come
from the climate change and sea level rise scenarios built in 2016 by Vietnam of the
Ministry of Natural Resources and Environment [15].
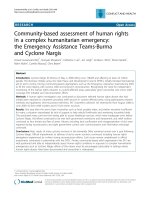
In terms of space, statistic data are collected from 10 meteorological stations in 2
provinces of Tien Giang, Ben Tre, and its neighbor provinces. Specifically, the data
were measured at meteorological stations: Vung Tau, Tan Son Nhat, My Tho, Ben Tre,
Ba Tri, Cao Lanh, Cang Long, Soc Trang, Bac Lieu, and Moc Hoa.
Figure 1. Location of meteorological station network (green dots) [16]
2.2. Research results
Based on the PED drought index, using annual temperature and rainfall at 10
meteorological stations in the study area, the meteorological drought index results in the
period of 1978 - 2017 were deduced. According to of the Meteorological and
Hydrological Data Center, for the past 40 years, in the South, there have been severe
drought occurring in 1983, 1986, 1988, 1996, 1998, and, especially, several phenomena
in recent time.
Figure 2 presents the result caculated for Ba Tri meteorological station (Ben Tre),
the PED index for 10 research stations has been estimated in a similar approach.
These annual average temperature, rainfall data in the period 1986 - 2005 are
considered as a baseline for adjusting the model and then deducing the value of
temperature and rainfall in the periods of 2016 - 2035 and 2046 - 2065 (Table 2).
152
PED year
Scenarios of meteorological drought in Tien river estuary under the climate change context…
3
2
1
0
-1
-2
-3
-4
-5
-6
2017
2016
2015
2014
2013
2012
2011
2010
2009
2008
2007
2006
2005
2004
2003
2002
2001
2000
1999
1998
1997
1996
1995
1994
1993
1992
1991
1990
1989
1988
1987
1986
1985
1984
1983
1982
1981
1980
1979
1978
Year
Figure 2. PED index by year at Ba Tri meteorological station (Ben Tre)
in the period of 1978 - 2017
Solving the multivariate regression system, with the dependent variable as the PED
drought index and independent variable as the annual average temperature and rainfall,
the dependency equation of PED, the annual temperature and rainfall is established
as follows:
(3)
Predictor
Coef
SE Coef
T
P
Constant
-35.81
0.1048
28.05
0.000
Temperature
1.529142
0.003783
-28.85
0.000
Precipitation
-0.00242997
0.00000606
95.73
0.000
S = 0.00745721
R-Sq = 99.7%
PRESS = 0.00282801
R-Sq (adj) = 99.7%
R-Sq(pred) = 99.60%
Analysis of Variance
Source
DF
SS
MS
F
P
Regression
2
0.70751
0.35376
6361.38
0.000
Residual Error
38
0.00195
0.00006
Total
40
0.70946
Source
DF
Seq SS
Temperature
1
0.19792
Precipitation
1
0.50959
Unusual Observations
Obs
Temp
RDI
Fit
SE Fit
Residual
St Resid
1
26.1
1.06009
1.04315
0.00309
0.01694
2.50R
25
27.4
0.44361
0.41816
0.00389
0.02544
4.00RX
153
D. N. Hung, N. T. Luan, V. T. Hang, T. V. Thuong, C. T. Phuong, B. T. T. Dung, D. V. Khac
with the correlation coefficient R² = 99.7%, the calculated results are highly reliable,
and the multivariate regression system is accepted.
Based on the data series of the meteorological stations, we calculate the value of
annual average temperature and rainfall in the baseline period of 1996 - 2015.
Table 2. PED scenario according to the climate change scenario of Tien estuary area
Province
/City
RCP4.5 Scenario
RCP8.5 Scenario
1996 - 2015
2016 - 2035
2046 - 2065
1996 - 2015
2016 - 2035
2046 - 2065
Ho Chi
Minh
X
-0.25349
0.825646
0.071514
0.071514
1.55173
Ba Ria
Vung
Tau
X
-0.62805
0.43341
-0.28307
-0.28307
1.106672
Long An
X
-0.34953
0.293388
-0.24946
-0.24946
1.273978
Vinh
Long
X
-0.08542
0.845618
0.000248
0.000248
1.480464
My Tho
0.769509
0.769509
1.673612
1.12419
1.12419
2.394118
Ba Tri
-0.31733
-0.04175
0.966896
0.229313
0.229313
1.583633
Can
Long
-0.2513
0.089603
0.894723
0.21488
0.21488
1.719994
Can Tho
0.104816
0.104816
0.997001
0.399483
0.399483
1.505461
Soc
Trang
-1.22558
-1.22558
-0.12166
-1.03906
-1.03906
0.167172
From the aforementioned data, ArcGIS software is used to interpolate the values to
build a PED index scenario map for the periods of 1996-2015, 2016 - 2035, and 2046 2065. The results are shown in Figure 3.
a) 1996 - 2015 period
Figure 3. Current state and PED scenario according to climate change scenario
in the Tien River etsuary area
154
Scenarios of meteorological drought in Tien river estuary under the climate change context…
RCP4.5 Scenario
b) 2016 - 2035 period
d) 2046 - 2065 period
RCP8.5 Scenario
c) 2016 - 2035 period
e) 2046 - 2065 period
Figure 3. Current state and PED scenario according to climate change scenario
in the Tien River etsuary area
3. Conclusions
Tien River estuary area has a tropical monsoon climate, characterized by a rainy
season and a dry season, deeply affected by climate change. Through the analysis of
PED drought index, the authors recognized that the drought situation in the study area is
the following:
- Over time, from 1996 to 2005 (20 years), on an annual average, the entire study
area was not affected by drought. However, whether under the medium-low emission
scenario or the high emission scenario, drought level will increase over time from slight
to a high level.
155
D. N. Hung, N. T. Luan, V. T. Hang, T. V. Thuong, C. T. Phuong, B. T. T. Dung, D. V. Khac
- By space, the study area is drier than the surrounding area, especially the strongest
level at My Tho meteorological station (Tien Giang) and its surrounding areas. Here, by
the period of 2046-2045, the forecasted drought level will reach a slight level under
RCP 4.5 emission scenario or high drought level under RCP 8.5 emission scenario.
- Based on the results of climate change scenarios, the development of a drought
scenario for the future using the meteorological drought indexes has practical
significance. This drought scenario is a valuable document in management and
decision-making. It provides an orientation for sustainable socio-economic development
in this area, especially in the replacement of drought-resistant and salt-tolerant species
in agricultural production.
Acknowledgement: This research is funded by the ministerial-level project entitled
"Developing meteorological drought scenarios for sustainable socio-economic
development in Tien River estuary area (Mekong Delta) in the context of climate
change."; the project code B2019-SPH - 03.
REFERENCES
[1] McKee T.B., Doesken N.J., Kleist, J., 1993. The relationship of drought frequency
and duration to time scales. Proceedings of the 8th International Conference on
Applied Climatology, 17-22 January 1993, Anaheim, California, pp. 179-184.
[2] Tsakiris G., Pangalou D., Vangelis H., 2007. Regional drought assessment based
on the Reconnaissance Drought Index (RDI). Water Resources Management
21:821-833.
[3] Tigkas D., Vangelis H., Tsakiris G., 2019. Drought characterisation based on an
agriculture-oriented standardised precipitation index. Theoretical and Applied
Climatology, 135(3-4): 1435-1447, doi: 10.1007/s00704-018-2451-3.
[4] Tsakiris G., Pangalou D., Vangelis H., 2007. Regional drought assessment based
on the Reconnaissance Drought Index (RDI). Water Resources Management
21:821-833.
[5] Tigkas D., Vangelis H., Tsakiris G., 2017. An Enhanced Effective Reconnaissance
Drought Index for the Characterisation of Agricultural Drought. Environmental
Processes, 4(suppl 1): 137–148, doi: 10.1007/s40710-017-0219-x.
[6] Finkele, Klara; Mills, Graham A, 2006. National gridded drought factors and
comparison of two soil moisture deficit formulations used in prediction of Forest
Fire Danger Index in Australia. Australian Meteorological Magazine. 55 (3): 183-197.
[7] Ped DA (1975). On parameters of drought and humidity. Papers of the USSR
hydrometeorological center, 156, pp. 19-38 (in Russian).
[8] Le Thi Hue, Nguyen Van Bay, and Vo Van Hoa, 2018. Researching on mapping
the frequency of heat and drought in the Northern Delta region. Journal of
Meteorology and Hydrology, Vol. No. 688, No. ISSN 2525-2008, pp. 36-44.
156
Scenarios of meteorological drought in Tien river estuary under the climate change context…
[9] Nguyen Dang Tinh, 2011. Determining the possibility and assessing the level of
meteorological drought in the Mekong Delta. Journal of Irrigation Engineering
Science and Environment, vol. 28, pp. 14-21.
[10] Nguyen Dang Tinh, Nguyen Trinh Chung, and Truong Quoc Binh, 2012. Building
meteorological forecasting technology in the Mekong Delta. Ournal of Irrigation
Engineering Science and Environment, Vol. 37, pp. 78-83.
[11] Tran Van Ty, Dang Thi Thu Hoai, and Huynh Vuong Thu Minh, 2015. Developing
drought map of the Mekong Delta in the context of climate change. Journal of
Science, Can Tho University, pp. 226-233.
[12] Dao Ngoc Hung, Truong Van Tuan, Ta Thi Ngoc Bich, and Tran Van Thuong,
2015. Drought fluctuations in the dry season in Tien Giang province in the period
of 1980 - 2015. Proceedings of scientific workshops - Hanoi National University of
Education, pp. 34-40.
[13] Ministry of Natural Resources and Environment, 2016. Climate change and sea
level rise scenarios for Vietnam.
[14] Hydrometeorological Data Center, 2015. Network of meteorological stations in
the South.
157